HAL Id: hal-00577605
https://hal.archives-ouvertes.fr/hal-00577605
Submitted on 17 Mar 2011
HAL is a multi-disciplinary open access
archive for the deposit and dissemination of
sci-entific research documents, whether they are
pub-lished or not. The documents may come from
teaching and research institutions in France or
L’archive ouverte pluridisciplinaire HAL, est
destinée au dépôt et à la diffusion de documents
scientifiques de niveau recherche, publiés ou non,
émanant des établissements d’enseignement et de
recherche français ou étrangers, des laboratoires
Investigation on reconstruction methods applied to 3D
terahertz computed tomography
Benoît Recur, A. Younus, S. Salort, Patrick Mounaix, B. Chassagne, P.
Desbarats, J.-P. Caumes, Emmanuel Abraham
To cite this version:
Benoît Recur, A. Younus, S. Salort, Patrick Mounaix, B. Chassagne, et al.. Investigation on
recon-struction methods applied to 3D terahertz computed tomography. Optics Express, Optical Society of
America - OSA Publishing, 2011, 19 (6), pp.5105-5117. �10.1364/OE.19.005105�. �hal-00577605�
Investigation on reconstruction methods
applied to 3D terahertz computed
tomography
B. Recur,3A. Younus,1S. Salort,2P. Mounaix,1B. Chassagne,2 P. Desbarats,3J-P. Caumes,2and E. Abraham1,∗
1LOMA, Universit´e de Bordeaux / CNRS, 351 Cours de la Lib´eration, 33405 Talence Cedex, France
2ALPhANOV, Centre Technologique Optique et Lasers, Universit´e de Bordeaux, 351 Cours de la Lib´eration, 33405 Talence Cedex, France
3LaBRI, Universit´e de Bordeaux / CNRS, 351 Cours de la Lib´eration, 33405 Talence Cedex, France
Abstract: 3D terahertz computed tomography has been performed using a monochromatic millimeter wave imaging system coupled with an infrared temperature sensor. Three different reconstruction methods (standard back-projection algorithm and two iterative analysis) have been compared in order to reconstruct large size 3D objects. The quality (intensity, contrast and geometric preservation) of reconstructed cross-sectional images has been discussed together with the optimization of the number of projections. Final demonstration to real-life 3D objects has been processed to illustrate the potential of the reconstruction methods for applied terahertz tomogra-phy.
© 2011 Optical Society of America
OCIS codes: (110.6795) Terahertz imaging; (110.6955) Tomographic imaging; (100.6890)
Three-dimensional image processing; (170.3010) Image reconstruction techniques; (120.5800) Scanners.
References and links
1. W. L. Chan, J. Deibel, and D. M. Mittleman, “Imaging with terahertz radiation,” Rep. Prog. Phys. 70, 1325-1379 (2007).
2. K. Kawase, Y. Ogawa, Y. Watanabe, and H. Inoue, “Non-destructive terahertz imaging of illicit drugs using spectral fingerprints,” Opt. Express 11, 2549–2554 (2003).
3. Y. C. Shen, T. Lo, P. F. Taday, B. E. Cole, W. R. Tribe, and M. C. Kemp, “Detection and identification of explosives using terahertz pulsed spectroscopic imaging,” Appl. Phys. Lett. 86, 241116 (2005).
4. K. Fukunaga and M. Picollo, “Terahertz spectroscopy applied to the analysis of artists materials,” Appl. Phys. A
100, 591–597 (2010).
5. E. Abraham, A. Younus, J.-C. Delagnes, and P. Mounaix, “Non-invasive investigation of art paintings by terahertz imaging,” Appl. Phys. A 100, 585–590 (2010).
6. S. Y. Huang, Y. X. J. Wang, D. K. W. Yeung, A. T. Ahuja, Y. T. Zhang, and E. Pickwell-MacPherson, “Tissue characterization using terahertz pulsed imaging in reflection geometry,” Phys. Med. Biol. 54, 149–160 (2009). 7. J. Takayanagi, H. Jinno, S. Ichino, K. Suizu, M. Yamashita, T. Ouchi, S. Kasai, H. Ohtake, H. Uchida,
N. Nishizawa, and K. Kawase, “High-resolution time-of-flight terahertz tomography using a femtosecond fiber laser,” Opt. Express 17, 7549–7555 (2009).
8. K. Iwaszczuk, H. Heiselberg, and P. U. Jepsen, “Terahertz radar cross section measurements,” Opt. Express 18, 26399–26408 (2010).
9. B. Ferguson, S. Wang, D. Gray, D. Abbot, and X. C. Zhang, “T-ray computed tomography,” Opt. Lett. 27, 1312– 1314 (2002).
10. E. Abraham, A. Younus, C. Aguerre, P. Desbarats, and P. Mounaix, “Refraction losses in terahertz computed tomography,” Opt. Commun. 283, 2050–2055 (2010).
11. S. Wang, B. Ferguson, D. Abbott, and X. C. Zhang, “T-ray imaging and tomography,” J. Biol. Phys. 29, 247–256 (2003).
12. S. Wang and X. C. Zhang, “Pulsed terahertz tomography,” J. Phys. D: Appl. Phys. 37, R1–R36 (2004). 13. M. M. Awad and R. A. Cheville, “Transmission terahertz waveguide-based imaging below the diffraction limit,”
Appl. Phys. Lett. 86, 221107 (2005).
14. X. Yin, B. W. H. Ng, B. Ferguson, and D. Abbott, “Wavelet based local tomographic image using terahertz techniques,” Digit. Signal Process. 19, 750–763 (2009).
15. A. Brahm, M. Kunz, S. Riehemann, G. Notni, and A. T¨unnermann, “Volumetric spectral analysis of materials using terahertz-tomography techniques,” Appl. Phys. B 100, 151–158 (2010).
16. K. L. Nguyen, M. L. Johns, L. F. Gladden, C. H. Worral, P. Alexander, H. E. Beere, M. Pepper, D. A. Ritchie, J. Alton, S. Barbieri, and E. H. Linfield, “Three-dimensional imaging with a terahertz quantum cascade laser,” Opt. Express 14, 2123–2129 (2006).
17. A. Younus, S. Salort, B . Recur, P . Desbarats, P . Mounaix, J-P. Caumes, and E. Abraham, “3D millimeter wave tomographic scanner for large size opaque object inspection with different refractive index contrasts,” in Millimetre Wave and Terahertz Sensors and Technology III, K.A. Krapels and N.A. Salmon, eds., Proc. SPIE
7837, 783709 (2010).
18. N. Sunaguchi, Y. Sasaki, N. Maikusa, M. Kawai, T. Yuasa, and C. Otani, “Depth-resolving terahertz imaging with tomosynthesis,” Opt. Express 17, 9558–9570 (2009).
19. T. Yasuda, T. Yasui, T. Araki, and E. Abraham, “Real-time two-dimensional terahertz tomography of moving objects,” Opt. Commun. 267, 128–136 (2006).
20. T. Yasui, K. Sawanaka, A. Ihara, E. Abraham, M. Hashimoto, and T. Araki, “Real-time terahertz color scanner for moving objects,” Opt. Express 16, 1208–1221 (2008).
21. G. T. Herman, Image Reconstruction From Projections : The Fundamentals of Computerized Tomography (Aca-demic Press Inc., 1980).
22. A. H. Andersen and A. C. Kak, “Simultaneous algebraic reconstruction technique (SART): a superior implemen-tation of the ART algorithm,” Ultrason. Imaging 6, 81–94 (1984).
23. L. A. Shepp and Y. Vardi, “Maximum likelihood reconstruction for emission tomography,” IEEE Trans. Med. Imaging 1, 113–122 (1982).
24. H. M. Hudson and R. S. Larkin, “Accelerated image reconstruction using ordered subsets of projection data,” IEEE Trans. Med. Imaging 13, 601–609 (1994).
25. C. Pradere, J.-P. Caumes, D. Balageas, S. Salort, E. Abraham, B. Chassagne, and J.-C. Batsale, “Photothermal converters for quantitative 2D and 3D real-time terahertz imaging,” Quant. Infrared Thermog. 7, 217–235 (2010). 26. P. Toft, “The Radon Transform : Theory and Implementation,” Ph.D. thesis, Department of Mathematical
Mod-elling, Section for Digital Signal Processing, Technical University of Denmark (1996).
27. J. Radon, “ ¨Uber die Bestimmung von Funktionen durch ihre Integralwerte langs gewisser Mannigfaltigkeiten.” Ber. Ver. Sachs. Akad. Wiss. Leipzig, Math-Phys. Kl 69, 262–277 (1917). In German. An english translation can be found in S. R. Deans : The Radon Transform and Some of Its Applications.
28. R. Gordon, R. Bender, and G. T. Herman, “Algebraic Reconstruction Techniques (ART) for Three-dimensional Electron Microscopy and X-ray Photography,” J. Theor. Biol. 29, 471–481 (1970).
29. B. Recur, “Qualit´e et Pr´ecision en Reconstruction Tomographique : Algorithmes et Applications,” Ph.D. thesis, LaBRI, Bordeaux 1 University (2010).
30. Z. Wang, A. C. Bovik, H. R. Sheikh, and E. P. Simoncelli, “Image quality assessment: from error visibility to structural similarity,” IEEE Trans. Image Process. 13 600–612 (2004).
1. Introduction
In the field of 3D imaging, X-Ray Computed Tomography (CT) is an ubiquitous technique which provides cross-sectional images of an object by analyzing the radiation transmitted by the sample through different incidence angles. This technique can visualize 3D dense materials such as wood, bones and biological tissues but cannot be easily applied to soft materials such as plastics, papers or paintings owing to the low absorption of the X-Ray radiation. Alternatively, terahertz (THz) radiation proposes attractive features such as non-invasive and non-destructive analysis, transparency and good penetration depth through various materials [1]. All these prop-erties make THz radiation very promising for direct applications in non-destructive inspection, detection of illicit drugs [2] and explosives [3], art conservation [4,5] and biomedical appli-cations [6]. For 3D THz imaging, reflection tomography and cross section measurements have been proposed using for instance the time-of-flight of reflected THz pulses [7,8]. Especially
in 2002, THz CT has been proposed for 3D imaging of opaque materials [9]. Ferguson et al. demonstrated that cross-sectional images can be obtained by measuring the transmitted ampli-tude and phase of broadband THz pulses at multiple projection angles. However, it has been emphasized that several peaks in the THz waveform obtained with a time-domain spectrometer strongly complicate the signal analysis [10]. Although THz CT seems powerful, few papers have been published since the technique suffers from strong limitations [9,11,12,13,14,15]. The first limitation concerns the diffraction effects and Fresnel losses experienced by the propagation of the THz wave through the sample [9]. Until now, most samples that have been imaged using THz CT were made of polystyrene or similar low refractive index materials. However, as soon as the refractive index of the sample is in the order or greater than 1.5, which represents the majority of realistic samples, the THz beam is strongly refracted by the sample and the transmitted signal is very difficult to detect. Therefore, in THz CT, it is always difficult to discriminate if the imaging contrast arises from sample absorption or deviation of the THz beam by refraction. One possibility of differentiation is to perform pulsed THz CT and measure the phase of the transmitted signal [9].
The second limitation is the long acquisition time required by pulsed THz system based on time-domain spectrometer, since it used a point-to-point measurement associated with a tem-poral sampling and the rotation of the sample. This limitation can be reduced by the utilization of a continuous wave THz source even if in this case the phase information of the object can not be extracted [16,17]. The limitation is also directly connected to the number of projection data. To reduce this parameter, a recent study proposed the development of depth-resolving THz imaging with tomosynthesis, which is similar to CT except that the number of projec-tions is much smaller [18]. The authors used only five projections instead of generally 15 to 20 in THz CT. However, the efficiency of their system was mainly limited to thin and wide samples (50 sheets of post-it notes). Another method to perform fast THz imaging consists in illuminating the sample by a focused THz line and detecting the THz radiation by non-collinear electro-optical time-to-space conversion in a non-linear crystal [19,20].
Finally, it is obvious that an important consideration in CT concerns the choice of the recon-struction method to be able to visualize the different cross-sectional images and the final 3D volume of the sample. Usually, a back-projection of the filtered projections (BFP) is employed as the standard reconstruction method [21]. The analysis is based on Radon inverse transforma-tions from the projection data. In the case of THz CT, to our knowledge, only this BFP method has been employed since it is proposed in most conventional mathematical softwares. However, in X-Ray CT, it is well-known that BFP suffers from several disadvantages such as beam hard-ening, noise sensitivity and geometric degradation in case of insufficient number of projections. Consequently, alternative iterative reconstruction methods have been proposed for X-Ray CT such as the Simultaneous Algebraic Reconstruction Technique (SART) [22] and the Ordered Subsets Expectation Maximization (OSEM) method [23,24]. These alternative iterative recon-struction methods have never been applied to THz CT. In this paper, to the first time to our knowledge, we propose to test and compare these three reconstruction methods (BFP, SART, OSEM) applied to THz CT. Especially, a particular interest will concern the optimization of the number of projections associated with the preservation of the image quality. For this study, we employed a flexible and easy-to-align system based on a continuous millimeter wave source and a commercial pyroelectric sensor.
The paper is organized as follows. In the first part, the experimental setup and the spatial resolution of the system will be presented. Then, the reconstruction methods will be exposed and evaluated taking into account the number of projections and the quality (intensity, contrast, noise, geometric preservation) of the final reconstructed cross-sections. Finally, challenges for precise and efficient tomographic reconstruction of complex refraction index materials will be
underlined in order to demonstrate the potential of the proposed 3D millimeter wave tomo-graphic scanner.
2. Experimental setup
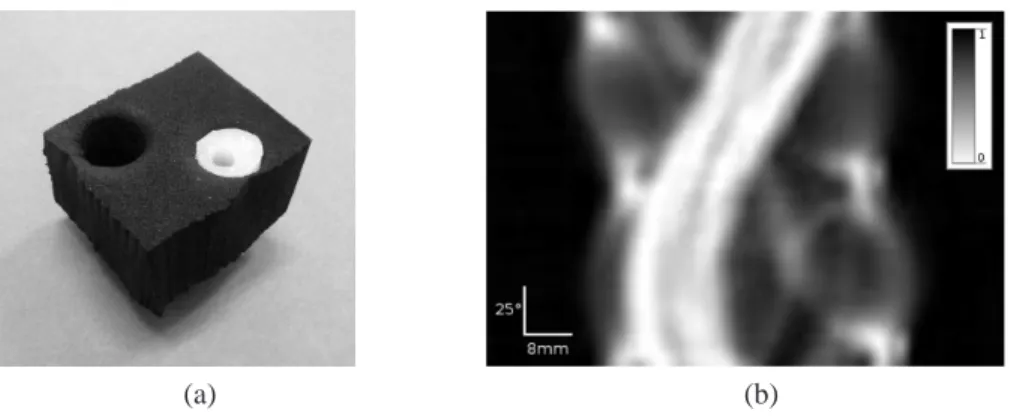
The experimental setup of the 3D millimeter wave tomographic scanner is shown in Fig.1(a). The output beam of a compact millimeter wave Gunn diode coupled with a horn antenna is col-limated using an off-axis parabolic mirror M ( f′= 150 mm). Two different Gunn diodes have
been used: a 80 GHz diode coupled to a frequency tripler delivering 0.3 mW at 240 GHz and a 110 GHz diode delivering 20 mW. The advantage of the 240 GHz source is essentially the better spatial resolution (wavelength 1.25 mm), whereas the second source has a much larger output power. The THz beam is then focused with a Teflon lens L ( f′= 60 mm) on the sample S which
is positioned on three-axes XY-θ motorized stages, the angleθ corresponding to a rotation around the vertical Y-axis. For the 110 GHz source, Fig.1(b) shows the 2D transversal profile of the THz beam at the beam waist visualized using a photothermal THz convertor (Teracam-Alphanov, [25]). This result shows that, at the sample position S, the beam profile is homoge-neous with a Gaussian circular shape (4 mm beam diameter, measured at FWHM) in agreement with the theoretical values obtained from the propagation of Gaussian beams. Similarly (data not shown), at the same position, a FWHM beam diameter of 2 mm has been measured with the 240 GHz source. These results indicate that the spatial resolution of the 3D millimeter wave tomographic scanner is limited to a few millimeters owing to the long wavelength of the emit-ting sources. Consequently, the system is more adapted for the visualization of sub-centimeter structures within large size object, typically more than(100 × 100 × 100) mm3. Moreover, to
properly apply THz CT reconstruction algorithms and avoid depth resolution degradation, the target’s lateral extent in the direction of the THz wave vector has to be in the order of the con-focal parameter of the THz beam [11]. Here, we can estimate that this confocal parameter is about 20 mm, which is compatible with the size of the tested samples. Symmetrically, the focal volume is imaged using a similar arrangement on a commercial low-cost pyroelectric sensor (Spectrum Detector Inc.). For data acquisition with the pyroelectric sensor, the THz beam is modulated at 20 Hz by an optical chopper and the amplitude of the transmitted THz is acquired with a lock-in amplifier.
(a) (b)
Fig. 1. (a) Experimental setup. C: optical chopper, L: Teflon lens ( f′= 60 mm), M:
off-axis parabolic mirror ( f′= 150 mm), S: sample, D: pyroelectric detector. (b) 2D spatial
profile of the THz beam waist at the sample position (110 GHz source) visualized with a photothermal THz convertor (Teracam).
In order to perform a 3D reconstruction of volumetric object, the experimental procedure is organized as follows [17]. First, we record a 2D transmission image of the sample by moving the object in the X and Y directions with a scan step of 0.5 mm or 1 mm in both directions. With a scan speed of 5 pixels/sec, the acquisition time for a(100 × 100) pixels image size is about
30 minutes. Then, the sample is rotated by a rotation step dθ in order to provide a different visualization of the object. The operation is repeated Nθ times fromθ = 0◦toθ= 180◦and we finally get a set of Nθ projections of the sample corresponding to the different angles of visualization. For instance, if Nθ = 18, dθ = 10◦ and the total acquisition time is about 9 hours for the complete 3D visualization of the sample. However, to visualize only a single cross-sectional image of the sample, corresponding to a 100 pixels horizontal scan associated to 18 different projections, this acquisition time is reduced to approximately 6 minutes. From these projection data, we are able to construct the sinogram of the object which represents, for a given horizontal slice, the evolution of the transmitted THz amplitude as a function of the rotation angle. Finally we apply the BFP, SART or OSEM algorithms to reconstruct the final 3D volume of the sample.
3. Tomographic reconstruction methods
Tomography is used to reconstruct the volume of an object from the set of projections done from the exterior of the object [21,26]. This technique, widely developed in X-Ray CT scan imaging, is modeled by the Radon theorem [27]. The direct transform R describes the projection line acquisition. It maps a 2D function defined by f(x, y) into a 1D projection along an angleθand a moduleρ. It is defined by the following formula:
Rθ(ρ) = Z ∞
−∞ Z ∞
−∞
f(x, y)δ(ρ− x cosθ− y sinθ)dxdy (1)
whereθ andρ are respectively the angular and radial coordinates of the projection line(θ,ρ)
andδ is the Dirac impulse. Then, Rθ(ρ) represents the absorption sum undergone by the
ray along the line. As an illustration, let us consider a black foam parallelepiped (absorbance
α= 0.02 cm−1, refractive index 1.1) with a(41 × 49) mm2cross section. The parallelepiped is
drilled by two holes (15 mm diameter): one hole with air and another hole filled by a Teflon cylinder (absorbanceα< 1 cm−1, refractive index 1.45) having a small cylindrical air hole
in-side (6 mm diameter) (Fig.2(a)). For one horizontal cross-section, the acquisition along several angles gives a sinogram composed with Nθ lines, corresponding to the number of projections, and Nρcolumns corresponding to the number of pixels in the horizontal direction. For instance, Fig.2(b) represents the sinogram acquired with the 110 GHz source with Nθ = 72 projections
(dθ= 2.5◦) and Nρ= 128 horizontal pixels (0.5 mm scan step). The black color corresponds to
a maximum transmitted signal whereas the white color indicates a decrease of the transmitted signal. Similar color coding has been applied throughout the paper. Low signal intensity can be due to either absorption either deviation of the THz beam due to refraction. Here, owing to the low absorbance of Teflon, mainly refraction losses have to be considered since the Teflon cylin-der acts as a lens. Before the application of any reconstruction method, this sinogram already reflects the global geometric structure of the sample cross-section with especially the presence of the refracting Teflon material. A more precise description of the THz imaging of this sample will be presented in section 4.
The reconstruction process is given by the inverse Radon transform which recovers the original domain from the projections. Given a sinogram S containing several Rθ(ρ) values
(a) (b)
Fig. 2. (a) Photograph of original object: parallelepiped black foam(41 × 49) mm2with 2
holes, diameter 15 mm (1 hole with air and 1 hole containing a Teflon cylinder with a 6 mm
cylindrical air hole inside). (b) Sinogram with Nθ = 72 projections (lines) and Nρ= 128
samples per projection (columns). Acquisition with the 110 GHz source.
follows: I(i, j) = Nθ−1
∑
iθ=0 Nρ 2∑
ρ=−Nρ2 Wθ(iθ)(ρ)A(θ,ρ),(i, j) (2) where: • θ(iθ) = iθNπθ,• A(θ,ρ),(i, j) is the weight-matrix defining the weight value between each pixel and each projection line, • Wθ(ρ) = Nρ 2
∑
ν=−Nρ2 |ν| Nρ 2∑
ρs=−Nρ2 Rθ(ρs)e−i2πρsν ei2πρν.First, this inversion filters each projection Rθin the Fourier domain with the ramp filter|ν| to
increase geometric details. Second, it computes the pixel values from the filtered projections
Wθ(iθ). This method is thus denoted back-projection of filtered projections (BFP). As already pointed out in the introduction, this technique is widely used in THz CT imaging since it is proposed in most of CT software tools.
However, it is known that BFP suffers from several drawbacks such as noise sensitivity and beam hardening. Especially the beam hardening phenomenon induces artifacts such as cupping, streaks and blurring because rays from some projection angles are hardened to a differing extent than rays from other angles, confusing the reconstruction algorithm. Moreover BFP is very sensitive to the projection number Nθ. If this number is too low, beam hardening artifacts will be enhanced. This number Nθ is also very critical because it acts on the global acquisition time, which is particularly important in THz CT imaging. Consequently, in this paper, we also investigated other reconstruction methods allowing to reduce the projection number (i.e. the acquisition time) while preserving reconstruction quality.
Particularly, several CT imaging systems are based on iterative reconstructions such as SART [22] or OSEM [24] algorithms. The SART algebraic method is based on the Karcz-marz algorithm used to approach the solution of the linear equation system I= ATR, where I
following k∈ [0 · · · Niter[. Each sub-iteration s, 0 ≤ s < Nθ, updates each pixel of the image Ik,s
by comparing the original projection Rθswith Rkθ
s(computed from I
k,s−1by using direct Radon
transform). A super-iteration k is over when all the projections have been used. Consequently, pixel update using SART is computed as follows:
Ik,s(i, j) = Ik,s−1(i, j) +λ Nρ−1
∑
ρ=0 A(θs,ρ),(i, j) " Rθ s(ρ) − R k θs(ρ) Dθs(ρ) # Nρ−1∑
ρ=0 A(θs,ρ),(i, j) (3) where Dθs(ρ) = W−1∑
i=0 H−1∑
j=0A(θs,ρ),(i, j)is the norm of the segment(θs,ρ) crossing the image and
(W × H) is the image size. Iterations are performed until the convergence of the solution. The
initial I0,0image is usually an uniform image.
OSEM algorithm [23] is another iterative process which slightly differs from the SART. The update is done from a subset of several projections at once and the error correction is multiplicative: Ik+1(i, j) = I(i, j)k Nθ−1
∑
iθ=0 Nρ−1∑
ρ=0 A(θ,ρ),(i, j)Rθ(ρ) Rkθ(ρ) Nθ−1∑
iθ=0 Nρ−1∑
ρ=0 A(θ,ρ),(i, j) (4)With the OSEM method, the convergence of the solution is longer than with the SART method because OSEM directly uses all the projections at once. Moreover, after convergence to the solution, OSEM is very sensitive to any solution divergence so that it needs non-trivial reg-ularizations to reduce induced artifacts. However, OSEM reconstruction quality is commonly higher than SART and BFP ones. If we assume that the complete computation time is 1 second for BFP, we can estimate that this time increases to 4 seconds for SART and 7 seconds for OSEM. In all cases, even if the OSEM computation time is longer than other methods, it is still negligible compared to the long acquisition time required for THz CT.
4. Quality and accuracy according to the projection number and the reconstruction method
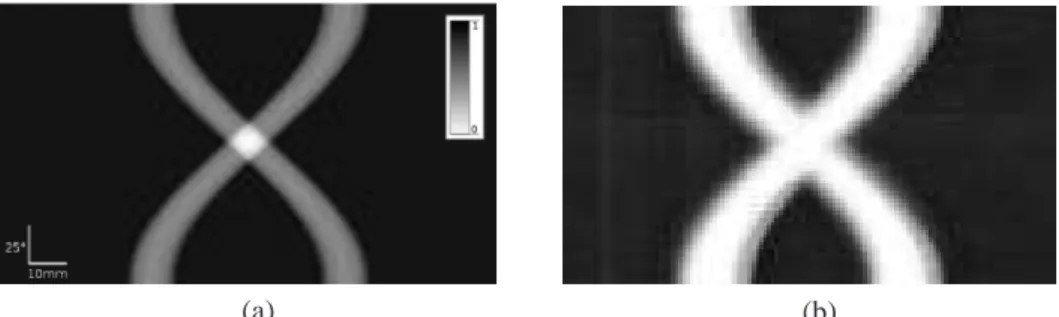
In this section, we deal with the result accuracy and quality according to the projection num-ber and the choice of the reconstruction method (BFP, SART, OSEM). First, to evaluate the accuracy of the reconstruction, let us consider a simple sample composed of two metallic bars (12 mm diameter) separated by a distance of 50 mm. The data were acquired along Nθ= 72
pro-jections, which represents the maximum projection number selected in our study. Here with a rather important projection number, we want to investigate our potential to precisely localize the two bars and reconstruct their cylindrical shape, depending on the choice of the reconstructed method. The ideal theoretical sinogram is represented in Fig.3(a). It has been calculated by direct Radon transformation of a continuous synthetic model representing the two metallic bars and illustrates the density variation of the sample. The experimental sinogram obtained with the millimeter wave tomographic scanner (110 GHz source) is represented in Fig.3(b). The experimental sinogram highlights that the metallic bar contours are thicker compared to the ideal case. This is due to the millimeter lateral resolution determined by the diameter of the
THz beam at the sample position, as explained in section 2. The reconstructions of the corre-sponding cross sections are presented in Fig.4. Here, we can point out that the depth resolution of the cross sectional images is also directly related to THz spot size at the sample position since the projection corresponding to the angleθ+π/2 will provide the depth information of
the projection corresponding to the angleθ. Consequently, the lateral resolution is equal to the depth resolution of the cross-sectional images. The ideal theoretical cross section presented in Fig.4(a) has been calculated from a synthetic representation of the sample. Arbitrarily, using a 8-bit encoding imaging, a 255 grey level pixel represents the position of the metallic bars whereas a 0 grey level pixel stands for the air. It appears that all the reconstruction methods are able to properly localize both metallic bars. However, it seems that both BFP (Fig.4(b)) and SART (Fig.4(c)) slightly suffer from noise artifacts around the bars, whereas the OSEM cross section (Fig.4(d)) presents a more uniform background. To investigate more into details the accuracy of the reconstruction, Fig.5represents, for the ideal case and the three reconstruction methods, the intensity profiles along the horizontal line intercepting the center of both metallic bars. The profiles show that the three methods are limited by insufficient experimental imaging resolution. Whatever the reconstruction method is, we can observe a spreading of the profile compared to the ideal result. The spreading is slightly intensified in the case of OSEM, which indicates that this method will provide a stronger image degradation compared with BFP and SART. This point will be precise at the end of this section.
(a) (b)
Fig. 3. Sinograms of two metallic bars (12 mm diameter) separated by 50 mm, with a
pro-jection number Nθ = 72. (a) Ideal theoretical sinogram calculated by direct Radon
trans-formation of a synthetic model. (b) Acquisition using the millimeter wave tomographic scanner with the 110 GHz source. Same scale and range as in (a).
(a) (b) (c) (d)
Fig. 4. Cross sections of two metallic bars (12 mm diameter) separated by 50 mm. (a) Ideal
synthetic cross section of the sample. (b) BFP reconstruction from3(b). (c) SART
0 50 100 150 200 250 300 0 20 40 60 80 100 120 140 Intensity (a.u.) position (mm) ideal BFP SART OSEM
Fig. 5. Intensity profiles along the horizontal line intercepting the center of both metallic bars (from Fig.4).
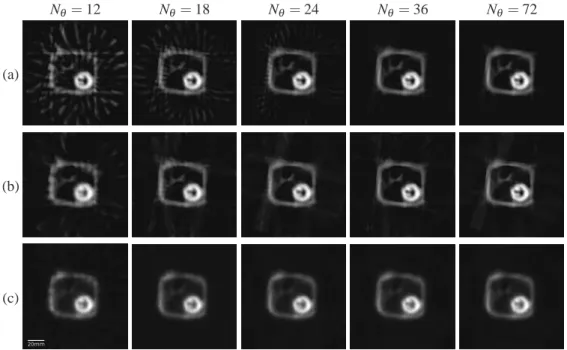
Depending on the number of projections, we analyzed the quality of the reconstruction by using the previous manufactured phantom already shown in Fig.2. Reconstructions are per-formed using the three methods from sinograms obtained with 12 to 72 projections. Results are shown in Fig.6. First, we describe the reconstruction on a qualitative point of view. For all reconstruction methods, we can notice that the image quality does not present any significant improvement from 36 to 72 projections. Consequently, the projection number has been limited to 72 in our study. Whatever the reconstruction method is, the black foam parallelepiped, the air hole and the Teflon cylinder are revealed. However, the air hole inside the Teflon cylinder, which appears as sideways T in the reconstructed cross sections, is hardly distinguished owing to the strong refraction experienced by the THz beam at the Teflon cylinder interfaces. For BFP, we notice a significant improvement of the reconstruction if the number of projections increases from 12 to 72. Especially, serious background artifacts identified as beam hardening are visible for Nθ = 12. This behavior is well known in tomography since BFP is very sensitive to the
number of projections. For SART, this problem is strongly reduced even if some background artifacts are still noticeable for Nθ= 12. For OSEM, it seems that the reconstruction quality is
constant whatever is the number of projection in the range 12 to 72. However, as pointed out previously with the two metallic bars, we can observe a small degradation of the reconstruction accuracy for OSEM compared with BFP and SART with blurred contours of the foam paral-lelepiped. This degradation is directly connected to the OSEM algorithm which uses a subset of several projections at once with a multiplicative error correction.
Afterwards, we analyzed the image quality on a quantitative point of view. Numerically, a complete comparison of BFP, SART and OSEM has already been performed from synthetic digital images [29]. It clearly indicates that, if the number of projections is sufficient (to be defined depending on the experimental technique), OSEM image quality is worse (especially contour accuracy) than BFP and SART images. However, in case of THz CT, we are mostly in-terested in the evolution of the image quality as a function of the projection number. Especially, the key-point concerns the preservation of the image quality for a limited number of projec-tions (typically less than 20 projecprojec-tions). Quantitatively, the image quality can be determined using the structural similarity (SSIM) parameter measured between a reference image I and a
transformed image It. The SSIM parameter is given by [30]:
SSIM(I, It) = l(I, It) · c(I, It) · r(I, It) (5)
where l(I, It), c(I, It) and r(I, It) are the intensity, contrast and geometric equivalence rates
between both images, respectively. The image I is the reference corresponding to the 72 pro-jection sinogram, whereas the images It are reconstructed from Nθ = 12 to Nθ = 36. Table1
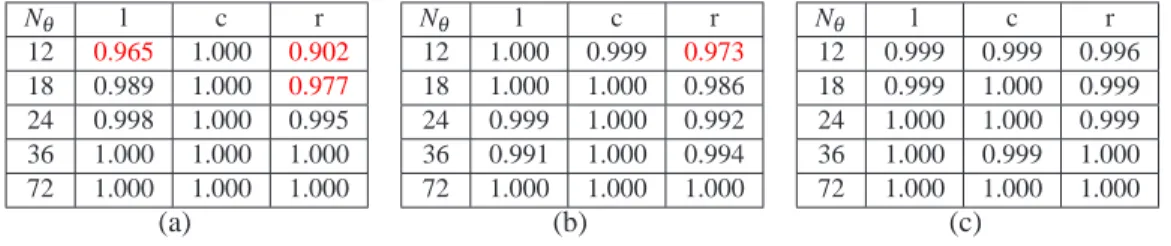
details the three equivalence rates obtained by BFP (Table1(a)), SART (Table1(b)) and OSEM (Table1(c)) methods according to the projection number. Here, it is important to notice that these tables are independent and cannot be compared each others since, for each table, the re-constructed image obtained with Nθ= 72 is considered as the reference with all metric values
set to unity. However, for each reconstruction method and depending on the projection number, the tables indicate the image degradation with respect to the intensity, contrast and geometric preservation. We can notice that all metric values slightly decrease whatever the method, but
r(I, It) especially decreases significantly with BFP (indicated in red color in Table1(a)). Then,
the SSIM parameter of BFP is mainly deteriorated because the geometrical aspect of the image is not well preserved. For SART, the global image quality is already optimized with Nθ = 18.
For SART, it appears that the method is almost insensitive to the projection number. However, as pointed out previously, we have to keep in mind that this method also provides a general vagueness in the final reconstructed image.
Nθ= 12 Nθ= 18 Nθ = 24 Nθ= 36 Nθ= 72
(a)
(b)
(c)
Fig. 6. Manufactured sample presented in Fig.2. Reconstructions using sinograms with 12,
18, 24, 36, 72 projections and the BFP (a), SART (b) and OSEM (c) methods. Same scale has been used for all cross sections.
For each reconstruction method, the evolution of the SSIM parameter is also represented as a function of the projection number Nθ in Fig.7. Independently from each others, the curves illustrate the reconstruction quality losses depending on the number of projections. As previ-ously noticed in Table1, we can remark that the SART and OSEM algorithms compute almost without quality loss whatever the projection number. Inversely, the BFP quality decreases if the
Nθ l c r 12 0.965 1.000 0.902 18 0.989 1.000 0.977 24 0.998 1.000 0.995 36 1.000 1.000 1.000 72 1.000 1.000 1.000 (a) Nθ l c r 12 1.000 0.999 0.973 18 1.000 1.000 0.986 24 0.999 1.000 0.992 36 0.991 1.000 0.994 72 1.000 1.000 1.000 (b) Nθ l c r 12 0.999 0.999 0.996 18 0.999 1.000 0.999 24 1.000 1.000 0.999 36 1.000 0.999 1.000 72 1.000 1.000 1.000 (c)
Table 1. Details of the SSIM parameter for BFP (a), SART (b) and OSEM (c). l(I, It):
inten-sity, c(I, It): contrast, r(I, It): geometric equivalence rates. Red color indicates significant
results.
projection number is less than 25. This observation is essential in case of THz CT since the projection number is limited owing to the long acquisition time. Here, we clearly point out that, for a limited number of projection data (typically less than 20), SART and OSEM methods are more appropriated for efficient THz CT.
0.86 0.88 0.9 0.92 0.94 0.96 0.98 1 20 30 40 50 60 70 SSIM number of projections (Nθ) BFP SART OSEM
Fig. 7. Manufactured sample presented in Fig.2. SSIM parameter as a function of the
projection number and the reconstruction method.
5. 3D reconstructions
More realistic samples have been investigated in order to test the ability of the THz CT scanner and the choice of the reconstruction method to properly reconstruct the complete 3D struc-ture of complex objects. Possible applications are non-destructive inspection of manufacstruc-tured objects, visualization and analysis on internal structures of objects with a non-invasive and non-destructive imaging technique. Such an application should be particularly interesting in anthropology and archeology where the use of ionizing X-ray CT is not recommended owing to the fragility and uniqueness of the samples.
The first 3D sample, presented in Fig.8(a), is a white foam parallelepiped (30 mm cube size,
α = 0.1 cm−1, refractive index 1.15) drilled by two oblique metallic bars (6 mm diameter). The experimental data obtained with the 240 GHz source correspond to 2D transmission im-ages with a 1 mm step size both in the horizontal and vertical directions. The tomography is
(a) (b)
(c) (d)
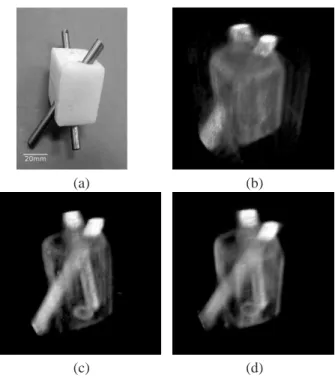
Fig. 8. White foam parallelepiped (30 mm cube size) drilled by two oblique metallic bars (6 mm diameter). (a) Photograph of the 3D sample. (b) BFP reconstruction (Media 1). (c) SART reconstruction (Media 2). (d) OSEM reconstruction (Media 3). Acquisition with the 240 GHz source.
achieved with a set of 18 projections (rotation angle step dθ= 10◦) representing an acquisition time of nearly 9 hours. Fig.8represents the THz 3D video recordings of the sample volume re-construction obtained by BFP (Fig.8(b)), SART (Fig.8(c)) and OSEM (Fig.8(d)), respectively. The videos correspond to a full 360◦rotation of the sample. As revealed in the previous section, since the BFP reconstruction suffers by the lack of projection data, the background surrounding the sample is not uniform with multiple artifacts even if the contours of the parallelepiped and the presence of the two oblique bars are precise. With the SART method, the background is more uniform even if some high intensity spots are still visible as artifacts. Contour quality is similar to BFP. Finally, as explained in the previous section, OSEM reconstruction is excellent even if the number of projection is limited but the method provides a final image which is more blurred with respect to the final image quality.
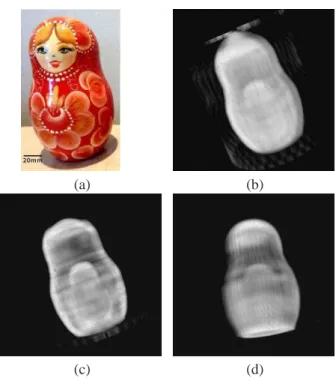
The last sample is a wooden Russian doll Matriochka (total height 160 mm, Fig.9(a)). The THz 3D video recordings of the sample volume reconstruction (Fig.9(b) for BFP (Media 4), Fig.9(c) for SART (Media 5), Fig.9(d) for OSEM (Media 6)) clearly reveal the shape of the outer doll and the presence of the smaller doll inside the main doll (measured size 95 mm). This last example of 3D reconstructions of complex objects emphasize the potential of the SART method which provides high quality contour and reasonable artifacts despite the insufficient number of projections.
6. Conclusion
With a millimeter wave source associated with an infrared temperature sensor, we investi-gated the reconstruction methods applied to THz CT. The system is easy-to-align, low-cost and
(a) (b)
(c) (d)
Fig. 9. Wooden Russian doll Matriochka (total height 160 mm). (a) Photograph of the 3D sample. (b) BFP reconstruction (Media 4). (c) SART reconstruction (Media 5). (d) OSEM reconstruction (Media 6). Acquisition with the 110 GHz source.
portable which represents a major advantage compared to standard time-domain spectroscopic imaging. After comparing with the commonly used BFP reconstruction algorithm, we pointed out the ability of the SART and OSEM algorithms to properly reconstruct cross-sectional im-ages. The SART method applied to THz CT obtains equivalent accuracy and quality than BFP. However, for a limited number of projections (less than 25), we noticed a quantitative degra-dation of the BFP reconstruction whereas SART and OSEM methods can already offer an op-timized reconstruction quality. Consequently, iterative methods allow to reduce the acquisition time (i.e. the projection number) without noticeable quality and accuracy losses. These quanti-tative results, well-known in standard tomography such as X-Ray CT, are here pointed out for THz CT imaging, which provides a new insight for the improvement of 3D THz imaging.