HAL Id: hal-02932025
https://hal.archives-ouvertes.fr/hal-02932025
Submitted on 7 Sep 2020
HAL is a multi-disciplinary open access
archive for the deposit and dissemination of
sci-entific research documents, whether they are
pub-lished or not. The documents may come from
teaching and research institutions in France or
abroad, or from public or private research centers.
L’archive ouverte pluridisciplinaire HAL, est
destinée au dépôt et à la diffusion de documents
scientifiques de niveau recherche, publiés ou non,
émanant des établissements d’enseignement et de
recherche français ou étrangers, des laboratoires
publics ou privés.
helix obliquity
Aurélie Jullien, Maxim Neradovskiy, Michel Mitov
To cite this version:
Aurélie Jullien, Maxim Neradovskiy, Michel Mitov.
Hyperspectral topography of the twisted,
cholesteric patterns of an insect cuticle under various conditions of helix obliquity. APL
Photon-ics, AIP Publishing LLC, 2020, 5 (9), pp.096102. �10.1063/5.0019039�. �hal-02932025�
Hyperspectral topography of the twisted,
cholesteric patterns of an insect cuticle under
various conditions of helix obliquity
Cite as: APL Photon. 5, 096102 (2020);doi: 10.1063/5.0019039
Submitted: 19 June 2020 • Accepted: 23 August 2020 • Published Online: 4 September 2020
Aurélie Jullien,1,a) Maxim Neradovskiy,1 and Michel Mitov2,a)
AFFILIATIONS
1Institut de Physique de Nice, Université Côte d’Azur, CNRS, UMR 7010, Valbonne, France
2Centre d’Elaboration de Matériaux et d’Etudes Structurales, CEMES, CNRS, UPR 8011, Université de Toulouse, Toulouse, France a)Authors to whom correspondence should be addressed:aurelie.jullien@inphyni.cnrs.frandmichel.mitov@cemes.fr
ABSTRACT
Twisted cholesteric liquid crystal patterns are found in the iridescent chitin-containing cuticles of many insects. They may exhibit spatial variation in the helical pitch and in the orientation of the helix axis, as in the two-band, green and silver cuticle of the scarab beetle,Chrysina gloriosa, which is the focus of the present study. The silver bands are pattern-free, whereas the green bands exhibit an array of microcells. By hyperspectral microscopy with 6 nm spectral resolution in the range of 400 nm–1000 nm, we investigated the topography of twisted cuticular structures under various orientations of the helical axis, from an orientation close to the normal to the cuticle surface in the silver bands to a spatially varying orientation in the microcells. We deal with two aspects of the topography: the shape of the surface at the interface between the transparent wax layer and the chitin-protein matrix, which is a challenging task since the cuticle is covered by the wax layer preventing direct topographic measurements by standard techniques, and the features of the deep layers in the cuticle, by addressing the distribution of the helical pitch of the twisted structure at a variable depth. We demonstrate that both types of topographic information are embedded in the hyperspectral data. Specifically, we show that the spatial distribution of the spectral center of mass portrays the geometrical shape of the hexagonal microcells. Furthermore, we evidence the spectral signature of the structural patterns located at the edges of the microcells.
© 2020 Author(s). All article content, except where otherwise noted, is licensed under a Creative Commons Attribution (CC BY) license (http://creativecommons.org/licenses/by/4.0/).https://doi.org/10.1063/5.0019039., s
I. INTRODUCTION
A. Tessellated cuticles in biology, biophysics, and optics
Insect cuticles have been pivotal to the successful adaptation of these organisms to the external environment.1Many insects, such as butterflies2,3and scarab beetles,4–6and a few fruits7,8exhibit a tes-sellated (patterned) wing or cuticle with bumps, pits, pixels, bands, spots, or patches with a diversity of iridescent colors.9
Both the exocuticle and the endocuticle of the insects may be affected by the twisted, cholesteric liquid crystal (CLC) structure of pseudolayers of chitin macromolecules into a hierarchical organi-zation [Fig. 1(a)],10which causes spatial variation in the index of refraction and is the origin of Bragg reflections leading to iridescent colors. The term pseudolayers is used instead of layers because the
CLC structure is not a layered system. The CLC structure is often drawn as a stack of layers with an orientational order of rod-like molecules in each plane and rotation by a constant angle of each plane with respect to its neighbors [Fig. 1(a)]. However, this repre-sentation is only a guide for the observer, and these layers have no physical basis. When the CLC structure is modeled as a layered sys-tem, each layer behaves like a uniaxial anisotropic medium with the slow axis parallel to the rod-like molecules and the fast axis perpen-dicular to them. The two axes twist regularly and without discon-tinuity from layer to layer. When light propagates through a CLC in the Bragg regime, the medium behaves like a multilayer system, producing interferential colors.
At normal incidence, the reflection wavelength λ0is directly
proportional to the helical pitchp as λ0=np, where n = (no+ne)/2
FIG. 1. (a) In the insect cuticle, chitin macromolecules form fibrils that wrap with proteins and assemble into fibers, which assemble into bundles. The bundles arrange
themselves parallel to each other and form pseudolayers. Finally, the chitin fiber-protein pseudolayers stack into a twisted plywood Bouligand structure with the pseudolayers rotated around the normal axis of the cuticle. The structure is not a discrete multilayer system since a continuous twist occurs along the axis perpendicular to the fibers, which interpenetrate from pseudolayer to pseudolayer. For this reason, the term pseudolayers is preferred over the term layers. A 360○rotation of the fiber orientation ⃗n defines the helical pitch [adapted with permission from Zhang et al., Sci. Rep. 6, 26249 (2016). Copyright 2016 Author(s), licensed under a Creative Commons Attribution 4.0 License19].
(b) Two-band iridescent cuticle of Chrysina gloriosa. (c) Green and silver bands at their interface as observed by optical microscopy (reflection mode, unpolarized light). (d) TEM images of transverse structures at the interface between green and silver bands and close to the top surface. White dots underline the stripes in the fingerprint texture. The distance between two identical stripes is related to the helical half-pitch. A pitch gradient occurs from the top to the bottom of the chitinous part of the cuticle. Stripes are curved below polygonal cells in the upper green region and progressively become straight in the rest of the structure. All the stripes related to the silver band are straight. (e) Transverse cut of the twisted plywood model showing the relationship between the half-pitch and the distance between two (bright or dark) stripes with the same contrast in the fingerprint texture [shown in (d) and inFig. 4(a)]. Adapted with permission from Weaver et al., Science 336, 1275–1280 (2012). Copyright 2012 AAAS.20
extraordinary indices of refraction, respectively, which are measured in directions perpendicular and parallel to the local uniaxial molec-ular director.11 Inside the Bragg band and for normal incidence, the reflected light is circularly polarized with a left- or right-handed sense identical to the helix sense. Only first-order Bragg reflection is possible for normal incidence. When the helical axis is tilted at an angle θ relative to the direction of the light propagation, the reflec-tion wavelength is λ0 =np cos θ = n peff, wherepeff is termed as
theeffective pitch of the twisted structure in the current article. All order reflections may occur at oblique incidence or when the helical structure is tilted.
B. The two-band cuticle of the scarab beetle, Chrysina gloriosa
Beetles from the genus Chrysina, also named jewel scarabs, show vibrant reflection colors from bright green to metallic silver-gold, indicating both selective and broadband reflection.12,13One of the most spectacular and emblematicChrysina species is Chrysina gloriosa [Fig. 1(b)], on which we focus our attention. This scarab beetle is found in southwestern North America to Central America in pine, pine-oak, and juniper forests. Its cuticle exhibits alternating green and silver bands. The green bands exhibit a cellular polyg-onal texture, as seen by optical microscopy [Fig. 1(c), left]. Each polygonal cell contains a bright yellow core with orange edges sur-rounded by a dark-green region, with a brighter green rim delimit-ing the cells. The silver bands exhibit a nonpatterned planar texture [Fig. 1(c), right]. Previous studies on the cuticle ofC. gloriosa have observed the cellular structure of concentric rings in the green bands
by transmission electron microscopy (TEM) investigations14or by
fluorescence confocal microscopy,15the polarizing properties of the cuticle by Mueller-matrix spectroscopic ellipsometry,16the existence of an array of multiwavelength micromirrors in the green bands,17 and the generation of self-healing Bessel beams from polygonal cells.18
In the following paragraph, we summarize the main infor-mation learned from nature about the structure and the optical response of both bands.
Cross-sectional TEM views of the green and silver bands show a typical cholesteric fingerprint (stripe) texture [Fig. 1(d)]. The axis of the helix lies in the plane of the image inFig. 1(d). The finger-print texture of the (unlayered) cholesteric structure appears as a network of alternating bright and dark stripes. This periodic net-work, thus, arises from periodic modulation, along the helix axis, of the orientation of the molecular director⃗n [the orientation of the elongated chitin fibers drawn inFig. 1(a)] and the refractive index. The helical axis is perpendicular to the stripes. The distance between two identical stripes is related to the half-pitch of the twisted orga-nization of chitin fibers because on a distance between two identical lines, a 180○rotation of the molecular director occurs, and not a 360○ full rotation, which is related to a full pitch. Owing to the head-tail symmetry of the building blocks [the cylinders inFig. 1(a)], the peri-odicity of the fingerprint texture is related to the half-pitch because the cholesteric structure looks the same physically and has the same dielectric properties after a 180○rotation [Fig. 1(e)]. In the green bands, the cuticle displays curved stripes in the upper part of the exo-cuticle. These curved stripes correspond to regions with an oblique orientation of the helical axis relative to the surface. The stripes are
parallel in the endocuticle, which is the lowest part of the chitin-made matrix of the cuticle. In the silver bands, the stripes are parallel over the whole thickness of the cuticle, and the helical axis is thus kept constant. For both bands, a pitch gradient occurs from the top of the exocuticule to the bottom of the endocuticle—typically from ∼280 nm to 900 nm (see Sec.III A). The silver band plays the role of a flat metallic reflector operating over the visible spectrum and into the infrared spectrum.17
C. Motivation of the research
Investigations of the optical properties of insect cuticles bene-fit from advanced nondestructive methods to increase the statistics of acquisition and data. The reliability of the results benefits from multiple analyses of a common pool of samples. As an illustration, the generation of self-healing Bessel beams from polygonal cells that belong to the green band was recently demonstrated by using geo-metric phase microscopy.18Another approach consists of
combin-ing spectrophotometry and microscopy in a scombin-ingle-view evaluation. Hyperspectral imaging (HSI) is a major choice in this objective. It identifies the spectral signature of components, textures, or mul-tilayer organization in a wide variety of media and distinguishes the individual spectral responses from the collective response.21,22 Hyperspectral imaging is widely used for the study of living mat-ter, especially for the monitoring of plants intended for food, such as wheat kernels,23lettuce,24and fruits.25Animal tissues have also
benefited from this technique, with, for example, the study of cuttle-fish camouflage26or the search for nanoparticles inex vivo porcine skin.27
In the field of synthetic CLCs, we have shown that hyperspec-tral imaging is a powerful tool to identify, quantify, and compare the spectral signature of chiral patterns at the surface and in the bulk of samples.28 The optical texture of polygons in the green bands of C. gloriosa looks like very similar to the polygonal tex-ture found in cholesteric oligomer films.29In a recent paper,30we have used the hyperspectral imaging technique to lead a dual inves-tigation of the optical response of artificial and biological materi-als. It has revealed major differences such as opposite distributions of the spectral center of mass. Here, we aim to conduct a funda-mental study focused on the spatio-spectral reflectivity of the C. gloriosa two-band cuticle by combining hyperspectral imaging and TEM. Our choice of C. gloriosa is motivated by the presence, in a single and unique layer, of extreme cases of obliquity because of the orientation of the helical axis of the twisted organization of chitin macromolecules: the obliquity ranges from an orientation close to the normal to the cuticle surface in the silver bands to a spatially varying obliquity in the microcells that make up the green bands.
The manuscript is organized as follows. First, we give a gen-eral framework to the study with a qualitative analysis (hyperspectral datacubes) and a quantitative analysis (reflectivity and spectral cen-ter of mass) of green and silver bands. Then, we connect the struc-tural information given by the TEM imaging of a cross section of a green band to its hyperspectral signature. For this description, we choose two specific regions of the cuticle—at the apex of a polygonal cell and in between two polygonal cells—which correspond to oppo-site curvatures in the twisted structure. Finally, with the unique help of the non-destructive hyperspectral imaging technique, the study
leads us to the topography of a set of microcells in the green band. We deal with two aspects of the topography:
● the shape of the surface at the interface between the trans-parent wax layer and the chitin-protein matrix; this is a chal-lenging task since the cuticle is covered by the wax layer preventing direct topographic measurements by standard techniques such as scanning electron microscopy (SEM) and atomic force microscopy (AFM); and
● the features of the deep layers in the cuticle, at a variable depth: we investigate the x-y distribution of the pitch of the twisted structure at different z-values; the pitch varies with the depth in two ways: (i) a pitch gradient occurs from the top of exocuticle to the bottom of the endocuticle; (ii) the orientation of the helical axis varies in specific regions of the cuticle—for this second type of variation, we will define an effective (apparent) pitch, different from the natural pitch of the twisted structure.
During this topographic study, the spectral signature of the fin-gerprint patterns following the tilted alignment of the helical axis is revealed, although these conditions are unfavorable to Bragg light reflections.
II. HYPERSPECTRAL VIEW OF THE TWO-BAND CUTICLE OF CHRYSINA GLORIOSA
In the current experiment, a hyperspectral microscope,31 described elsewhere (supplementary material, Fig. S1), is used to analyze the light reflected by the cuticle when illuminated by a nonpolarized tungsten halogen lamp. Both green and silver bands are under study. The spectral data are acquired with 6 nm span, while the lateral spatial resolution is about 300 nm (see Sec.Vand the supplementary material). The instrument output is a dataset of 13.3M points, which correspond to an image with 512 ∗ 128 pixels2, each being spectrally resolved with a 6 nm resolution over the range of 400 nm–1000 nm. To provide an overview of the type of available data and cartographies, the inset ofFig. 2 illus-trates the salient outcomes of the hyperspectral analysis to specify the type of data and maps that will be presented later. A three-dimensional graphic ofIR(x, y, λ) enables visualization of the
inter-dependence between the spatial modulation of the light reflected by the sampleIRand the gradual spectral changes. The hyperspectral
cube, then, features the average reflectivity on the top (as a func-tion of x and y) and the spatially resolved spectral reflectivity in lateral maps. From there, several datasets might be extracted and presented. Each pixel is spectrally resolved [IR(x0,y0, λ)]. For each
pixel, the spectral center of mass, or spectral barycenter, can be cal-culated as λC = ∫ λI∫ IR(x0,y0,λ)dλ
R(x0,y0,λ)dλ. Different cross sections of the cube
provideIR(x, y, λ0), monochromatic views of the sample (λ0varies
from 400 nm to 1000 nm with 6 nm increments), and cartogra-phies of the spectral distribution as a function ofx [IR(x, y0, λ)] or
y [IR(x0,y, λ)].
Figure 2presents a qualitative view of the hyperspectral analy-sis for the silver and green bands by means of selected monochro-matic pictures and two hyperspectral datacubes. Monochromonochro-matic views underline the different structural patterns of the two bands. The green band exhibits reflective hexagonal cells that are regular
FIG. 2. Inset: Example of a hyperspectral datacube, which illustrates the spatio-spectral properties of the sample with two spatial dimensions (x and y) and one spectral
dimension (λ). Illustration of the data extracted from the cube. IRis the reflected intensity. One can obtain access to the spectrally resolved intensity reflected by each pixel
IR(x0, y0,λ), where x0and y0are the coordinates of a given pixel. This is represented by the charcoal line.λc(x0, y0) is the spectral center of mass calculated for that pixel.
Cube cross sections along x, y, andλ provide spatio-spectral maps IR(x, y0,λ) and IR(x0, y,λ) and monochromatic views IR(x, y,λ0) of the samples. (a) A selection of
monochromatic images of the green and silver bands of the cuticle. Each image is normalized (white: 0 and dark: 1). Hyperspectral datacubes of the (b) green and (c) silver bands. Two different sets of color bars are associated with each cube. The black-to-yellow color bar indicates the overall reflected intensity (i.e., not spectrally resolved), as plotted on the top of the cube (Y vs X). The second color bar (black-to-red) indicates the reflected spectral intensity, as plotted on the cube sides (wavelength vs X, wavelength vs Y).
in shape and size (∼5 μm) and visible as such for all wavelengths inFig. 2(a). The center of the polygon is the brightest part of the cell for wavelengths of up to λ≈ 900 nm. Above 900 nm, the reflec-tivity decreases from the center to the surrounding parts, while the valleys, i.e., the gap between two adjacent polygons, are brighter. Meanwhile, the silver band reveals no particular spatial pattern, only some variations in the reflectivity, which are reproducible for all wavelengths.
A square picture of the samples (15 × 15 μm2) is, then, selected to plot the hyperspectral cube. For both bands, the light is reflected over the full incident spectral range (400 nm–1000 nm). This is the consequence of the pitch gradient of the twisted structure from the visible to the infrared spectrum,17 with obvi-ously different spatial distributions of patterns and intensity, as revealed in Fig. 2(b). The complex chromaticity of microcells is illustrated, with a dominant contribution of the hexagon centers. In contrast, the silver band presents a homogeneous, although modulated, spectral response [Fig. 2(c)] as a consequence of the
nontextured nature of silver bands, which act as specular broadband mirrors.17
Before switching to a detailed analysis of the patterned green band, we focus on the analysis of the silver band, whose response is expected to be less complex since this band is not tessellated. As reported in the Introduction, the reflected central wavelength is linearly dependent on the effective pitch of the cholesteric organi-zation. In the silver band, the effective pitch may be assimilated to the natural pitch because the orientation of the helix axis is con-stant in space and remains perpendicular to the band [Fig. 1(d)]. The spatial dependence of the spectral center of mass, integrated over the full spectral range, enables us to picture the absence of pitch variations at the surface of the silver band [Fig. 3(a)], with only minor (the center of mass ranges from 680 nm to 705 nm) and random fluctuations. These fluctuations can originate from local variations in reflectivity or spectral inhomogeneity. To dis-criminate their respective influence, these two quantities are plotted inFigs. 3(b)and3(c). They-dependence of reflectivity, integrated
FIG. 3. Hyperspectral analysis of the silver band: (a) Spectral center of mass (black
to white scale), integrated over the full spectral range, as a function of x and y. The movie displaying the variation of center of mass with the cursor of the cross section can be found insupplementary materials(Movie S.1). The dotted red line shows the location of the cross section whose analysis is presented in (b) and (c). (b) Distribution of the reflectivity integrated over the full spectrum, from 400 nm to 1000 nm, following the cross section as defined in (a). (c) Analysis of the wavelength-dependent reflectivity. Top: Spectral oscillation period as a function of the central wavelength. The clouds indicate the data dispersion (±5 nm). Bottom: The density plot of the 191 normalized reflected spectra following the cross section as defined in (a). The regions with a lower dispersion of spectra correspond to a higher reproducibility.
over the full spectrum shows a smooth increase which could be attributed to impurities (proper to the biological structure in itself or to the sample) or minor and local variations of the orientation of the cholesteric pseudolayers leading to a slight off-axis reflection. Furthermore, the analysis of normalized spectra [Fig. 3(c)] reveals a reproducible and homogeneous behavior: the reflectivity (bot-tom) is nearly flat over the considered spectrum, with wavelength-dependent spectral oscillations (top). Oscillations, or ripples mod-ulating the reflection spectrum, can be attributed to longitudinal interferences consecutive to the existence of a singular region named theemergence line between the exo- and endocuticles (i.e., a trough in the periodicity variation), as observed by SEM and discussed in Ref.17. The presence of a ripple structure superimposed onto a broadband plateau is also present in the spectrum of the cuti-cle of theChrysina aurigans beetle.32,33This set of results confirms that the silver band is essentially a biological broadband chirped reflector.
III. HYPERSPECTRAL TOPOGRAPHY OF THE IRIDESCENT MICROCELLS AND ITS RELATIONSHIP WITH THE COMPLEX TWISTED STRUCTURE
A. Transmission electron imaging of the internal twist TEM investigation of cross sections of the cuticle reveals the concave shape of each polygonal cell and illustrates the typical cholesteric fingerprint texture, with alternating dark and bright lines [Fig. 4(a)]. The half-pitch of the stripe texture is plotted as a function of thez-depth in the cuticle thickness for a couple of elementary
FIG. 4. Submicrometer-scale investigations of the twisted structure in the green
part of the cuticle. (a) TEM transverse view, from the top of the cuticle to the epidermis. Bar scale = 2μm. (b) Half-pitch of the twisted structure as a
func-tion of the depth in the cuticle thickness as deduced from the image in (a) (see Sec.V). A couple of elementary regions ascribed to the valley between two con-secutive polygonal cells—convex part—as shown inFig. 1(c)(bright green rim), and the apex of a polygonal cell—concave part—are considered. The error bars correspond to the dispersion range. The areas in orange and blue, ascribed to the concave and convex parts, mark the positions of the wax layer and of the frontier between the exocuticle and the endocuticle. The dashed lines are polyno-mial fits of the data. The reflected central wavelength depends on the pitch. p(z) thus provides an estimation of the dependence of the wavelength on the depth inside the Bragg grating of the cuticle. Each edge of the spectral detection range (400 nm–1000 nm) of the hyperspectral microscope is then related to a z-value, as indicated by the hatched area. Three spatial zones of interest are defined (I, II, and III; see the text). (c) Illustration of the spectral interval transcription of the three identified spatial zones, calculated following the reflected wavelength dependence on z.
regions, which are of considerable interest for the present analy-sis: the valley between two adjacent hexagons (convex part) and the central part (concave part) [Fig. 4(b)]. One can note that the two curves are originally slightlyz-shifted because of differences in the geometrical curvature of cholesteric pseudolayers. However, the half-pitch dependence withz presents an overall similar trend for both regions. Three regions for the half-pitch dependence may be distinguished: (I) an initial graded increase in the half-pitch between 100 nm and 280 nm, (II) a plateau up to the frontier between the exocuticle and endocuticle, and (III) a second graded increase in the half-pitch, linearly up to 750 nm for the concave part and up to 500 nm for the convex part. In the exocuticle, the half-pitch ascribed to the valley is slightly longer than that ascribed to the apex of the polygon. In Fig. 4(b), the z-location of the frontier between the exocuticle and the endocuticle is shifted as a conse-quence of the difference in concavities of the two regions. Beyond the frontier, the two curves cross each other, and the half-pitch ascribed to the apex of the polygon becomes longer. This qualita-tive description, thus, enables us to ascribe three spatial zones, to which we will refer to below: (I) pitch increase n○1, (II) plateau, by including the exocuticle-endocuticle frontier, and (III) pitch increase n○2.
In the Bragg regime, the reflected central wavelength depends on the half-pitch, as mentioned in introductory Sec.I A, following λ0=np, where n = 1.63.34The measurement ofp(z), thus, provides
an estimation of λ0(z), i.e., the dependence of the reflected
wave-length on the penetration depth inside the cuticle. This provides us with two pieces of information. The first one is related to the detection range (400 nm–1000 nm) of the instrument: each spec-tral edge is related to a penetration depth. As shown inFig. 4(b), the hyperspectral imaging system, thus, analyzes the light reflected in a thickness of the cuticle ranging from 1 μm to 13 μm. The detec-tion range is marked as the hatched area inFig. 4(b). The analyzed light is reflected by the cholesteric pseudolayers for both concave
and convex parts. One has to note that the analyzed cuticle depth is somehow larger than the estimated microscope depth of field (a few
μm). However, the experimental z-scan of the sample has not
evi-denced any significant change in the forthcoming measured spectral distributions. The second information is the spectral transcription of the three identified spatial zones, each of which corresponding to a specific spectral interval, as reported inFig. 4(c). Salient spatio-chromatic features due to the nested helical arcs are then expected, as a spectral signature of the structural complexity of the twisted organization of chiral microcells.
B. Single-view hyperspectral analysis of a set of hexagonal cells
1. Spatio-spectral maps
A cluster of nine adjacent hexagonal cells is under study.
Figure 5(a)shows the raw image of this set, as acquired by the hyper-spectral microscope but not hyper-spectrally resolved. Two cross sections are indicated, which intercept (i) the center of the hexagons and (ii) the edges of the hexagons. Each cross section intercepts a few val-leys. On the basis of these cross sections,Figs. 5(b)and5(c)display the spatio-spectral maps (see the inset ofFig. 2for their significance) extracted from the hyperspectral cube, as shown inFig. 2(b). These maps reveal the selective reflection properties of the green band by distinguishing the contributions of the different parts of the array of microcells.
Cross section (i) [Fig. 5(b)] shows that between 400 nm and 750 nm (zones I and II), the reflection mainly originates from the concave part, i.e., the hexagon center. The intensity ratio between the hexagon centers and the valleys is greater than three. A clear difference between the contributions of concave and convex parts is established for this part of the spectrum. This behavior might be explained by the axicon shape of the outer layers of the exocuticle, as proposed in Ref.18. Between 750 nm and 900 nm (zone III),
FIG. 5. (a) Optical micrograph (i.e., not
spectrally resolved; unpolarized incident light) of a cluster of nine hexagons. The dotted lines indicate two different cross sections, which intercept (i) the center of the hexagons and (ii) the edges of the hexagons. Each cross section inter-cepts a few valleys. [(b) and (c)] Spatio-spectral maps (y vsλ, seeFig. 2) related to the cross sections, as indicated in (a): (i) in (b) and (ii) in (c). A movie displaying the spatio-spectral map changes with the cursor of the cross section can be found insupplementary materials(Movie S.2). (d) Cross section from (b) (see the blue dotted line): intensity as a function of y forλ = 650 nm. Imaxand Iminare used
for the visibility factor calculation (see the text).
the spatial reflectivity gains uniformity, and the contributions of concave and convex parts are balanced. Finally, reflectivity in the infrared spectrum, above 900 nm, reveals another spatial pattern underneath the concave part ascribed to the hexagons. This pat-tern may be attributed to constructive and destructive interferences. Indeed, as known from the previously established dependence of the reflected wavelengths on the depth (Fig. 4), reflectivity above 900 nm corresponds to a depth of∼12 μm (beginning of zone III). At this cuticle depth, as shown inFig. 4, the geometric curvature is greatly reduced, and the pitches are in similar ranges in the endo-cuticle regardless of whether the measurements are made at the vertical location of convex or concave regions that belong to the upper part of the exocuticle. Thus, the same wavelength can be reflected in the same direction by some pseudolayers presenting a small position offset (Δz). A simple calculation shows that the phase shift (φ= 2π
λnΔz) accumulated in the structure at a wavelength of 950 nm is π (phase mismatch) for Δz = 300 μm and 2π (phase-match) for Δz = 600 μm. The conditions are, therefore, met to induce constructive and destructive interferences in this region of the exocuticle.
Cross section (ii) [Fig. 5(c)] shows, on the contrary, a more homogeneous spatial distribution of the reflectivity, with fewer spatio-spectral structures. We note a low reflectivity in the visible region of the spectrum. Between 800 nm and 1000 nm, the reflectiv-ity gradually increases with an almost twofold higher contribution of the valleys. Movie S2 (supplementary material) dynamically shows the motion of the cross section cursor and the related modifications on the spatio-spectral map, providing insight into the progressive modification of the spectral response of the different parts of the array of hexagons.
A periodic pattern is seen inFig. 5(d), which displays the y-distribution of the intensity at 650 nm along the blue dotted line in
Fig. 5(b). This pattern consists of a peak of high intensity, which is related to the location of a valley [bright green rims inFig. 1(c)]; the pattern repeats three times because three valleys are intercepted, followed by a double (or even triple) peak of lowest intensity. These latter intensity oscillations are intriguing and will be related to the spatio-spectral fingerprint pattern observed at the surroundings of valleys.
HSI analysis has then revealed different contributions from the identified cuticle zones of interest. For the visible part of the spec-trum, i.e., zones I and II, the reflected light is concentrated by the concave parts of the outer layers of the exo-cuticle, while zone III is characterized by a dominant contribution of the convex part and interference patterns underneath the concave parts.
2. Hyperspectral topography
Figure 6(a)represents the spatial distribution of the spectral center of mass (λc) for the nine hexagons under study. As a first
out-put of the figure, the spectral center of mass perfectly portrays the geometrical shape of the hexagons, as primarily seen in the optical micrograph ofFig. 5(a). However, unlike the raw image, a finger-print pattern at the interface between two adjacent hexagons, at the junction of valleys delimiting the gaps between cells [bright green rims inFig. 1(c)], is visible. This observation will be described in Sec.III B 2.
Another remarkable feature originates from the following observation: Plotting the spatial dependence of the center of mass, integrated over the full spectral range, enables visualization of the surface relief of the texture. The nondestructive, single-view,
FIG. 6. (a) Spectral center of mass
λc (black to white scale), integrated
over the full spectral range, as a func-tion of x and y. (b) Effective pitch peff
(blue to red scale and z scale) as a function of x and y. peff is defined
as λc = n peff, with n = 1.63 (value
of the average refractive index),34 and
λc is the spectral center of mass
dis-played in (a). (c) Visibility factor of the spatial pattern identified in Fig. 6(b)
(Vp(λ) =Imax(λ)−Imin(λ)
Imax(λ)+Imin(λ)) as a
func-tion of the wavelength, Imax and Imin
being defined inFig. 6(d). (d) Blue: nor-malized standard deviation of the effec-tive pitch for different spectral ranges of 400 nm–500 nm, 500 nm–600 nm, 600 nm–700 nm, 700 nm–800 nm, and 800 nm–900 nm from the map data in
Fig. 6(b). Orange: estimated variation of the helical axisθ, calculated after the
effective pitch deviation. The clouds indi-cate the data dispersion. Zones I, II, and III are defined inFig. 4.
hyperspectral acquisition then provides topographic information about the sample. Indeed, a change in the reflected central wave-length is related to a variation in the effective pitch peff of the
cholesteric organization. This is even clearer from the 3D view of the spatial pattern of the effective pitch [calculated assuming an average refractive index of n = 1.63,Fig. 6(b)], picturing the axicon-like shape of the microcells. From the center of the microcell to the surrounding valleys, the center of mass is red-shifted [Fig. 6(a)], which corresponds to the increase in the effective pitch [Fig. 6(b)], in relation with the concave curvature of the outer layers of the cuticle. This was investigated in a previous study, in the context of biomimicry.30
Here, we focus on another topographical feature revealed by HSI, which is the study of the effective pitch at the surface of differ-ent virtual cuts in the cuticle thickness. The concave-convex pattern seen here is not only geometric. Indeed, the spectral barycenter mea-sured over the whole spectrum is related to the integral over the whole thicknessd (of the chitinous part of the cuticle) of the pitch p and the angle θ between the helical axis and the z-axis (i.e., the obliquity), λC(x, y) = n ∫ d 0 peff(x, y, z)dz = n ∫ d 0 p(z)cos θ(x, y, z)dz, (1)
wherep(z) accounts for the natural pitch gradient, while θ(x, y, z) is related to the local tilt of the helical axis. As known from the TEM investigations (Fig. 4),∫0dp(z)dz is nearly the same for con-cave and convex areas. The pattern relief observed inFig. 6(b), thus, mainly originates from the spatial variation in θ(x, y, z). It should be noted that the topographic information available fromFig. 6(b)still integrates the geometrical variation (relief) and the internal pitch distribution (exocuticle and endocuticle). We aim at demonstrat-ing that the spectral signatures of these different contributions are embedded in some specific outputs of the hyperspectral data.
To that purpose,Fig. 6(c)analyzes the spatio-spectral distribu-tion presented inFig. 5(b)and displays the visibility factor of the signal reflected by the polygon centers for different wavelengths, analyzed over a spatial dimension (y). The visibility factor [Vp(λ)],
in contrast, quantifies the sharpness of the spatial pattern shown in
Figs. 5(b)and5(d), Vp(λ) =
Imax(λ, y) − Imin(λ, y)
Imax(λ, y) + Imin(λ, y), (2)
where Imax is the maximum intensity of the signal as a function
of y for a given wavelength and Imin is the minimum intensity
[Fig. 5(d)]. Qualitatively, a low visibility is associated with a homoge-neous reflection along the analyzed spatial dimension, while a high visibility corresponds to light concentration by the central part of the microcell, and thus, to the pseudo-layers’ curvature. Several con-clusions can be drawn fromFig. 6(c). At first, the visibility is high (above 0.5) for 400 nm < λ < 750 nm, meaning that the light is mainly reflected by the center because of the pseudolayer curva-ture, which confirms the spatially changing orientation of the helical axis and off-axis light reflection. Second, the maximum visibility, at∼650 nm, corresponds to the weakly changing pitch underneath the concave part [“plateau” II inFig. 4(b)]. The number of pseu-dolayers of equal period is higher, enabling better phase matching of the reflected wave for this wavelength. Finally, the sudden decrease in visibility above 800 nm can be attributed to the fading in the
curvature of the pseudolayers. It corresponds to a half-pitch of ∼290 nm, which occurs at a depth of ∼12 μm.
Finally, a way to visualize the progressive attenuation of the local curvature is to divide the wavelength bandgap into five adja-cent 100-nm-thick bands. The spectral adja-center of mass and the effective pitch are calculated for each band. To account for the graded pitch, the standard deviation ofpeff(σpeff) is normalized with
respect to the mean value (⟨peff⟩) and is plotted inFig. 6(d)for
the five bands. Over one spectral band, the pitch is assumed to be nearly constant. Thus, a larger change in σpeff/⟨peff⟩ is attributed
to a larger change in the helical axis tilt θ. Following Eq.(1), the effective pitch deviation enables us to estimate Δθ, the local vari-ation of the local tilt, for the considered different slices of cles. Furthermore, each spectral band can be connected to a cuti-cle depth based on data from Fig. 4(b). Thus, flattening of the “multilayer” structure with respect to z can be achieved. The fact that the deviation increases slightly above 800 nm is attributed to the interference pattern already observed in the infrared spectral range.
3. Specific spectral fingerprint pattern
A spectral fingerprint pattern with the submicrometer-scale periodicity is visible at the surroundings of the valleys, as seen in the infrared monochromatic images [Fig. 7(a)]. The periodicity is close to 950 nm [Fig. 7(b)]. It is nearly constant with the selected wavelength [Fig. 7(c)], tending to rule out the diffraction effect. This pattern is analyzed as the spectral signature of the local periodic-ity of the twisted structure with an orientation of the helical axis that is strongly tilted. Curved lines in the valleys of the polygo-nal texture are attributed to the synthetic cholesteric oligomers, as observed using SEM.29Polygonal textures, consisting of a mosaic of polygons of various sizes, can be observed in flat cholesteric films when the helical axis is strongly tilted with respect to the surfaces of the films. This situation is promoted in an open film via hybrid anchoring of molecules, which preferentially align tangentially to the substrate on which the cholesteric material is coated and perpen-dicular to the air interface. Atomic force microscopy (AFM) images reveal the cone shape of the polygons, which are the locus of curved lines and double-spiral patterns in the fingerprint texture. The relief of the conical polygons (their height is in the 20 nm–100 nm range29) results from the competition between the surface energy and the bulk free energy. The surface tension minimizes the surface area by rearranging the fluid interface from a planar state to a polygo-nal field.35The energy is decreased by transforming the free surface into a cone, thus reducing the bulk distortion energy at the expense of the surface energy. The curved lines and the double-spiral pat-terns correspond to the adaptation of the cholesteric structure to the relief and anchoring conditions at the limits. Close to air, the twisted structure cannot readily adapt to the anchoring conditions. One solution to this boundary problem is to create a series of alternating disclination lines at the surface.36
However, the fingerprint texture reported in the above-mentioned literature about oblique cholesteric structures corre-sponds to spatial patterns, as visualized by different direct imag-ing techniques. To our knowledge, the existence of similar curved lines in the polygonal texture of insects,C. gloriosa or other jewel scarabs, has not been reported for two reasons: (i) chitin-made cuti-cle insects are often covered with wax; this is the case forC. gloriosa,
FIG. 7. (a) Monochromatic optical micrograph of nine adjacent hexagons in the green band for λ0= 943 nm (unpolarized incident light). (b) Spatial modulation of the reflected
intensity for the three regions of interest indicated in (a).Λ figures the periodicity of the pattern. (c) Dependence of Λ with the incident wavelength. The clouds indicate the data dispersion.
TABLE I. Hyperspectral topography of the green band: summary of experimental findings. The measured quantities (data)
are defined inFig. 2(inset).
Method Data Topographic results
TEM p(z) Identification of three different spatial zones (I, II, and III) in the cuticle deepness, each of them being related to a reflected spectral interval (Fig. 4).
HSI λc(x, y) The calculation of the integrated center of mass evidences the
structural curvature of the cholesteric pseudo-layers [Fig. 6(a)]. Furthermore, integrated effective pitch variation pictures the axicon shape of the polygons, in good agreement with the TEM [Fig. 6(b)]. HSI IR(x0,y, λ) The spatio-spectral maps identify different contributions from the
zone III, with respect to the zones I and II. They suggest a variation of the pseudo-layers curvature in the depth of the cuticle [Fig. 5(b)]. The visibility of the spatio-spectral pattern evidenced above enables to discriminate the optical answer of the three zones and shows a sudden fading of the curvature [Fig. 6(c)]. The deviation of the effective pitch provides an estimation of the flattening of the multi-layer structure [Fig. 6(d)]. HSI IR(x, y, λ0) Evidence of the spectral fingerprint pattern (Fig. 7).
whose wax layer exhibits a transverse stripe texture (with the peri-odicity at the nanoscale, ∼28 nm),37 and by acting as a screen, this coating cannot allow direct visualization in the native state of the cuticle of textures with imaging techniques such as SEM or AFM; (ii) the wax layer could be removed with an appropriate solvent to allow direct imaging, but this solution is not described in the literature. The nondestructive hyperspectral imaging tech-nique, thus, provides the spectral signature of structural patterns, whose spectral signature was also not reported in textures of syn-thetic oblique CLCs. This result may appear intriguing since the fingerprint texture corresponds to a helical axis lying in the plane of the optical film, whose configuration does not promote Bragg reflections or the detection of a Bragg band using current spec-trophotometry methods. The field of view of our hyperspectral
instrument, up to∼60○,31may enable visualization of the fingerprint pattern.
To conclude this section,Table Isummarizes the experimen-tal findings related to the hyperspectral topography of the green band.
IV. SUMMARY AND CONCLUSIONS
Using hyperspectral imaging with a 6 nm resolution over the range of 400 nm–1000 nm, we have investigated the topography of CLC structures in the twisted patterns of an iridescent insect cuti-cle under various conditions of oblique helicity. We have chosen to study the emblematic case of the two-band cuticle of the scarab beetle,C. gloriosa. The cuticle of C. gloriosa was a prime candidate
for our investigations because it exhibits, in a single and unique biomaterial layer, extreme cases of obliquity because of the orien-tation of the helical axis of the twisted organization of chitin macro-molecules. The obliquity indeed ranges from an orientation close to the normal to the cuticle surface in the silver bands to a spa-tially varying obliquity in the microcells that make up the green bands. Originally, the spectral signature of the fingerprint patterns was revealed at the junction of rims, the regions between the micro-cells, at the submicrometer range, although these conditions of a helix lying on the surface of the material under investigation at normal incidence are unfavorable to the characterization of Bragg reflections.
Hyperspectral datacubes were provided for the green and sil-ver bands. They show the asil-verage reflectivity on the top (surface of the band) of the cube and the spatially resolved spectral reflectance in two cube sides (wavelength vs each dimension of the surface of the band). The visualization of the hyperspectral cube then inspired a detailed analysis of the patterned green band. The hyperspectral topography of nine adjacent microcells is linked to their complex twisted structure, as observed by TEM in cross-sectional views. By distinguishing the contributions of the different parts of the array of microcells, the spatio-spectral maps of cross sections are provided in three regions of interest along a line: crossing the center of three hexagons, passing through their edges, and intercepting the rims between cells. The spatial distribution of the spectral center of mass was also investigated for the nine hexagons. It perfectly portrays the geometrical shape of the hexagons. Plotting the spatial dependence of the center of mass enables visualization of the surface relief of the cuticle patterns. It mainly originates from the 3D spatial varia-tion of the tilt angle of the helix axis. The topographic informavaria-tion integrates the geometrical variations (relief) and the internal twist distribution in the exocuticle and in the endocuticle. To visualize the progressive attenuation of the local tilt of the helix axis in the cuticle depth, the wavelength bandgap is divided into six adjacent 100-nm-thick bands. The spectral center of mass and the effective pitch are calculated for each of the band.
Hyperspectral microscopy, relying on a wide field-of-view, common-path, and static setup, could advantageously be coupled to phase microscopy. The latter has recently been used to provide 3D imaging of the surface layers of the exocuticle ofC. gloriosa and to analyze the reflected beam.18Spectral resolution of the measured optical path would then provide 3D imaging of the inner layers as well.
Chiral patterns of tessellated cuticles may constitute an impor-tant source of inspiration in the field of non-specular properties such as deflection and lensing in geometric phase planar optics38–40or in modern cryptography,41,42for which complex twisted organizations are aimed at different length scales. The technical requirements for cryptography usefully include not only high spatial resolution but also high spectral resolution. The optical pattern appropriate for an individual twisted microcell, including its confinement among the neighboring cells and the characteristics of the incident light (angle and polarization), is highly specific. An array of polygons creates colorful patterns that are argued to be unique since their relative positions, sizes, and optical responses are not clonable and are hard to predict. Artificial tags inspired by the multiplicity of the spectral behavior of the twisted microcells could be used in object authentication.
V. MATERIALS AND METHODS
Biological sample. A male specimen was collected at Madera Canyon (Santa Cruz County, Arizona, USA) in July 2014.
Inclusions of samples for ultramicrotomy. The cuticle sam-ples correspond to the elytra and were removed with a razor blade. A small piece of material was embedded in EMbed-812 resin (Electron Microscopy Sciences) that was then cured at 60○C for 48 h.
Preparation of samples for TEM. A diamond knife at ambi-ent temperature was used to cut 80-nm-thick ultrathin slices with a Leica UCT ultramicrotome. The material was cut perpendicu-larly to the film surface (cross sections). Slices were retrieved on single-slot formvar-coated copper grids (GS2x1-C3, Gilder Grids Ltd.). The slice photographed inFig. 1(d)was observed in its native state. The slice photographed inFig. 4(a)was stained with Urany-Less (brand mixture of lanthanides from Delta microscopy) for 20 min and with 3% Reynolds lead citrate (from Chromalys) for 5 min.
Periodicity profiles from TEM images. The distance between two consecutive dark lines was measured from the fingerprint texture in the TEM image, as shown inFig. 4(a), and related to the half pitch of the twisted structure of the chitinous part of the cuticle. For the depth measurements, the z-axis was taken as perpendicu-lar to the stripes of the fingerprint texture along two directions that correspond to two typical regions of the cuticle: the convex part ascribed to the valley in between two consecutive polygonal cells and the concave part ascribed to a polygonal cell. The z-axis intercepts the highest (resp. lowest) part of the convex (resp. concave) part of structures. The zero-abscissa is taken at the interface between the wax and the exterior in both cases. Measurements are interrupted when the contrast in the fingerprint texture in the TEM image is too low.
Hyperspectral microscopy: optical setup and analysis. Hyper-spectral imaging provides an image of a given sample, Hyper-spectrally resolved with numerous narrow and adjacent spectral bands. In the current experiment, we make use of a previously described liquid-crystal-based reflective hyperspectral microscope, relying on Fourier spectrometry.31 The illuminating lamp source is a tung-sten halogen lamp. Köhler illumination scheme is employed. The lateral spatial resolution is fixed by the microscope (magnifica-tion 40 and numerical aperture 0.65) and is 300 nm, measured as the FWHM of the smallest imaged object of a resolution tar-get. The field of view is 16 × 64 μm2. More details about the optical setup and analysis can be found in the supplementary material.
Hyperspectral outputs. As a result, the instrument output is an image with 512∗ 128 pixels2, each of them being spectrally resolved with a 6 nm resolution over the range of 400 nm–1000 nm, which is a dataset of 13.3M points. The extracted results then include the spectral reflectivity of a given pixel or cluster of pixels, monochro-matic images of the sample (100 available between 400 nm and 1000 nm), and finally the typical hyperspectral datacube. All the spectra are normalized with respect to the lamp spectrum. Special care was given to the reproducibility and reliability of the results. Hyperspectral films were acquired and analyzed N times for each sample (with N > 20 for the green band and N > 15 for the silver band).
SUPPLEMENTARY MATERIAL
See thesupplementary materialfor a description of the hyper-spectral microscope and the acquisition and analysis process. Hyper-spectral views (movies) ofChrysina Gloriosa are also presented. ACKNOWLEDGMENTS
This work was supported by the Agence Nationale de la Recherche (France) under Grant No. ANR-17-CE30-0025. M.M. thanks Dr. E. Hanelt from Wacker Chemie GmbH (Munchen, Ger-many) for providing him with oligomers and Ms. V. Soldan (METi, CBI, CNRS, University of Toulouse) for her technical assistance with ultramicrotomy and TEM observations of the biological sample.
The authors declare no conflict of interest. DATA AVAILABILITY
The data that support the findings of this study are available from the corresponding author upon reasonable request.
REFERENCES
1
E. Cohen, “Preface” inExtracellular Composite Matrices in Arthropods, edited by E. Cohen and B. Moussian (Springer, 2016), p. V.
2P. Vukusic, J. R. Sambles, and C. R. Lawrence,Nature
404, 457 (2000).
3P. Beldade and P. M. Brakefield,Nat. Rev.
3, 442 (2002).
4A. E. Seago, P. Brady, J.-P. Vigneron, and T. D. Schultz,J. R. Soc. Interface 6, S165–S184 (2009).
5
D. G. Stavenga, B. D. Wilts, H. L. Leertouwer, and T. Hariyama,Philos. Trans. R. Soc., B366, 709–723 (2011).
6K. Yu, T. Fan, S. Lou, and D. Zhang,Prog. Mater. Sci.
58, 825–873 (2013).
7S. Vignolini, P. J. Rudall, A. V. Rowland, A. Reed, E. Moyroud, R. B. Faden, J. J.
Baumberg, B. J. Glover, and U. Steiner,Proc. Natl. Acad. Sci. U. S. A.109, 15712– 15715 (2012).
8S. Vignolini, T. Gregory, M. Kolle, A. Lethbridge, E. Moyroud, U. Steiner,
B. J. Glover, P. Vukusic, and P. J. Rudall,J. R. Soc. Interface 13, 20160645 (2016).
9J. Sun, B. Bhushan, and J. Tong,RSC Adv.
3, 14862–14889 (2013).
10T. Lenau and M. Barfoed,Adv. Eng. Mater.
10, 299–314 (2008).
11P. G. de Gennes and J. Prost, inCholesterics in the Physics of Liquid Crystals, 2nd
ed. (Oxford University Press, Oxford, 1993), Chap. 6.
12
D. H. Goldstein,Appl. Opt.45, 7944–7950 (2006).
13
W. E. Vargas, M. Hernández-Jiménez, E. Libby, D. E. Azofeifa, A. Solis, and C. Barboza-Aguilar,Europhys. Lett.111, 64001 (2015).
14A. Pace,Science
176, 678–680 (1972).
15V. Sharma, M. Crne, J. O. Park, and M. Srinivasarao,Science
325, 449–451 (2009).
16
L. Fernández del Río, H. Arwin, and K. Järrendahl,Thin Solid Films571, 410– 415 (2014).
17G. Agez, C. Bayon, and M. Mitov,Acta Biomater.
48, 357–367 (2017).
18P. Bouchal, J. Kapitán, M. Koneˇcný, M. Zbonˇcák, and Z. Bouchal,APL Photon-ics4, 126102 (2019).
19
Y. Zhang, O. Paris, N. J. Terrill, and H. S. Gupta,Sci. Rep.6, 26249 (2016).
20
J. C. Weaver, G. W. Milliron, A. Miserez, K. Evans-Lutterodt, S. Herrera, I. Gallana, W. J. Mershon, B. Swanson, P. Zavattieri, E. DiMasi, and D. Kisailus,
Science336, 1275–1280 (2012).
21
H. F. Grahn and P. Geladi, Techniques and Applications of Hyperspectral Analysis (Wiley, 2007).
22P. R. Griffiths and J. A. de Haseth,Fourier Transform Infrared Spectrometry
(Wiley, 2007).
23
C. B. Singh, D. S. Jayas, J. Paliwal, and N. D. G. White,J. Stored Prod. Res.45, 151–158 (2009).
24M. Lara, B. Diezma, L. Lleó, J. Roger, Y. Garrido, M. Gil, and M. Ruiz-Altisent, Appl. Sci.6, 412 (2016).
25
Y. Lu, Y. Huang, and R. Lu,Appl. Sci.7, 189 (2017).
26
C.-C. Chiao, J. K. Wickiser, J. J. Allen, B. Genter, and R. T. Hanlon,Proc. Natl. Acad. Sci. U. S. A.108, 9148–9153 (2011).
27M. D. P. S. Peña, A. Gottipati, S. Tahiliani, N. M. Neu-Baker, M. D. Frame, A. J.
Friedman, and S. A. Brenner,Microsc. Res. Tech.79, 349–358 (2016).
28
A. Jullien, A. Scarangella, U. Bortolozzo, S. Residori, and M. Mitov,Soft Matter 15, 3256 (2019).
29G. Agez, R. Bitar, and M. Mitov,Soft Matter
7, 2841 (2011).
30A. Jullien, M. Neradovskiy, A. Scarangella, and M. Mitov,J. R. Soc. Interface 17, 20200239 (2020).
31
A. Jullien, R. Pascal, U. Bortolozzo, N. Forget, and S. Residori,Optica4, 400 (2017).
32M. Hernández-Jiménez, D. E. Azofeifa, E. Libby, C. Barboza-Aguilar, Á. Solís,
L. Arce-Marenco, I. García-Aguilar, A. Hernández, and W. E. Vargas,Opt. Mater. Express4, 2632 (2014).
33E. Libby, D. E. Azofeifa, M. Hernández-Jiménez, C. Barboza-Aguilar, A. Solís,
I. García-Aguilar, L. Arce-Marenco, A. Hernández, and W. E. Vargas,J. Opt.16, 082001 (2014).
34S. Caveney,Proc. R. Soc. London, Ser. B
178, 205–225 (1971), in this paper (p. 214), the ordinary and extraordinary indices are set to 1.59 and 1.68 for “Plu-siotis gloriosa” (a synonym now invalid for C. gloriosa), which leads to a mean refraction index equal to ∼1.63.
35
Y. Bouligand,J. Phys.33, 715–736 (1972).
36
A. Saupe,Mol. Cryst. Liq. Cryst.21, 211–238 (1973).
37
M. Mitov, V. Soldan, and S. Balor,Arthropod Struct. Dev.47, 622 (2018).
38
J. Kobashi, H. Yoshida, and M. Ozaki,Nat. Photonics10, 389–392 (2016).
39
P. Chen, L. L. Ma, W. Hu, Z. H. Shen, H. K. Bisoyi, S. B. Wu, S. J. Ge, Q. Li, and Y. Q. Lu,Nat. Commun.10, 2518 (2019).
40L. L. Ma, W. Hu, Z. G. Zheng, S. B. Wu, P. Chen, Q. Li, and Y. Q. Lu,Adv. Opt. Mater.7, 1900393 (2019).
41
R. Arppe and T. J. Sørensen,Nat. Rev. Chem.1, 003 (2017).
42
M. Schwartz, G. Lenzini, Y. Geng, P. B. Rønne, P. Y. A. Ryan, and J. P. F. Lagerwall,Adv. Mater.30, 1707382 (2018).
Supplementary Material
1
2
3
Hyperspectral topography of the twisted, cholesteric patterns of an insect cuticle under
4
various conditions of helix obliquity
5
6
Aurélie Jullien
1*, Maxim Neradovskiy
1and Michel Mitov
2*7
8
1
Institut de Physique de Nice, Université Côte d’Azur, CNRS, UMR 7010, Valbonne, France
9
2
Centre d’Elaboration de Matériaux et d’Etudes Structurales, CEMES, CNRS, UPR 8011,
10
Université de Toulouse, Toulouse, France
11
12
*
Authors for correspondence: aurelie.jullien@inphyni.cnrs.fr; michel.mitov@cemes.fr
13
14
1. Hyperspectral microscopy
15
16
1.1.
Optical setup
17
18
Microscopy. The experimental setup is sketched in Figure S1. The illuminating lamp source
19
is a tungsten halogen lamp (Fiber-lite DC-950 from Dolan-Jenner). Köhler illumination scheme
20
is employed. The sample is positioned in the focal plane of a microscopic objective. A beam
21
splitter (50:50, Thorlabs) enables the collection of the reflected light. The lateral spatial
22
resolution is fixed by the microscope (magnification 40, numerical aperture 0.65, Nikon) and
23
is about 300 nm, measured as the full-width at half-maximum of the smallest imaged object of
24
a calibration target (close to the theoretical value calculated at the shortest wavelength 𝑟 =
25
1.22𝜆
2𝑁𝐴
= 375𝑛𝑚
).
26
HSI: principle. We make use of a homemade, previously described liquid-crystal-based
27
hyperspectral microscope, relying on Fourier spectrometry.
[1, 2]The microscope can be either
28
transmissive or reflective.
[3]The principle consists of considering electrically driven nematic
29
liquid crystal (LC) cells as a Fourier spectrometer.
[4, 5, 6]The introduced optical phase shift is
30
then controlled by the molecular orientation, tuning the LC birefringence. Once inserted into
31
an imaging system with a 2D detector in the image plane, this polarization interferometer
32
becomes an imaging spectrometer or an instrument for hyperspectral imaging. Collinear and
33
free from moving parts, the setup is characterized by compactness and robustness. Our approach
34
has enabled achieving a high spectral resolution over a broad spectral bandwidth for the
35
following reasons. The spectral resolution of a Fourier spectrometer is inversely proportional
36
to the introduced phase shift. To optimize this value, one needs to consider the use of a thick
37
birefringent medium. We have thus shown the ability to exploit the birefringence of thick
38
nematic cells (200 μm) and to control them dynamically. To avoid diffusion losses during
39
molecular orientation,
[7, 8]we exploit the transient relaxation of the molecules. By applying a
40
bias voltage to the cell, the LC molecules are brought out of equilibrium; then, the voltage is
41
switched off, and the LC molecules are dynamically driven back to their resting position. As
42
voltage is applied, a fast scan of the optical phase shift is obtained. The overall phase shift
43
depends on the LC cell thickness and on the LC material and determines the spectral resolution.
44
Here, a 6 nm resolution, corresponding to a 104π phase shift, is expected.
45
HSI: experimental details. Two LC cells are needed: a thick one (200 μm),
electrically-46
driven, to provide tunable optical phase-shift and a static, thin cell (25 μm) used as a temporal
47
offset. The LC cells are home-made by using 0.7 mm thick, 25 mm × 25 mm transverse size,
48
glass substrates (SPI) over which an indium-tin-oxide (ITO) layer is deposited to allow the
49
application of a bias voltage. A thin film of polyvinyl alcohol (PVA) is spin-coated over the
50
ITO and rubbed in order to favour the planar alignment of the LC molecules (LC director is
51
parallel to the confining surfaces of the cell). Adequate-sized spacers are then glued between
52
two substrates and the commercial nematic mixture E7 (Merck) is finally inserted in the cell
53
gap. The cells’ clear aperture is 20 mm. Only the first thick cell, providing a variable retardation
54
path for the incoming beam, is electrically addressed with a sinusoidal AC voltage (frequency
55
1 kHz, maximum peak-to-peak voltage 20V, Tabor Electronics). Including losses on the
56
polarizers (Glan calcite polarizers from Thorlabs), the hyperspectral setup transmission is 40%.
57
Finally, the detector in the image plane is a fast CCD camera (PHOTRON, 512 pixels × 512
58
60
61
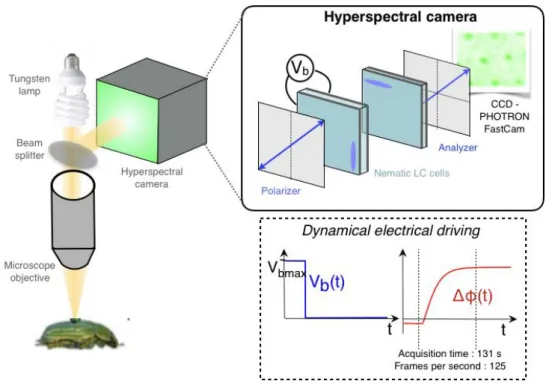
Figure S.1: Experimental setup. The sample is positioned in the focal plane of a microscope
62
objective and illuminated with unpolarized white light. A beam splitter enables the collection
63
of the reflected light. The HSI camera consists of two nematic liquid crystal cells placed
64
between two parallel polarizers and a fast camera placed in the image plane. The anchoring
65
conditions are planar (splay configuration) for the two cells. The first polarizer creates two
66
crossed-polarized waves propagating with different velocities in the birefringent medium. One
67
thick cell (200 μm), electrically addressed, provides a tunable optical path delay between the
68
two polarization directions. This cell is dynamically driven: the bias voltage (Vb(t)) controls
69
the nematic molecular orientation to tune the introduced optical phase-shift (Δφ(t)), as shown
70
in the inset. The voltage step is 20–0 V, and the overall introduced phase shift is 104π rad. A
71
thin static cell with a crossed orientation with respect to the first one is used as a temporal offset.
72
The analyzer permits the interference of the two phase-shifted waves. The images are acquired
73
every 8 ms during nematic cell relaxation (> 2 min.) before Fourier treatment of the data.
[1]74
75
76
77
78
79
1.2.
Acquisition and analysis
81
82
Calibration. The calibration of the tunable phase-shift introduced by the collinear
83
interferometer is first performed by using broadband spectral interferometry, by replacing the
84
CCD camera by a spectrometer the CCD to spectrally resolve the interference pattern between
85
the ordinary and extraordinary polarization components. The tunable phase-shift is measured
86
with a precision better than 250 mrad. More details about the method can be found in Ref.
[1, 9,87
10, 11, 12]