HAL Id: halshs-00609625
https://halshs.archives-ouvertes.fr/halshs-00609625
Submitted on 19 Jul 2011
HAL is a multi-disciplinary open access archive for the deposit and dissemination of sci-entific research documents, whether they are pub-lished or not. The documents may come from teaching and research institutions in France or abroad, or from public or private research centers.
L’archive ouverte pluridisciplinaire HAL, est destinée au dépôt et à la diffusion de documents scientifiques de niveau recherche, publiés ou non, émanant des établissements d’enseignement et de recherche français ou étrangers, des laboratoires publics ou privés.
The relationship between trade credit, bank credit and
financial structure : from firm-level non-linearities to
financial development heterogeneity. A study on MENA
firm-level data
Jézabel Couppey-Soubeyran, Jérôme Héricourt
To cite this version:
Jézabel Couppey-Soubeyran, Jérôme Héricourt. The relationship between trade credit, bank credit and financial structure : from firm-level non-linearities to financial development heterogeneity. A study on MENA firm-level data. 2011. �halshs-00609625�
Documents de Travail du
Centre d’Economie de la Sorbonne
The relationship between trade credit, bank credit and financial structure : from firm-level non-linearities to financial development heterogeneity. A study on MENA
firm-level data
Jézabel COUPPEY-SOUBEYRAN, Jérôme HERICOURT
The relationship between trade credit, bank credit and financial structure:
from firm-level non-linearities to financial development heterogeneity.
A study on MENA firm-level data
*Jézabel Couppey-Soubeyran
aJérôme Héricourt
bAbstract
Using a database of more than 1,100 firms in the MENA region, this article looks at the determinants of demand for trade credit, particularly access to bank credit, size, age and the quality of the firm’s financial structure. We show that the difficulty of gaining access to bank credit positively influences the use of trade credit, and thus demonstrate the substitutability of bank credit and trade credit. Besides, firm’s non-financial characteristics, namely age and size do not influence similarly the probability of having trade credit and the volume of trade credit raised. Additional investigations strongly support the existence of non-linearities in the relationship between trade credit and firm’s financial structure and size. Finally, financial development emerges as a key feature of the demand for trade credit. Indeed, we show that most firm-level characteristics lose their influence on trade credit when financial development is high enough. With financial development, trade credit gets primarily driven by trade relationships, and does not appear any more as a palliative solution when bank credit access is difficult.
JEL codes: F4, G2, O16, O55
Keywords: trade credit, bank credit, financial constraints, financial development
* We are particularly grateful to Christophe Boucher, Anne-Célia Disdier, Dominique Guégan and Nicolas Jacquemet for very useful comments and suggestions on earlier versions of the paper. We also benefitted from
comments of participants at the 3rd Euro-African Conference in Finance and Economics, the 27th Symposium on
Money, Banking and Finance in Bordeaux, and the Finance Seminar at the University of Paris 1. We thank Inès Chaari for valuable research assistance on the data used in this paper. The usual disclaimer applies, and any remaining errors are ours.
a University of Paris 1, Centre d’Economie de la Sorbonne, Maison des Sciences Economiques, 106-112 boulevard de l’Hôpital, 75647 Paris Cedex 13. E-mail : couppey@univ-paris1.fr.
b Corresponding author. EQUIPPE-University of Lille. Faculté des Sciences Économiques et Sociales, USTL – Cité Scientifique – Bât SH2, 59655 Villeneuve d'Ascq Cedex & University of Paris 1, Centre d’Economie de la Sorbonne. E-mail : jerome.hericourt@univ-lille1.fr.
1. Introduction
The link between finance and growth has been examined in a great many empirical studies. After Levine (2005), Aghion (2007) surveyed these studies and highlights two results: i) most of them conclude that financial development has a positive and significant influence on economic growth; ii) this influence may be explained by the fact that financial development reduces the external financing constraints on firms.
In this paper we focus on one of the main constraints relating to the external financing of businesses in developing or emerging countries: the difficulty of securing bank credit. How do businesses with difficulty securing bank credit finance themselves? What alternative form of external financing do they use, given that low financial development also means that market financing is reduced?
Trade credit is one of the possible solutions. This is a specific kind of credit with a maturity that is often very short. It is free of charge, and corresponds to a preferential payment period granted by a supplier to its client. This “credit” allows the beneficiary to finance its operating needs whilst keeping (or while waiting to get) the cash, which is transferred to the supplier on the agreed date. A large number of studies have looked into the link between bank credit and trade credit, some concluding that these two forms of financing are substitutable and others that they are complementary. One of the first studies, by Meltzer (1960), put forward the theory that during periods of monetary restriction, companies replace bank credit by trade credit. Breig (1994) emphasizes that firms use trade credit more and more extensively as bank/company relationships become more distant. Petersen and Rajan (1997) also link the demand for trade credit with the difficulty of access to bank credit. Wilner (2000) puts forward another explanation whereby suppliers tend to help clients in financial distress in order to gain their loyalty and maintain a long-term commercial relationship. Dermigüc-Kunt and Maksimovic (2001) give a more explicit defence of the idea of complementarity between bank credit and trade credit, observing that the trade credit offering is explained above all by an informational advantage among suppliers with regard to their clients.
It should be noted that trade credit is a form of financing that is not specific to developing or emerging countries. It is a widespread source of short-term external financing in the United States and Europe. In fact, most empirical studies addressing this question focus on developed countries, often using data from the United States (Elliehaussen and Wolken, 1993; Petersen and Rajan, 1994, 1997; Nilsen, 2002) or Europe (Crawford, 1992a, 1992b; Breig, 1994; Deloof and Jegers, 1996, 1999; Dietsh, 1998; Marotta, 1997, 2001; Wilson et al., 1999; Wilson and Summers,
transaction costs or cash flow to explain the demand for trade credit. A few studies have however taken a look at emerging countries, in particular the transition countries of Eastern and Central Europe (Coricelli, 1996; Cook, 1999; Berglöf and Bolton, 2002; Hammes, 2003; Delannay and Weill, 2004), and those of Asia (Love et al., 2007) and China (Ge and Qiu, 2007). A
few studies have taken an interest in sub-Saharan Africa (Fafchamps et al., 1995; Biggs et al., 1996;
Isaksson, 2002). But relatively few have explored the link with financial development; there have been Fisman and Love (2003), who showed that businesses use trade credit more extensively in countries with undeveloped banking systems, and the study by Breig (1994) mentioned above. To our knowledge, no study has yet been devoted to the countries of North Africa and the Middle East (MENA), which however provide an excellent field of coverage: the banking penetration rate (percentage of the population that have at least one bank account) is still low (around 30% on average) and the share of bank loans in the external financing of businesses barely exceeds 20%, even though the productive structure is characterized by a high proportion of financially constrained small and medium enterprises. Most MENA economies have fairly undeveloped financial systems and are still growing in terms of banking penetration. The World Bank’s Investment Climate Survey confirms the difficulty of access to credit for firms in this
area: the percentage of businesses with a bank loan was only 24% in 2009 (against 48% for firms in East Asia and Pacific countries, 44% for those in Eastern European and Central Asia countries, 45% for those of Latin America and the Caribbean, and 27% for those of South Asia). Using a firm-level database for more than 1100 firms from three MENA countries, we focus on three key questions: i) does the difficulty of access to bank credit encourage the use of trade credit?; ii) how do firms’ characteristics (mainly, age, size and financial health) impact the demand for trade credit? iii) how does financial development influence the answers to the two previously mentioned questions?
Our findings can be summarized as follows: first, results show that the difficulty of gaining access to bank credit positively influences the use of trade credit, and thus demonstrate the substitutability of bank credit and trade credit; in the same way, the indicators of the quality of the firm’s financial structure negatively influence the demand for trade credit, emphasizing the utility of this form of credit for companies in precarious financial health. Second, we show that firm’s non-financial characteristics, namely age and size, do not influence similarly the probability of having trade credit and the volume of trade credit raised. Trade credit will be more easily granted to older firms, but these older firms will also need to raise less trade credit, emphasizing that importance of reputation effects. Similarly, size will not matter for entering the “trade credit market”, but will influence positively the volume of trade credit raised (at least to a certain
extent), because of increased collateral and probably also because the volume of trade credit is correlated with turnover (itself closely related to the firm’s size). Additional investigations strongly support the existence of non-linearities in the relationship between trade credit and firm’s financial structure and size, providing a potential explanation to some puzzling evidence in the related literature. More importantly, our results support that an increased financial development significantly reduces the substitution relationship between trade credit and bank credit, and more generally decreases the influence of most firm-level determinants for trade credit demand. In particular, for a high enough level of financial development, size, financial structure and credit access do not influence the demand for trade credit anymore.
Our paper is related to the literature that studies the determinants of the demand for trade credit, that implicitly takes place in the more general frame of the impact of financial markets' imperfections on financing decisions. The seminal work of Modigliani and Miller (1958) indeed suggests that in the presence of perfect capital and credit markets, the financing decision of a firm is irrelevant for its investment behavior. On the contrary, in the presence of market imperfections, financing constraints will be reflected in firms' investment decisions. Our intuition is that the same phenomenon should be observed regarding the demand for trade credit: in an environment of imperfect financial markets and low financial development, the demand for both trade and bank credit should be highly dependent on firm’s financial health and own characteristics. Conversely, when financial development increases and credit access is made easier by the presence of a greater number of more active banks, financial markets imperfections are reduced and the demand for trade credit should be less dependent of the abovementioned factors.
This paper contributes to the existing literature at various levels. First, it improves the understanding of the relationship between firms’ characteristics, financial structure and difficulties for accessing bank credit, and the need for trade credit. Second, it provides micro evidence of the role of financial development on financing decisions. Trade credit appears therefore as a substitute to bank credit only in poorly developed financial environments, with highly imperfect financial markets. The consideration of the financial development level is consequently decisive in the debate regarding the relationship between bank and trade credit (are they complements or substitutes?).
The article is organized as follows: Section 2 presents the data and the variables of interest, Section 3 gives details of the empirical methodology, Section 4 comments on the results obtained, and Section 5 gives a conclusion.
2. Data and choice of variables
2.1. DatabaseThe database of the World Bank’s survey on enterprises in developing countries (World Bank’s Investment Climate Survey1
From this database we extracted the MENA countries for which the business data that we needed were all available over at least two consecutive years. Three countries in the MENA region satisfied this availability constraint: Egypt, Lebanon, and Morocco. The periods covered differed from one country to the next, but were always between 2000 and 2004, that is 2002-2003 for Egypt, 2003-2004 for Lebanon and 2000-2002 for Morocco. To control for the potential influence of outliers, we restricted the sample to firms that had declared positive figures for turnover and assets, and positive or null figures for debt and interest payments. We also excluded observations in the 1 percent from the upper and lower tails of the distribution in the regression variables. These cut-offs are aimed at eliminating extraordinary firm shocks, or coding errors. This gives us a database of 1,127 private firms
) is particularly well-suited to our study since it gives information on
the demand for trade credit, access to credit, and the financial health of businesses. The data includes accounting information such as turnover, intermediate consumption, payroll, capital stock, investments and other expenditure; more general information is also available about shareholding structure, characteristics of the workforce, relations with competitors, clients and suppliers, innovation and the business climate. In each country, industries were selected non randomly in order to focus on the main producing sectors. Within each industry, firms were chosen randomly and their composition is therefore representative of the population.
2 for a maximum of 2,269 observations. Since the data were labeled in national currencies, we converted them into US dollars by means of annual exchange rates extracted from the International Financial Statistics (IFS) database built by the International Monetary Fund.
2.2. Variables of interest
The cross-country dimension of our database allows us to study the relationship between financial development and the demand for trade credit, and especially to study how the level of financial development influences the nature of the relationship between trade credit and firm-level determinants. Indeed, we support that a high enough financial development should weaken or even make disappear these relationships.
1 These surveys are available at http://www.enterprisesurveys.org/.
2 There were very few state-owned companies in the initial database (hardly more than 1.5% of the total, or around 30 firms). It was therefore not possible to conduct a sound empirical analysis of this subsample. For this reason, we withdrew them from the database.
In this respect, the financial development indicator we choose (focusing on the financial intermediation aspect) is the ratio between the credits awarded to the private sector and GDP, supplied by the World Bank’s “World Development Indicators” database.3
The surveys used did not provide any precise information about the volume of bank credit on the balance sheets of the firms surveyed (only the global debt of the firms). However, a qualitative variable was available about the difficulty of access to bank credit; this variable takes a value of between 0 and 4 according to whether the answer to the question “Is access to bank loans an obstacle to business?” was “not at all, minor, moderate, major, or severe”. This variable thus provides a relevant measurement of the degree to which firms are constrained in their access to bank credit. If bank and trade credit are substitutable, this variable should therefore impact positively trade credit (the more difficult the access to bank credit, the more firms will rely on trade credit to compensate). Conversely, if bank and trade credit are complement, this variable should impact negatively trade credit (the more difficult the access to bank credit, the less firms will be able to rely on trade credit, due to bad signaling problems).
Similarly to other trade credit studies which also use firm-level data,4
3 See, among others, Beck et al. (2000) and Beck (2002). Fisman and Love (2003) also use this ratio as an indicator of financial development.
we include the age of the firm (measured by the age logarithm plus one), its size (represented by the ratio of total sales over total assets), and its presence in the capital city (a binary variable taking the value of 1 if the firm is settled in the capital city, 0 otherwise). New companies have limited access to bank credit (owing to information asymmetry problems), and thus tend to seek more trade credit (see Berger and Udell, 1995, 1998). At the same time, older firms will also have greater chances to access it (because of reputation effects), so that it is not possible to settle the expected sign a priori for the
age. In that respect, we can also expect a different effect of age on the probability of having trade credit on the one hand, and on the volume of trade credit raised on the other hand. The presence in the capital city is actually another proxy for information research costs and information asymmetry issues: the firms settled in the capital city are closer to a larger set of banks (especially in developing countries, where banks are very concentrated in main cities) and should therefore have a less difficult access to bank credit. If there is a substitutability (resp. complementarity) relationship between bank and trade credit, then these firms should ask less (resp. more) trade credit. But there is another effect to take into account: firms located in capital city are more likely to offer trade credit (Klapper and Randall, 2010). So, if trade credit supply is a key determinant of trade credit demand – a hypothesis which will be largely confirmed by our results – the impact of
the capital city variable cannot be determined a priori. The role played by size is also ambiguous.
On the one hand, large companies are more transparent and offer better guarantees, and so have easier access to external financing and less need for trade credit (Berger and Udell, 1998, 2002; Delannay and Weill, 2004; Ge and Qiu, 2007). But on the other hand, for the very same reasons (greater transparency, better guarantees), suppliers may be inclined to provide more credit to these large companies (Brennan et al., 1988; Mian and Smith, 1992). Authors such as Petersen
and Rajan (1997), Summers and Wilson (2002) or Gama et al. (2008) for developed countries, and
Fafchamps et al. (1995), Biggs et al. (1996) and Iaksson (2002) for developing countries in
sub-Saharan Africa, have shown that the use of trade credit increases with the size of the firm. In this paper, we argue that these conflicting results come in fact from the nonlinear relationship between size and trade credit, initially positive, then negative. This is directly related to the financial dimension of the size variable, which can be interpreted as an indicator of financial health, i.e., as a proxy of firm’s collateral. Trade credit is positively related to size until a certain level, because suppliers ask for some collateral before granting the trade credit. Once this certain level is passed, the firm has better access to other forms of financing and needs less trade credit. We expect the same kind of nonlinear effect for the two additional indicators of financial health we use in our empirical investigation.
The literature typically estimates models where firm’s behavior (generally, its investment choices) is a function of the firm's cash flow. A significant impact of cash flow is generally attributed to the imperfections of the financial markets, thus suggesting the presence of financial constraints.5
Last, we also include two proxy variables for the volume of transactions, the “stock to total assets” ratio, and the “receivable accounts to total assets” ratio. Inventories and special payment We therefore decide to use the ratio of cash flow over total assets, which can be interpreted as an
indication of the volume of funds that can be mobilized on a very short-term basis by the firm. This indicator is widely used in the literature (see Kashyap et al., 1993). Secondly, we use the ratio
of shareholders’ equity over total assets, which can be interpreted as the firm’s capacity to absorb losses
and is thus more an indicator of long-term financial soundness. An increase in each of these two ratios should be seen as an improvement in the firm’s financial health, that is, a decrease of financial constraints. Overall, the effect on trade credit should be negative but once again, we suspect this impact to be actually non-linear, first negative (because suppliers do not provide trade credit until a certain level of collateral), then positive (once passed this level of collateral, firms have an easy access to trade credit).
deadlines granted to clients both increase with the volume of transactions, positively influencing demand for trade credit.
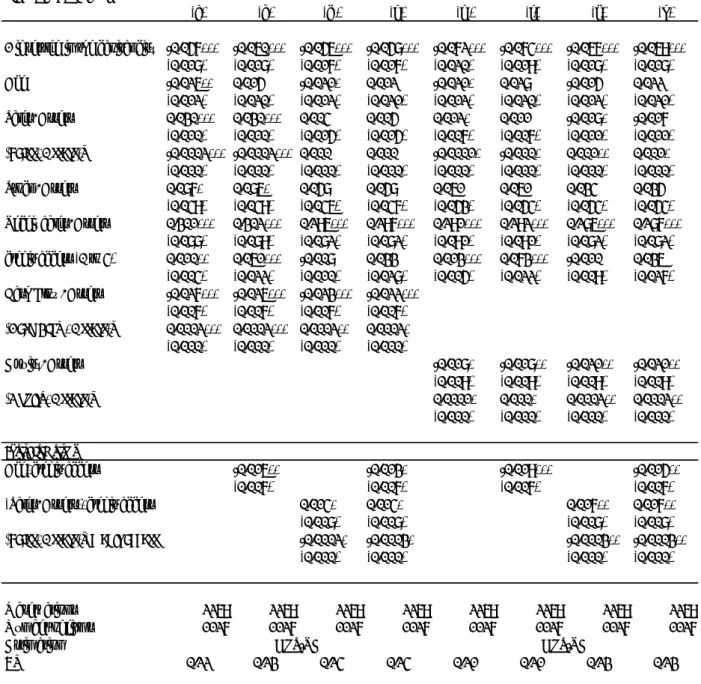
Table 1 presents the descriptive statistics, first those on the total sample, then those on firms that do not use trade credit and lastly on those that do. The stylized facts they depict are consistent with the literature. Firstly, the relationship between trade credit and size (as measured by sales over total assets) does not look clear at first sight. Firms with trade credit seems smaller on average than firms without trade credit, but the distribution in quartiles of size emphasizes that this figure should be interpreted cautiously: below the median at least, firms with trade credit are slightly bigger than the ones without. This descriptive fact highlights the need for a more careful study on the relationship between size and trade credit. Besides, the firms which owe trade credit are four times more labor productive than the ones which do not. In financial terms, these firms also show much lower average cash-flow and equity to assets ratios (respectively, 0.41 vs. 4.85, and 0.47 vs. 1.76), indicating poorer financial health making access to bank credit more difficult. The distribution of the “access to bank credit” qualitative variable is also revealing: firms using trade credit state that they have much greater difficulty gaining access to bank credit than the others. This would seem to support the hypothesis of substitution between trade credit and bank credit which be more formally tested in our econometric analysis.
3. Empirical setting
3.1. Baseline estimated model
Our first aim is to assess the impact of access to credit and financial structure on the demand for trade credit expressed by firms. We start by studying the impact of previously mentioned determinants on both the probability of owing trade credit and the volume of trade credit owed relying on the two base specifications presented below. There is indeed no reason to suppose a priori that these determinants should be strictly identical in both cases; besides, the combination
of both equations will help us to identify potential selection problems, if any (cf. infra).
As the fact of owing trade credit is a discrete variable by definition equal to 0 or 1, the probit model is appropriate. Hence, the probability of owing trade credit for a firm i during year t is :
1 if 1 1 1 , 1, , 1 1 , , >0 Prob 0 0 otherwise , D A S C c TC i i i t i i t i i t k t i t Assets i t α β χ λ κ γ η θ ε + + + Τ + + Ω + + + + > = (1)
The impact of the explanatory variables on the volume of trade credit owed is estimated by replacing the dependent variable in Eq. (1) by the ratio of trade credit (TC) over total assets. The
estimated relationship is a standard linear equation which can be written as follows: 2 2 2 , 2, , 2 2 , , , (2) i i i t i i t i i t k t i i t i t TC D A S C c Assets α β χ λ κ γ η θ ν ε = + + + Τ + + Ω + + + + +
Where Di corresponds to the firm’s presence in the capital city, Ai to its age and Si,t to the ratio of
total sales over total assets as a proxy for its size; Ti,t is a vector containing the transaction
variables (receivables to assets and stock to assets), whereas Ci is the access to credit indicator.
Ωi,t alternatively corresponds to one of the two variables representing the firm’s financial health,
respectively Cash Flow/Total Assets and Equity/Total Assets. ηk and θt are dummy variables designed to capture unobservable characteristics at the sectoral and time levels. Lastly, νi, is an i.i.d. random term designed to capture unobservable heterogeneity at the firm-level.6
We introduce subsequently square terms for the variables proxying size and financial constraints in order to check for the existence of non-linear financial effects on the demand for trade credit. To make things clear, Table 2 below summarizes the expected signs for our empirical specifications, with and without square terms:
This formulation offers continuity with the studies by Elliehosen and Wolken (1993) and Summers and Wilson (2002), and is very similar to other empirical works on the subject (see Delannay and Weill, 2004, Ge and Qiu, 2007).
[Insert Table 2 here]
As previously mentioned, some qualitative differences between the estimated coefficients for Eq. (1) and Eq. (2) are far from being impossible. If any, these differences should give us some information on the respective role of information asymmetry and reputation effects on the relationship trade credit and firm structure. More precisely, substantial differences in size and/or sign will tell us if information costs and financial constraints matter more for being able to raise trade credit, or increasing its volume. To our knowledge, this question has been neglected in the literature so far.
3.2. Econometric issues
The empirical specifications that we selected contain several explanatory variables which were entered identically for all the years at our disposal: presence in the capital city, age of the firm and access to credit. These variables are thus time-invariant. Additionally, the unobserved individual heterogeneity at the firm-level raises the problem of the choice between fixed and random effects. The first choice raises a problem of perfect multicolinearity with the time-invariant
6Note that this term is included in Eq. (2), but not in Eq. (1), due to insufficient variability. See the following subsection for further details.
regressors, and is anyway impossible to implement in the context of Eq. (1)7. The choice of random effects does not cause this problem, but proved to be unreliable again in Eq. (1)8
The possibility of a problem of endogeneity between the dependent variable and certain right-hand side variables is an important potential source of bias. Indeed, although the exogeneity of age and presence in the city is never in doubt, the hypothesis of reverse causality for the size, transaction, financial structure and access to credit variables should not be neglected. However, this problem cannot be treated simultaneously for all the variables. Although the use of standard linear method based on instrumental variables is suitable for quantitative/continuous regressors, it is not suited to a qualitative variable (which is furthermore time-invariant) such as access to credit. We therefore decided to address this problem of endogeneity in two steps.
.We decided therefore to estimate Eq. (1) with a pooled probit including year and sector-level dummies. Eq. (2), however, is estimated using Generalized Least Squares (GLS) with firm-level random effects.
Concerning continuous regressors, due to the limited degrees of freedom, we cannot perform any non-linear instrumental variable estimation for the probability of owing trade credit (Eq. (1)). We then test the endogeneity of the right-hand side variables. We regress each potential endogenous regressor on its own lags and on other exogenous variables. Residuals of all these first stage regressions are introduced afterwards in Eq. (1), and a Fisher test for joint significance of all residuals is implemented to provide a diagnosis on endogeneity. The null hypothesis can be rejected in two cases over three, casting some doubts on the possibility of reverse causality. Nevertheless, we decide to report a double set of estimates for each specification. A pooled probit based on contemporaneous values of regressors is first reported, completed by another one relying on first lagged values of right-hand side variables. Regarding the value of trade credit owed by firms, Eq. (2) was estimated using the Two-Stage Least Squares (2SLS) estimator using two alternative sets of instruments. The first one contains the first and the second lags of current period regressors. The second one relies on the second lags of current period regressors, a dummy variable for having a short-term credit, a qualitative variable (0 to 4, and interpreted in the same way as the credit access indicator) related to the difficulty induced by the cost of credit and the dependence to external finance9
7 This is because of the incidental parameters problem, see Wooldridge (2002, p. 484) for more details on that matter.
at the sectoral level interacted with financial
8 Since our sample contains two or three years per firm (cf. Data section supra), we are left with an insufficient time variance to perform reliable random effect panel Probit estimation. Our different tries showed that convergence could not be robustly achieved when changing the number of integration points used for quadrature calculation. 9 These data on external financing dependence were built by Rajan and Zingales (1998) from US data. These authors define external financing dependence as the fraction of investment expenditure not financed by cash flows from the
development at the country level.10
Concerning credit access, it was not possible to test formally the hypothesis of reverse causality for Eq. (1), due to the abovementioned issues (i.e. degrees of freedom are too limited to perform IV probit estimation). For Eq. (2) however, we could implement a treatment effects model as suggested by a Maddala (1983) for studying the effect of an endogenous binary treatment on another endogenous continuous variable. Therefore, we create a binary access to credit variable which takes the value 1 if access to credit presents moderate or major difficulties (levels 3 and 4 of the qualitative variable), and 0 otherwise (levels 0, 1, 2 of the qualitative variable). Once again, we use the dummy variable for having a short-term credit, the difficulty induced by the cost of credit and the dependence to external finance at the sectoral level interacted with financial development at the country level as explanatory variables for the credit access variable in the first-step probit estimation. Indeed, they consistently play a significant role in access to bank credit.
The three last variables were selected for the significant influence they have on financial structure. As our sample contains two or three years per firm, the 2SLS are therefore performed over a single year.
We also check the robustness of our baseline estimates to a potential selection bias regarding the demand for trade credit itself, due to a factor that would be absent from our estimation. Indeed, some firms may, all things equal, ask for more trade credit due to a specific characteristic. One can easily think of the export status: export firms tend to ask their suppliers for longer payment deadlines due to geographic distance (see Summers et al., 1999). This problem can be solved by a two-step Heckman procedure, using the firm’s status as an exporter (a binary variable taking the value 1 if the firm exports and 0 otherwise) as the selection variable (available in the World Bank Enterprize Surveys). This variable has been proven to influence only the probability of owing trade credit (Eq. (1)), and not volume of trade credit owed (Eq. (2); see Wooldridge, 2002). Following Beck et al. (2006), we also estimate Eq. (1) and (2) with interacted terms between size
and age on the one hand, and credit access on the other hand. By estimating the joint influences
firm’s operations. As Berman and Héricourt (2010) point out, the degree of financial dependence of US industries may be considered as optimal within a context of high financial development and low financial constraints for firms. The level of external financial dependence of each American industry should thus reflect the real demand for external financing by these industries in each country under consideration. As a result, we applied this measure of external financial dependence to all industries in our database.
10 We check the validity of our instruments using two different tests. Robust to heteroskedasticity and clustering, the Hansen J-statistics (or J-stats) of overidentification restrictions do not reject our set of instruments. We also report the F-stat form of the Kleibergen–Paap statistic, the heteroskedastic and clustering robust version of the Cragg–Donald statistic suggested by Stock and Yogo (2005) as a test for weak instruments. All statistics are situated at very comfortable levels as regards the critical values, confirming that our choice of instruments was appropriate. Last, we presented the results of the Durbin-Wu-Hausman exogeneity test of explanatory variables. Results are mixed, depending on the specification and the set of instruments used (see Table 5 below). We then report both GLS and 2SLS estimates.
of these variables, we want to assess if the effect of firm-specific characteristics is actually related to the difficulty to access bank credit. Last, the structure of our data confronts us with the problem of error clustering. As well as the usual White correction for heteroskedasticity, we also correct for the correlation of errors within firms using the Froot (1989) correction.
4. Results
4.1 Credit access, financial structure and trade credit: baseline estimates [Insert tables 3 and 4 here]
Table 3 presents the results of the baseline estimations of Equation (1), that is, the impact of firm-specific control variables (presence in the capital city, age, size), and transaction, quality of financial structure, and access to credit variables on the probability of demanding trade credit. Columns (a) to (c) show the results without using our financial variables; columns (d) to (f) use the first financial proxy, i.e. the ratio of cash flows over total assets; columns (g) to (i) contain the estimations using the second proxy, i.e. the ratio of equity over total assets. Columns (b), (e) and (h) include lagged regressors for continuous variables11
Estimated coefficients display signs fully consistent with the hypothesis of substitutability between bank and trade credit: the more difficult the credit access, the higher the probability to ask for trade credit; besides, firms located in the capital city have a lower probability to ask for trade credit. Regarding firms’ non-financial characteristics, size does not seem to play a significant role, whereas the reputation effect (positive impact of age) seems to dominate for accessing trade credit. Only one of the two transaction variables has a significant influence: unlike the stock to assets variable, the ratio of receivables to assets has a significant and positive influence on the demand for trade credit. One of the most decisive factors in the use of trade credit is also quite simply the fact that firms are themselves also trade creditors (the measured marginal effect is by far the highest). Coefficients on our financial-structure quality indicators are negative and significant in most estimations, especially when quadratic terms are included. This reflects the fact that better financial health reduces the need for trade credit. This is true until a certain threshold for the Cash Flow over Assets ratio, the positive and significant quadratic term and will be commented in the next sub-section. Columns (c), (f) and (i) add squared terms for size and each financial proxies. The reported coefficients are marginal effects computed at means for continuous regressors.
11 Note that, due to an insufficient number of observations, we could not estimate a specification including the lagged ratio of Cash Flow to Assets.
indicating a reversion of the effect. In absolute terms, however, this effect is quite weak, and in any case much lower than the initial negative effect.
Table 4 shows the results on the volume of trade credit raised, that is, for Eq. (2). Columns (a) and (b) present the results without using our financial proxies; columns (c) to (d) add the first one, and columns (e) and (f) the second one. Columns (b), (d) and (e) include the already mentioned quadratic terms for size and financial proxies.
These estimates display some common features with the ones described above, but also some interesting differences. Regarding the common trends, one can notice that effects are almost identical for the capital city and credit access variables, confirming the substitutability relationship between bank and trade credit: the easier the bank credit access (because the firm is located in the capital city, or simply declares to face no major difficulties to access loans), the less the volume of trade credit raised. Similarities are also very strong concerning the transaction variables: only the receivables to assets ratio has a significant, positive impact, even stronger than for Eq. (1). The estimation confirms also the significant and non-linear impact (including Equity/Assets, this time) of our financial health indicators; interestingly, these impacts are in absolute terms roughly twice higher than the ones estimated for Eq. (1).
However, the age of the firm does now significantly and negatively influence the volume of trade credit raised. This is consistent with the idea that the reputation a company acquires with age relaxes the financial constraint on it, mainly due to fewer problems of information asymmetry between lenders and borrowers. Therefore, this reputation effect works in a reverse way to the one stated for the probability of asking for trade credit: being older helps to get into the “trade credit market”, but at the same time decreases your need for it. Whereas it was previously not significant, the size of the firm now significantly and positively influences the demand for trade credit. This can be interpreted in terms of volume of business: the bigger the firm, the more contact is has with a large number of suppliers from which it obtains special payment terms. When introduced, the quadratic term proves to be significant and negative: this supports the existence of a non-linear relationship, similar to the one highlighted for our indicators of financial health. Once the firm has become big enough, her need for trade credit reduces, since she can more easily collateralize some bank credit.
4.2. Robustness to endogeneity and selection bias
Regarding Eq. (1), endogeneity concerns were tackled using a specification based on lagged regressors for continuous variables12
12 Note that due to insufficient observations, the inclusion of the lagged Cash Flow/Assets ratio was not possible
endogeneity are mixed. Actually, the null of exogeneity is rejected only in the specification including the second financial proxy.
[Insert table 5 here]
Table 5 presents the estimations for Eq. (2) using the two-stage least squares method (columns (a), (b), (d), (e), (g) and (h)) and those from the treatment effects model (columns (c), (f) and (i). As regards the model based on 2SLS the Hansen and Kleibergen-Paap statistics largely support choices of instruments (see above). The results of the Durbin-Wu-Hausman exogeneity tests are more ambiguous. The null of exogeneity cannot be rejected in two cases over six (columns (b) and (h)). Regarding the treatment effects model, the insignificance of the λ parameter discards the
possibility of a treatment bias coming from the credit access.
To sum up, the diagnosis on endogeneity is quite mixed for both equations. Actually, when considering the estimates based on lagged values for Eq. (1) or 2SLS for Eq. (2), one can see that results are often even more significant, and sometimes higher in absolute values, than in their standard counterparts. For example, the impact of credit access is very significant whatever the specification and the estimation method considered, but elasticities are generally higher in the lagged regressors/IV estimates. Similarly, size, the ratio of stock over assets and the financial proxies appear to influence even more robustly the lagged specification for Eq. (1) and the 2SLS estimation of Eq. (2). In other terms, the suspected bias, if any, will affect our results downward. Based on standard pooled probit and GLS estimations in order to preserve degrees of freedom, results presented in the next subsections should be consequently considered as the lowest benchmark.
[Insert table 6 here]
Table 6 tests the robustness of Eq. (2) in the framework of a two-step Heckman selection model. The latter consider the possibility of another type of bias, coming from an omitted factor affecting only Eq. (1), in our case, the fact of being an exporter (cf supra). The non-significance of
the Mills ratio in the equation of interest (columns (b), (d), (f), (h), (j) and (l)) emphasizes the absence of empirical support of a selection bias conditionally to the exclusion restrictions, thus confirming that the estimations shown in Tables 4 and 5 are reliable in that respect.
4.3. On the joint impact of firm specific characteristics and credit access [Insert Table 7 here]
As shown by Beck et al (2006), size and age are major firm-level determinants of financial
constraints. In order to check the relevance of these conclusions in our context, Table 7 includes in Eq. (2) interacted terms first between age and credit access (columns (b) and (f)), then between size and credit access (columns (c) and (g)); for robustness and comparison purposes, both interactions are included in columns (d) and (h)), and columns (a) and (e) report the baseline estimates of Eq. (2).
Results are fully in line with those of Beck et al. (2006). Interacted terms are always significant, whatever the specification considered. Besides, age and size become insignificant or weakly significant when interacted terms are included. The latter display the same signs than size and age when non interacted. This clearly means that both age and size effects on trade credit demand goes mostly through their impact on credit access: it is because older and larger firms have easier access to bank credit that they ask for less trade credit. In other terms, it is because reputation acquired with age and the ability of bringing collateral embodied by size are essential determinants of bank credit access that they are also important determinants of trade credit. Finally, it is worth noting that these interacted effects are quite important in absolute terms for age and size, but much smaller, once again, for the squared size: if small firms will ask for substantial amounts of trade credit (because of the constraints they face for accessing bank credit), large firms will decrease their trade credit demand, but in much smaller proportions. 4.4. On the impact of financial development
[Insert Table 8 here]
So far, our results have shown that better financial health tended to reduce recourse to trade credit, while the latter increased with the difficulty of access to credit. In this context a reduction in financial constraints at national level, for example by raising the level of financial development, should reduce the use of trade credit, the role of financial health, and the difficulty of access to bank credit in terms of its determination.
In order to assess the relevance and importance of these effects, Table 8 presents estimations from Eq. (2) including financial development13
13 These estimations are thus made without time dummy variables, since these are perfectly colinear with the bank credit/GDP ratio.
the size, credit access and financial health variables (columns (a), (b), (c) and (d)). Thereafter, we took the analysis further by splitting the sample around the median of financial development (columns (e) to (j)), and testing formally the equality of coefficients over the two subsamples14 Financial development significantly reduces the use of trade credit. Several other results appear to be particularly interesting: the positive influence of difficulty of access to credit on the demand for trade credit is no longer significant when financial development is introduced among the explanatory variables. Nor is it significant when access to bank credit is interacted with financial development. Additionally, when the firms are split into two subsamples (one “high”, above the financial development median, and the other “low”, below this same median), tests of equality of coefficients strongly reject, both for the equation as a whole and for our variables of interest, the null of equality. Therefore, it is confirmed that the difficulty of access to bank credit has a significant influence on demand for trade credit among firms in the less financially developed countries, but that this influence is no longer significant with regard to demand for trade credit among firms in the more financially developed countries. This comes down to saying that trade credit substitutes bank credit when the level of financial development is low but that this substitutability relationship no longer holds when financial development is higher.
.
Another interesting effect we highlight is that the positive influence of size on demand for trade credit actually seems to be due to the low level of financial development, since in our estimations this effect disappears for firms in countries where financial development is situated above the median. These results are fully consistent with the ones shown previously, especially in Table 7: when financial development is high enough, bank credit access is easier and consequently, the impact of size, which has been shown to go through bank credit access, also vanishes. From this we can deduce the existence of a sort of “double penalty” effect for small firms in the less financially developed countries: access to bank credit is more difficult for them, as shown in the literature (see Bernanke et al., 1999), but so is access to trade credit, as our study shows. Last, in
terms of the financial health variables, we observe that an improvement in financial health reduces the use of trade credit when financial development is low, but no longer has an influence when financial development is high (as we showed when the sample was divided around the financial development median), or even strengthens the demand for trade credit (as we showed by interacting financial health with financial development). All in all, these results support that the heterogeneity in terms of financial development level has a decisive impact on the relationship between bank credit access and trade credit, and more generally on all determinants
14 These tests (standard tests based on χ² statistics) are shown solely for the key variables of interest, namely size, credit access and financial variables. Tests of equality for other variables remain available upon request to the authors.
of trade credit demand but receivables, which remain robustly significant whatever the level of financial development. The impact of the receivables to assets ratio is quantitatively more important for countries with a high level of financial development: for the latter, trade credit is primarily driven by trade relationships, and does not appear any more as a palliative solution when bank credit access is difficult.
[Insert Table 9 here]
These results are comforted by a further splitting of the sample around the quartiles of financial development. Table 9 presents the results for these subsamples: columns (a), (d) and (g) for the highest quartile; columns (b), (e) and (h) on the intermediate quartiles15; columns (c), (f) and (i) for the lowest quartile. Results are fully consistent with the ones presented on Table 8. Our empirical setting has the highest explanatory power on the lowest quartile (R² equal to 46-47 %), looses it partly on the intermediate quartiles (R² between 14 and 28 %), then almost totally on the highest one (R² equal to 11-12 %). In a nutshell, all these results confirm that most firm-level specific characteristics including size and financial health indicators lose their influence on trade credit when financial development is high enough. When financial development increases, financial structure tends to be more “neutral”, and trade credit is raised for other reasons than barriers to bank credit. This supports our initial intuition that financing decisions can be thought in a frame similar to the one designed by Modigliani and Miller (1958) for investment decisions: when financial development increases, financial markets frictions are reduced and the demand for trade credit becomes less dependent of firm’s characteristics, financial structure and difficulties to access bank credit.
4.5. Robustness checks
Lastly, we tested the robustness of our results to various alternative specifications. Our conclusions are identical when: (i) we drop each country one by one (which means that our results are not due to a particular country); (ii) we use alternative definitions for the dependent variable, such as the trade credit logarithm or the trade credit to sales ratio; (iii) we use the number of employees as a proxy for size (iv) we run regressions on sectoral subsamples (when the number of available observations allows it).
15 Due to insufficient observations on the third quartile (less than 70), we decided to perform estimations on both
5. Conclusion
Using a cross-country firm-level database based on World Bank’s Investment Climate Survey, we have studied the determinants of trade credit at the firm-level in countries from the MENA region. Our results show that the difficulty of gaining access to bank credit positively influences the use of trade credit, and thus demonstrate the substitutability of bank credit and trade credit; in the same way, the indicators of the quality of the firm’s financial structure negatively influence the demand for trade credit, emphasizing the utility of this form of credit for companies in precarious financial health. Besides, we show that firm’s non-financial characteristics, namely age and size do not influence similarly the probability of having trade credit and the volume of trade credit raised. Trade credit will be more easily granted to older firms, but these older firms will also need to raise less trade credit, emphasizing the importance of reputation effects. Similarly, size will not matter for entering the “trade credit market”, but will influence positively the volume of trade credit raised (at least to a certain extent), because of increased collateral.
Our additional investigations strongly support the existence of non-linearities in the relationship between trade credit, and firm’s financial structure and size; besides, our results suggest that size and age effects on trade credit are actually mainly indirect, reflecting mainly firm’s ability to access bank credit. We also show that most firm-level characteristics including size, age and financial health indicators lose their influence on trade credit when financial development is high enough. With financial development, financial structure tends to be more “neutral”, and trade credit is raised for other reasons (in particular, trade relationship) than barriers to bank credit. This paper contributes to a large literature documenting the impact of financial development on growth, and provides useful empirical insights on some contradictory results found in the literature, especially regarding the impact of size, age and bank credit access on the demand for trade credit. A systematic analysis of these effects within a relevant theoretical framework constitutes surely an interesting area for future research.
References
AGHION P. (2007), “Interaction Effects in the Relationship between Growth and Finance”, in X. Freixas et al. (Eds.), European Financial Markets and Institutions, Oxford: Oxford University
Press.
BERGÖF E., BOLTON P. (2002), “The great divide and beyond: Financial architecture in transition”, Journal of Economic Perspectives, 16, 77-110.
BECK, T. (2002) “Financial development and international trade: is there a link?”, Journal of International Economics 57, 107-131.
BECK T., DEMIRGÜÇ-KUNT A.,, LAEVEN, L., MAKSIMOVIC, V. (2006), “The Determinants of Financing Obstacles”, Journal of International Money and Finance 25, 932-952. BECK T., DEMIRGÜÇ-KUNT A., LEVINE R. (2000), "A New Database on Financial Development and Structure," World Bank Economic Review 14, 597-605.
BERGER A.N., UDELL G.F (1995), “Relationship lending and lines of credit in small firm finance”, Journal of Business 68(3), 351-381.
BERGER A.N., UDELL G.F (1998), “The economics of small business finance: The roles of private equity and debit markets in the financial growth cycle”, Journal of Banking and Finance, 22(8), 613-673.
BERGER A.N., UDELL G.F (2002), "Small Business Credit Availability and Relationship Lending: The Importance of Bank Organisational Structure," Economic Journal 112(477), 32-53. BERMAN N., HERICOURT J. (2010), "Financial Factors and the Margins of Trade: Evidence from Cross-Country Firm-Level Data'', Journal of Development Economics 93(2), 206-217. BERNANKE, B., GERTLER, M., GILCHRIST, S. (1999), “The financial accelerator in a quantitative business cycle framework”, in J. Taylor et M. Woodford (Eds.), Handbook of Macroeconomics, Amsterdam: North Holland.
BIAIS, B., GOLLIER C. (1997), “Trade credit and credit rationing”, Review of Financial Studies 10, 903-937.
BIGGS, T., RATURI, M., SRIVASTAVAC, P. (2002), “Ethnic networks and access to credit: evidence from the manufacturing sector in Kenya”, Journal of Economic Behavior and Organization 49(4), 473-486.
BREIG, H. (1994), “Bank lending and corporate financing in major industrial countries: Are France and Germany Really similar?”, Working Paper, Albert Ludwing Universitat, Breisgau. BRENNAN M., MACKSIMOVIC V., ZECHNER J. (1988), “Vendor financing”, Journal of Finance, 43, 1127-1141.
COOK L.D. (1999), “Trade Credit and Bank Finance: Financing Small Firms in Russia”, Journal of Business Venturing 14, 493-518
CORICELLI, F. (1996),"Finance and growth in economies in transition," European Economic Review, 40(3-5), 645-653.
CRAWFORD P. (1992a), “Trade credit and credit rationing: Part I”, Discussion paper n°92/323, University of Bristol.
CRAWFORD P. (1992b), “A Survey of the Trade Credit Literature”. Discussion paper n°92/324, University of Bristol.
DELANNAY A.F., WEILL L. (2004), “The determinants of trade credit in transaction countries”, Economics of Planning, 37, 173-193.
DELOOF M., JEGERS M. (1996), “Trade credit, product quality, and intragroup trade: Some European evidence”, Financial Management, 25 (3), 33-43.
DELOOF M., JEGERS M. (1999), “Trade credit, corporate groups and the financing of Belgian firms”, Journal of Business, Finance and Accounting, 26 (7-8), 945-966.
DEMIRGÜC-KUNT A., MAKSIMOVIC V. (2001), “Firms as financial intermediaries: Evidence from trade credit data”, World Bank, Working Paper n°2696.
DIETSH M. (1998), “Atouts et handicaps du crédit client face au crédit bancaire”, Revue d’Economie Financière, n°46, 175-193.
ELLIEHAUSEN G. E., WOLKEN J. D. (1993), “The demand for trade credit: An investigation of motives for trade credit use by small business”, Staff Study, 165, Board of Governors of the Federal Reserve System, Washington.
FAFCHAMPS, M., PENDER, J., ROBINSON, E. (1995), “Enterprise Finance in Zimbabwe”,
in Regional Program for Enterprise Development, Africa Division. Washington, D.C: The World Bank.
FISMAN R., LOVE I. (2003), “Trade credit, financial intermediary development and industry growth”, Journal of Finance, 58 (1), 353-374.
FRANK M. Z., MAKSIMOVIC V. (2005), “Trade credit, collateral, and adverse selection”,
Working paper University of Maryland. (http://www1.fee.uva.nl/fm/PAPERS/tcFeb26_2004.pdf).
FROOT K. (1989), “Consistent covariance matrix estimation with cross-sectional dependence and heteroskedasticity in financial data”, Journal of Financial and Quantitative Analysis, vol. 24, 333–355.
GAMA A.P., MATEUS C., TEIXEIRA A. (2008), “Does trade credit facilitate access to bank finance? Empirical evidence form Portuguese and Spanish small medium size enterprise”, SSRN Working Paper Series, http://ssrn.com/abstract=1310818.
GE Y., QIU J. (2007), “Financial development, bank discrimination and trade credit”, Journal of Banking and Finance, 31, 513-530.
HAMMES, K. (2003), “Trade credits in transition economies”, CERGU Working Paper n°00-11, Göteborg University.
HUBBARD, G. (1998), “Capital Market Imperfections and Investment”, Journal of Economic Literature 36(3), 193-225.
ISAKSSON A. (2002), “Trade Credit in Kenyan Manufacturing: Evidence from plant-level data”, Statistical and Information Networks (UNIDO) Working Paper n°4.
KASHYAP A., STEIN, J., WILCOX, D. (1993), “Monetary Policy and Credit Conditions: Evidence from the Composition of External Finance” American Economic Review 83(1), 78-98. KLAPPER L., RANDALL D., “The Impact of the Financial Crisis on Supply-Chain Financing”, Enterprise Surveys, Enterprise Note Series n°13, 2010.
LEVINE, R. (2005), « Finance and growth: theory and evidence », in P. Aghion and S. Durlauf (eds.), Handbook of Economic Growth, Amsterdam: North-Holland, pp. 866-934.
LOVE, I., PREVE, L., SARRIA-ALLENDE, V. (2007), “Trade credit and bank credit: Evidence from recent financial crises”, Journal of Financial Economics 83(2) 453-469.
MAROTTA G. (1997), “Does trade credit redistribution thwart monetary policy? Evidence from Italy”, Applied Economics, 29 (12), 1619-1629.
MAROTTA G. (2001), “Is trade credit more expensive than bank loan? Evidence from Italian firm-level data”, University of Modena Working Paper n° 0103.
MELTZER A.H. (1960), “Mercantile credit, monetary policy and size of firms”, Review of Economics and Statistics, 42 (4), 429-443.
MIAN S.L., SMITH C.W. (1992), “Account receivable management policy: Theory and evidence”, Journal of Finance, 47 (1), 169-200.
MODIGLIANI, F., MILLER, M.H. (1958), “The cost of capital, corporation finance and the theory of investment.”, American Economic Review 48 (3), 261–297.
NILSEN J.H. (2002), “Trade credit and the bank lending channel”, Journal of Money, Credit and Banking, 34 (1), 226-253.
PETERSEN M.A., RAJAN R.G. (1994), “The benefits of lending relationships: Evidence from small business data”, The Journal of Finance, 48 (1), 3-37.
PETERSEN M.A., RAJAN R.G. (1997), “Trade credit: Theories and evidence”, Review of Financial Studies, 10 (3), 661-691.
RAJAN R.G., ZINGALES L. (1998), “Financial dependence and growth”, American Economic Review, 88, 559-586.
STOCK, J. H., YOGO, M. (2005), “Testing for weak instruments in linear IV regression”. In: Andrews, D.W., Stock, J.H. (Eds.), Identification and Inference for Econometric Models: Essays in Honor of Thomas Rothenberg. Cambridge University Press, Cambridge.
SUMMERS B., WILSON N. (2002), “An empirical investigation of trade credit demand”, International Journal of the Economics of Business, 9 (2), 257-270.
WILNER B.S. (2000), “The exploitation of relationship in financial distress: The case of trade credit”, Journal of Finance, 55 (1), 153-179.
WILSON N., SINGLETON C., SUMMERS B. (1999), “Small business demand for trade credit, credit rationing and the late payment of commercial debt: An empirical study”, in M. Wright and K. Robbie, eds, Management buy-outs and venture capital: Into next millennium. Cheltenham, UK:
Edward Elgar Publishing, 181-201.
WILSON N., SUMMERS B. (2002), “Trade credit terms offered by small firms: Survey evidence and empirical analysis”, Journal of Business Finance and Accounting, 29 (3) et (4), 0306-686X. WOOLDRIDGE J. (2002), Econometric Analysis of Cross Section and Panel Data. Cambridge, MA:
Tables
Variable Obs. Mean SD Q1 Median Q3
All observations Sales/Assets 2444 1.57 5.62 0.68 1.04 1.59 Labor productivity 2358 8.14 3.38 8.08 9.23 10.31 Credit Access 2357 2.82 1.49 2 3 4 Cash Flow/Assets 2488 0.94 12.44 0.01 0.04 0.17 Equity /Assets 2488 0.62 3.69 0.21 0.38 0.62
Firms without trade credit
Sales/Assets 298 3.03 14.99 0.54 1.03 2.04
Labor productivity 262 2.64 2.91 0.84 1.46 2.81
Credit Access 241 1.76 1.76 0 2 4
Cash Flow/Assets 299 4.85 34.86 0.21 0.76 2.17
Equity /Assets 299 1.76 10.4 0.28 0.69 1.00
Firms with trade credit
Sales/Assets 2146 1.36 2.10 0.70 1.05 1.55
Labor productivity 2096 8.83 2.74 8.48 9.42 10.43
Credit Access 2116 2.94 1.41 2 4 4
Cash Flow/Assets 2189 0.41 2.82 0.01 0.03 0.1
Equity /Assets 2189 0.47 0.76 0.21 0.36 0.57
Table 1. Descriptive Statistics
Base spec. With quad. terms Base spec. With quad. terms
Variable
1 if settled in the capital city +/- +/- +/-
+/-Age +/- +/- +/- +/-Sales/Assets +/- + +/- + (Sales/Assets)² - -Stock/Assets + + + + Receivables/Assets + + + + credit access (0 to 4) + + + + Cash Flow/Assets - - - -(Cash Flow/Assets)² + + Equity/Assets - - - -(Equity/Assets)² + +
Estimated model Estimated model
Equation (1) Equation (2)
Dep. Var: Pr(TC/Assets>0)
(a) (b) (c ) (d) (e ) (f) (g) (h) (i)
1 if settled in the capital city -0.033** -0.084** -0.033** -0.031** -0.079** -0.022 -0.034** -0.086** -0.033** (0.015) (0.033) (0.015) (0.015) (0.032) (0.013) (0.015) (0.034) (0.015) Age 0.014** 0.025* 0.014** 0.013* 0.023* 0.012* 0.014** 0.028** 0.014** (0.007) (0.013) (0.007) (0.007) (0.013) (0.007) (0.007) (0.014) (0.007) Sales/Assets -0.001 -0.001 0.001 0.008*** -0.000 -0.000 (0.001) (0.001) (0.001) (0.003) (0.001) (0.001) (Sales/Assets)² 0.000 -0.0001*** -0.000 (0.000) (0.000) (0.000) Stock/Assets -0.004 -0.004 -0.001 0.010 -0.000 0.000 (0.007) (0.007) (0.007) (0.008) (0.007) (0.008) Receivables/Assets 0.114*** 0.114*** 0.116*** 0.114*** 0.114*** 0.113*** (0.021) (0.021) (0.021) (0.020) (0.021) (0.021) credit access (0 to 4) 0.007*** 0.016*** 0.007*** 0.007*** 0.016*** 0.006*** 0.007*** 0.016*** 0.007*** (0.002) (0.004) (0.002) (0.002) (0.004) (0.002) (0.002) (0.004) (0.002) Cash Flow/Assets -0.003 -0.003 -0.012*** (0.002) (0.002) (0.004) (Cash Flow/Assets)² 0.0001*** (0.000) Equity/Assets -0.007* -0.009* (0.004) (0.005) (Equity/Asset)² 0.000 (0.000) (Sales/Assets)t-1 -0.005** -0.003 -0.004* (0.002) (0.003) (0.002) (Stock/Assets)t-1 0.035* 0.037* 0.037* (0.021) (0.021) (0.022) (Receivables/Assets)t-1 0.212*** 0.211*** 0.205*** (0.049) (0.048) (0.049) (Equity/Assets)t-1 -0.021** (0.010) Observations 2,269 1,518 2,269 2,269 1,518 2,269 2,269 1,504 2,269 Number of firms 1,127 1,009 1,127 1,127 1,009 1,127 1,127 1,009 1,127 Estimation Fisher stat. P-value Pseudo R² 0.31 0.30 0.31 0.31 0.30 0.33 0.31 0.31 0.32
Note: Marginal effects computed at means for continuous regressors. All estimations include year and sector dummies. Robust standard errors in parentheses. Significance levels: *10%, **5%, *** 1%. Intercept not reported. Froot (1989) correction for firm-level cluster correlation.
0.5023 0.94680.74 0.004015.37
Table 3. Credit access, financial structure and the probability of having trade credit
Pooled probit Pooled probit Pooled probit
Dep. Var: TC/Assets
(a) (b) (c ) (d) (e ) (f)
1 if settled in the capital city -0.059*** -0.072*** -0.056*** -0.057*** -0.059*** -0.072***
(0.021) (0.019) (0.021) (0.018) (0.021) (0.020) Age -0.029** -0.022* -0.030** -0.026** -0.029** -0.021* (0.014) (0.012) (0.013) (0.012) (0.014) (0.012) Sales/Assets -0.003 0.011 0.001 0.030*** -0.003 0.012* (0.004) (0.007) (0.006) (0.010) (0.004) (0.007) (Sales/Assets)² -0.0001* -0.0002*** -0.0001* (0.000) (0.000) (0.000) Stock/Assets 0.043 0.054 0.051 0.087* 0.045 0.061 (0.043) (0.054) (0.040) (0.049) (0.043) (0.053) Receivables/Assets 0.314*** 0.294*** 0.318*** 0.301*** 0.313*** 0.291*** (0.099) (0.091) (0.098) (0.088) (0.099) (0.091) credit access (0 to 4) 0.013*** 0.014*** 0.012*** 0.010** 0.013*** 0.013*** (0.004) (0.004) (0.004) (0.004) (0.004) (0.005) Cash Flow/Assets -0.005 -0.027*** (0.005) (0.007) (Cash Flow/Assets)² 0.0002*** (0.000) Equity/Assets -0.002** -0.018* (0.001) (0.009) (Equity/Assets)² 0.0001* (0.000) Observations 2,269 2,269 2,269 2,269 2,269 2,269 Number of firms 1,127 1,127 1,127 1,127 1,127 1,127 Estimation
R² 0.20GLS-RE0.21 0.20GLS-RE0.22 0.20GLS-RE0.21
Note: All estimations include year and sector dummies. Robust standard errors in parentheses. Significance levels: *10%, **5%, *** 1%. Intercept not reported. Froot (1989) correction for firm-level cluster correlation.
Dep. Var: TC/Assets
(a) (b) (c ) (d) (e ) (f) (g) (h) (i)
1 if settled in the capital city -0.060** -0.060*** -0.070*** -0.072*** -0.070*** -0.067*** -0.064** -0.067*** -0.070*** (0.023) (0.022) (0.021) (0.025) (0.024) (0.021) (0.026) (0.025) (0.021) Age -0.033* -0.034** -0.026* -0.033* -0.033* -0.026** -0.003 -0.002 -0.026* (0.018) (0.017) (0.013) (0.019) (0.018) (0.013) (0.018) (0.018) (0.013) Sales/Assets 0.085*** 0.077*** 0.002 0.114*** 0.107*** 0.007 0.096*** 0.093*** 0.002 (0.018) (0.020) (0.002) (0.020) (0.023) (0.004) (0.016) (0.019) (0.002) Stock/Assets 0.129*** 0.154*** 0.010 0.104** 0.114* 0.013 0.055 0.072 0.010 (0.046) (0.051) (0.011) (0.051) (0.058) (0.011) (0.051) (0.056) (0.011) credit access (0 to 4) 0.013*** 0.012** 0.011** 0.009* 0.008* 0.007* (0.005) (0.005) (0.005) (0.005) (0.004) (0.004) credit access (0 to 1) 0.050*** 0.046** 0.049*** (0.019) (0.020) (0.019) Receivables/Assets 0.270*** 0.301*** 0.246*** 0.272*** 0.172*** 0.203*** (0.054) (0.061) (0.057) (0.064) (0.058) (0.068) Cash Flow/Assets -0.441** -0.561** -0.006 (0.198) (0.261) (0.004) Equity/Assets -0.263*** -0.263*** -0.002*** (0.041) (0.046) (0.001) λ parameter -0.009 -0.006 -0.009 (0.013) (0.015) (0.013) Observations 539 558 2,237 512 534 2,237 515 537 2,237 Number of firms 539 558 1,095 512 534 1,095 515 537 1,095
Estimation 2SLS 2SLS Treatment 2SLS 2SLS Treatment 2SLS 2SLS Treatment
Hansen stat. 1.856 3.088 1.330 1.503 1.279 3.608 p-value 0.603 0.378 0.856 0.472 0.865 0.307 Kleibergen-Paap stat. 60.28 41.74 10.74 5.790 41.31 45.97 Critical value (5%) 12.20 12.20 12.20 12.20 12.20 12.20 Critical value (10%) 7.77 7.77 7.77 7.77 7.77 7.77 Critical value (20%) 5.35 5.35 5.35 5.35 5.35 5.35 Durbin-Wu-Hausman stat. 9.187 5.796 13.588 11.072 13.474 7.607 p-value 0.027 0.122 0.009 0.026 0.009 0.107 R² 0.14 0.14 0.23 0.13 0.12 0.24 0.24 0.25 0.23
Table 5. Credit access, financial structure and the volume of trade credit : endogeneity issues
Robust standard errors in parentheses. All estimations include year and sector dummies. Significance levels: *10%, **5%, ***1%. Intercept not reported. Froot (1989) correction for firm-level cluster correlation. First and second order lagged values of regressors used as instruments in 2SLS specifications in columns (a), (d) and (g); second order lags, a dummy variable for having a short-term credit, a qualitative variable (0 to 4) related to the difficulty induced by the cost of credit and sectoral financial dependence (cf. Rajan and Zingales, 1998) x financial development (private credit/GDP) in columns (b), (e) and (h). Therefore, 2SLS are estimated over a single year and firms' individual effects cannot enter the estimation. Critical values for the weak instruments test based on a 5, 10 and 20% 2SLS bias at the 5% significance level (see Stock and Yogo, 2005).
Dep. Var. Pr(TC/Assets>0) TC/Assets Pr(TC/Assets>0) TC/Assets Pr(TC/Assets>0) TC/Assets Pr(TC/Assets>0) TC/Assets Pr(TC/Assets>0) TC/Assets Pr(TC/Assets>0) TC/Assets (a) (b) (c ) (d) (e ) (f) (g) (h) (i) (j) (k) (l) 1 if settled in the capital city -0.027** -0.078*** -0.027** -0.077*** -0.025* -0.080*** -0.018 -0.074*** -0.045** -0.084*** -0.027** -0.080***
(0.013) (0.021) (0.013) (0.020) (0.013) (0.021) (0.012) (0.019) (0.018) (0.020) (0.013) (0.020) Age 0.014** -0.053*** 0.015** -0.046*** 0.014** -0.052*** 0.013** -0.043*** 0.020*** -0.050*** 0.015** -0.038*** (0.007) (0.015) (0.007) (0.015) (0.006) (0.015) (0.006) (0.015) (0.007) (0.015) (0.007) (0.015) Sales/Assets -0.000 0.011 -0.000 0.041*** 0.001 0.017 0.007*** 0.068*** -0.001 0.011 0.000 0.047*** (0.001) (0.008) (0.001) (0.014) (0.001) (0.014) (0.002) (0.018) (0.001) (0.008) (0.001) (0.014) (Sales/Assets)² -0.000 -0.001*** -0.000*** -0.001*** -0.000 -0.001*** (0.000) (0.000) (0.000) (0.000) (0.000) (0.000) Stock/Assets -0.002 0.132** -0.002 0.119** 0.000 0.137** 0.010 0.151*** 0.003 0.131** 0.002 0.118** (0.006) (0.056) (0.007) (0.056) (0.006) (0.056) (0.007) (0.054) (0.008) (0.056) (0.007) (0.057) Receivables/Assets 0.093*** 0.258*** 0.093*** 0.239*** 0.095*** 0.269*** 0.093*** 0.279*** 0.118*** 0.270*** 0.089*** 0.246*** (0.020) (0.076) (0.020) (0.077) (0.019) (0.076) (0.019) (0.070) (0.021) (0.080) (0.020) (0.080) credit access (0 to 4) 0.006*** 0.009* 0.006*** 0.012** 0.006*** 0.009** 0.005** 0.012** 0.008*** 0.010** 0.005*** 0.011** (0.002) (0.005) (0.002) (0.005) (0.002) (0.005) (0.002) (0.005) (0.002) (0.005) (0.002) (0.005) Cash Flow/Assets -0.002 -0.007 -0.010*** -0.040** (0.001) (0.005) (0.003) (0.015) (Cash Flow/Assets)² 0.000*** 0.000** (0.000) (0.000) Equity/Assets -0.010** -0.015 -0.008** -0.069** (0.004) (0.010) (0.004) (0.027) (Equity/Assets)² 0.000* 0.003** (0.000) (0.002) 1 if exporter 0.044*** 0.044*** 0.043*** 0.043*** 0.057*** 0.046*** (0.010) (0.010) (0.009) (0.009) (0.011) (0.010) Mills Ratio -0.144 -0.098 -0.023 0.374 0.095 0.092 (0.287) (0.286) (0.295) (0.284) (0.336) (0.303) Observations 2,269 2,269 2,269 2,269 2,269 2,269 2,269 2,269 2,269 2,269 2,269 2,269 Number of firms 1,127 1,127 1,127 1,127 1,127 1,127 1,127 1,127 1,127 1,127 1,127 1,127 Estimation Selection variable
Pseudo-R²/R² 0.34 0.20 0.34 0.21 0.34 Export status ("1 if exporter")0.20 0.36 0.23 0.32 0.20 0.35 0.22 Heckman two-step selection model
Table 6. Trade credit, credit access and financial structure: Heckman selection model
Note: Marginal effects computed at means for continuous regressors in selection equations (columns (a), (c), (e), (g), (i) and (k)). All estimations include year and sector dummies. Robust standard errors in parentheses. Significance levels: *10%, **5%, *** 1%. Intercept not reported. Froot (1989) correction for firm-level cluster correlation.