HAL Id: cea-02155309
https://hal-cea.archives-ouvertes.fr/cea-02155309
Submitted on 13 Jun 2019
HAL is a multi-disciplinary open access
archive for the deposit and dissemination of
sci-entific research documents, whether they are
pub-lished or not. The documents may come from
teaching and research institutions in France or
abroad, or from public or private research centers.
L’archive ouverte pluridisciplinaire HAL, est
destinée au dépôt et à la diffusion de documents
scientifiques de niveau recherche, publiés ou non,
émanant des établissements d’enseignement et de
recherche français ou étrangers, des laboratoires
publics ou privés.
New paradigm to assess brain cell morphology by
diffusion-weighted MR spectroscopy in vivo
Marco Palombo, Clémence Ligneul, Chloé Najac, Juliette Le Douce, Julien
Flament, Carole Escartin, Philippe Hantraye, Emmanuel Brouillet, Gilles
Bonvento, Julien Valette
To cite this version:
Marco Palombo, Clémence Ligneul, Chloé Najac, Juliette Le Douce, Julien Flament, et al.. New
paradigm to assess brain cell morphology by diffusion-weighted MR spectroscopy in vivo. Proceedings
of the National Academy of Sciences of the United States of America , National Academy of Sciences,
2016, 113 (24), pp.6671-6676. �10.1073/pnas.1504327113�. �cea-02155309�
New paradigm to assess brain cell morphology by
diffusion-weighted MR spectroscopy in vivo
Marco Palomboa,b,1, Clémence Ligneula,b, Chloé Najaca,b, Juliette Le Doucea,b, Julien Flamenta,c, Carole Escartina,b, Philippe Hantrayea,b,c, Emmanuel Brouilleta,b, Gilles Bonventoa,b, and Julien Valettea,b,1
aMIRCen, Institut d’Imagerie Biomédicale, Direction de la Recherche Fondamentale, Commissariat à l’Energie Atomique et aux Energies Alternatives,
F-92260 Fontenay-aux-Roses, France;bUnité Mixte de Recherche (UMR) 9199 (Neurodegenerative Diseases Laboratory), Université Paris-Sud, Université
Paris-Saclay, CNRS, F-92260 Fontenay-aux-Roses, France; andcUnité Mixte de Service (UMS) 27, INSERM, F-92260 Fontenay-aux-Roses, France
Edited by Kamil Ugurbil, University of Minnesota, Minneapolis, MN, and accepted by Editorial Board Member Leslie G. Ungerleider April 27, 2016 (received for review March 5, 2015)
The brain is one of the most complex organs, and tools are lacking to assess its cellular morphology in vivo. Here we combine original diffusion-weighted magnetic resonance (MR) spectroscopy acquisition and novel modeling strategies to explore the possibility of quantify-ing brain cell morphology noninvasively. First, the diffusion of cell-specific metabolites is measured at ultra-long diffusion times in the rodent and primate brain in vivo to observe how cell long-range morphology constrains metabolite diffusion. Massive simulations of particles diffusing in synthetic cells parameterized by morphometric statistics are then iterated to fit experimental data. This method yields synthetic cells (tentatively neurons and astrocytes) that ex-hibit striking qualitative and quantitative similarities with histol-ogy (e.g., using Sholl analysis). With our approach, we measure major interspecies difference regarding astrocytes, whereas den-dritic organization appears better conserved throughout species. This work suggests that the time dependence of metabolite diffu-sion coefficient allows distinguishing and quantitatively character-izing brain cell morphologies noninvasively.
cell morphology
|
noninvasive histology|
diffusion-weighted NMR spectroscopy|
numerical simulations|
metabolitesT
he brain is one of the most complex organs, and it has defined an inexhaustible field of research over the last centuries. Un-fortunately, brain’s complexity is paralleled by the difficulty in ex-amining it noninvasively. Some fundamental questions regarding morphological modifications of neurons and astrocytes along brain development, aging, or disease, as well as interspecies differences, can only be investigated postmortem using histology, the current gold standard to study cellular morphology. The de-velopment of a noninvasive neuroimaging tool to evaluate and monitor brain cell morphology under normal and pathological conditions in vivo would thus represent a major breakthrough.MRI and magnetic resonance spectroscopy (MRS) techniques have opened new doors for examining brain tissues in vivo at both meso- and macroscales. Diffusion-weighted (DW)-MRI and -MRS, which allow the investigation of the diffusion process of endogenous molecules in biological tissues at these scales (1), have made it clear that cell architecture has a critical influence on molecular displace-ment (2–5). To quantitatively evaluate the impact of cell structure on measured molecular diffusion, mainly two modeling strategies have been developed. The first approach consists in performing numerical simulations of many particles diffusing in arbitrary geometries (e.g., defined by 3D meshes) mimicking“realistic” cell architectures (6–9). Because these realistic geometries are generally built directly from microscopy data rather than being described and generated by a (small) set of parameters, and because simulations are extremely computationally demanding, this approach does not seem adapted to fit experimental data. The second approach consists in simplifying cell architectures to basic geometries (such as spheres, cylinders, or pores) for which analytical solutions describing diffusion generally exist (10). The main advantages of this simplification are the computing speed associated with analytical expressions and the
fact that the geometry can be described by a small number of parameters. This strategy is the basis for recent quantitative DW-MRI strategies (AxCaliber, ActivAx, NODDI, etc.) (11–13) to estimate relevant structural quantities based on water diffusion in the brain, essentially axonal diameter, density, and angular dis-persion. However, it clearly does not capture the complexity of cellular architectures that exist in living tissues, such as the brain.
In the present work, we introduce a strategy to noninvasively assess cellular morphology, where the better of the two afore-mentioned modeling approaches is merged using advanced computational techniques and used to analyze experimental data acquired with an original DW-MRS paradigm. For the first time, to our knowledge, the diffusion of cell-specific metabolites is investigated at ultra-long diffusion times (up to 2 s) in the healthy rodent and primate brain by DW-MRS in vivo, to spe-cifically probe the intracellular compartment at increasing spatial scales as the diffusion time is increased. Then, massive Monte Carlo simulations of particles diffusing in many synthetic cells, parameterized by a small set of morphometric statistics allowing the generation of complex and heterogeneous morphologies, are run on graphics processing unit (GPU) and iterated to fit DW-MRS data (a scheme of the simulation-fitting pipeline is reported in Fig. 1). This approach ultimately yields synthetic cellular compartments (tentatively neurons and astrocytes) that
Significance
Characterizing the microstructure of an organ noninvasively using molecular diffusion measurements represents a major challenge in medical imaging and life science. In this work, we propose con-cepts in diffusion magnetic resonance to noninvasively extract morphological properties of brain cells that are out of reach of existing neuroimaging techniques, such as diffusion-weighted MRI. We show how long-range morphology of neurons and astro-cytes can affect the diffusion of cell-specific metabolites at ultra-long diffusion times and that adequate modeling strategy seems to allow extracting morphological parameters such as astrocytic and neuronal process length and complexity, opening the way to non-invasive histology of the brain. We believe that the concepts and methods introduced here may represent a significant breakthrough in neuroimaging and neurosciences.
Author contributions: J.V. designed research; M.P., C.L., C.N., J.L.D., J.F., G.B., and J.V. performed research; M.P., C.L., C.N., J.L.D., J.F., and J.V. analyzed data; and M.P., C.E., P.H., E.B., G.B., and J.V. wrote the paper.
The authors declare no conflict of interest.
This article is a PNAS Direct Submission. K.U. is a guest editor invited by the Editorial Board.
Freely available online through the PNAS open access option.
1To whom correspondence may be addressed. Email: marco.palombo@cea.fr or julien.
valette@cea.fr.
This article contains supporting information online atwww.pnas.org/lookup/suppl/doi:10. 1073/pnas.1504327113/-/DCSupplemental. BIOPHYSICS AND COMPUTATION AL BIOLOGY
can be examined and compared qualitatively and quantitatively with conventional histology.
Results
Brain Metabolite Diffusion at Long Time Scales. The rationale for using DW-MRS is that brain metabolites are almost exclusively confined into the intracellular space, so that modeling their diffusion is more direct and requires fewer assumptions compared with water diffusion observed by DW-MRI. In addition, some metabolites are thought to have a preferential cellular compartmentation: N-acetyl-aspartate (NAA) and the neurotransmitter glutamate (Glu) have been reported to reside essentially in neurons (14–16), whereas it is often accepted, although sometimes questioned, that myo-inositol (Ins) and choline compounds (tCho) are preferentially compart-mentalized in glial cells (17), especially in astrocytes (14, 18) (the dominant glial cell type, representing at least half the total glial volume) (19). The total creatine (tCr) pool is generally considered to be evenly distributed between astrocytes and neurons. In this con-text, DW-MRS offers a unique noninvasive tool to specifically probe each of these cellular compartments and to link the cellular archi-tecture with the macroscopic signal being measured and vice versa. Here we decided to elaborate on our recent finding that metabolite diffusion measured at long diffusion times td(up to∼1 s) is fairly
stable in the monkey (20) and in the human brain (21), suggesting that metabolites are not significantly confined in subcellular re-gions or organelles but are instead diffusing in the long fibers typical of neuron and astrocyte morphology. However, because axons, dendrites, and astrocytic processes are not infinite, metabolites should start experiencing long-range structure as td keeps
increasing. They will have the possibility to explore the different ramifying branches, so that their apparent diffusion coefficient (ADC) should exhibit sensitivity to ramifications. They will also experience restriction at the extremity of the fibers, making their ADC depend on cell fiber length. In this work, we therefore pushed the limits of ultra-long tdacquisitions by measuring metabolite ADC
up to 2 s in the mouse and in the macaque brain, using pulsed field gradient-stimulated echo acquisitions (Materials and Methods andSI Appendix, Section I). Typical spectra at the longest tdand ADC as a
function of tdare displayed in Fig. 2 (SI Appendix, Table S1).
Re-sults show that ADC tends to slowly decrease as td is increased,
consistent with the existence of long-range constraints imposed by cell morphology.
Intracellular Diffusion Models.We then developed a model of cell morphology to account for these long-range constraints while neglecting short-range cellular features. This simplification is possible because short-range features do not induce temporal dependency of the ADC at long td. For example, restriction
imposed in the plane perpendicular to fiber’s axis results in a negligible displacement compared with the displacement along fibers (d2<< 2D
intratd, where d is the fiber diameter, typically a
few micrometers, and Dintra is the free intracellular diffusion
coefficient that can be estimated to∼0.5 μm2/ms) (22). Similarly,
the hindrance due to organelles or dendritic spines is simply averaged out at long td, and results in an effective tortuosity that
can be incorporated into Dintra (23). In the end, fibers can be
essentially treated as monodimensional objects“embedded” in a 3D space (24). We decided to describe long-range cellular ar-chitecture by only three morphometric statistics (each defined by a mean and SD) accounting for the characteristic “tree-like” structure of neurons and astrocytes: the number of processes Nproc leaving the soma (e.g., the dendrites or astrocytic
pro-cesses), the number of successive embranchments (bifurcations) Nbranchalong each process, and the segment length Lsegment(in
micrometers) for a given segment of process comprised between two successive branching points. For each of these statistics, a Gaussian distribution was assumed, with SDs SDNproc, SDNbranch,
and SDLsegment. They are exemplified in Fig. 1A.
In vivo DW-MRS signal arises from a coarse-grained average within various cellular structures. For any given set of morphometric statistics values, a large set of different synthetic cells following these statistics can be generated (SI Appendix, Section II). Molecular dif-fusion of many particles in each cell is then simulated according to a Monte Carlo algorithm. The corresponding diffusion-weighted sig-nals arising from each cell are computed using the phase accumu-lation approach and then summed over the whole set of cells to obtain the coarse-grained averaged ADC, which can be compared with experimental metabolite ADC (Materials and Methods andSI Appendix, Section III). The driving idea is to iteratively change the morphometric statistics values, generate many synthetic cells ac-cordingly, and simulate particle diffusion in these cells to compute the corresponding ADC, until the difference between simulated and measured ADC satisfies some convergence criteria (Fig. 1). The entire simulation pipeline was implemented on graphics processing units (GPUs), taking advantage of the parallelizable nature of par-ticles diffusion. In this work, we considered five parameters to be fitted for each measured metabolite: Dintra, Lsegment, SDLsegment,
Nbranch, and SDNbranch. The process number statistics was found to
have no impact on measured ADC (at least with the current ac-quisition scheme) and was arbitrarily fixed to 10± 5 (SI Appendix, Section IV). Stability of the fit relative to noise was assessed by a Monte Carlo procedure and found to be good, yielding satisfying accuracy and precision despite experimental noise (bias and relative SD less than 5% for all parameters;SI Appendix, Section V). Im-portantly, this shows that fitting the five aforementioned parameters using six experimental data points for each metabolite is feasible under the present conditions.
Fig. 1. Scheme of the simulation-fitting pipeline proposed. (A) The set of parameters describing cellular morphometric statistics is initialized. (B) Many synthetic cells are generated according to the morphometric statistics in A and the intracellular diffusion of many particles, corresponding diffusion-weighted signal, and relative ADC are simulated. (C) If the difference be-tween simulated and measured ADC satisfies the selected convergence criteria, the pipeline provides the best fitting morphometric statistics, otherwise steps A, B, and C are iteratively repeated, adjusting the morphometric statistics to fit experimental data.
Classifying Cellular Compartments According to Metabolite Diffusion: Neurons vs. Astrocytes.The morphometric statistics resulting from the best fit of experimental ADC (averaged over cohorts) for all five metabolites in the two species are reported in Table 1. Some syn-thetic cells corresponding to the best fits are reported in Fig. 2. In this initial work, we used exactly the same model to generate the synthetic cells associated with each metabolite, because we did not want to associate metabolites with a specific cellular compartment a priori. For example, we did not introduce additional long axons that could be relevant for neuronal Glu and NAA. The rationale is that we wanted to assess the ability of our strategy to differentiate between astrocytic and neuronal metabolites based on their diffu-sion properties only, without differences imposed by different models. In this context, it is striking that the cellular compartments extracted for all five metabolites match the presumed cell-specific compartmentation: Ins and tCho, which are often thought to be mainly in astrocytes, are indeed associated with the smallest synthetic cells, whereas Glu and NAA, which are mainly in neurons, are associated with the largest synthetic cells. Within each animal species, astrocytic and neuronal metabolites are discriminated according to the Lsegment statistics for both species (SI Appendix, Section IV and Tables S3 and S4 for statistical significances). Cellular compartments associated with astrocytic metabolites are also less complex (i.e., their processes exhibit a lower degree of ramification, as quantified by Nbranch) than the ones associated with
neuronal metabolites (although not significantly in the monkey brain). In parallel, tCr, which is considered to be evenly distributed between neurons and astrocytes, is associated with a compartment of intermediate segment length (Lsegment) and total process length
(Lsegment× Nbranch). The larger cellular heterogeneity of tCr is also
confirmed by the larger SD of morphometric statistics compared with astrocytic or neuronal metabolites (in particular SDLsegment,
which is approximately doubled), further supporting the ability of our strategy to assign consistent cellular compartmentation to each of the observed metabolites. Note that in the mouse brain the ADC of taurine (Tau), in addition to the other five metabolites, could also be measured due to its high abundance. Like tCr, Tau exhibits no preferential cellular compartmentation in the brain. As a matter of fact, the morphometric statistics extracted for Tau compartment are almost exactly identical to those extracted for tCr (including the large SDLsegment), demonstrating again the self-consistency of
our method.
Diffusion Modeling vs. Conventional Histology: The Example of Sholl Analysis on Mouse Astrocytes. Using our approach, it becomes possible to generate synthetic tissues that can be compared with actual tissues studied through conventional histological methods. Fig. 3A shows a collection of real (hippocampal) astrocytes stained by GFAP in a 40-μm-thick slice from the mouse brain. Fig. 3B represents synthetic astrocytes in the mouse, respectively, in a 40-μm-thick “virtual” slice, generated from the Ins and tCho compartments that here we assume to be mainly astrocytic. Qualitatively, the similarity between images obtained from both techniques is striking. Generation of virtual slices also allows the quantitative analysis of synthetic cells reconstructed from diffusion not only based on the model parameters, but also using tools available for conventional histology, such as Sholl analysis (25) (at least for Sholl parameters that do not depend on the number of processes or can be normalized by it, because our modeling approach does not allow extracting the process number sta-tistics). Specifically, four Sholl morphometric descriptors were considered: the Schoenen ramification index (26); the enclosing radius (i.e., the largest of intersecting radii, which are the num-ber of sampling radii intersecting the arbor at least once); the normalized critical value (the maximum value of sampled in-tersections normalized by the number of processes, reflecting the highest number of branches in the arbor normalized by the number of processes); and the critical radius (the distance at
Fig. 2. DW-MRS results and modeling in the mouse and macaque brain. The investigated volume of interest within the brain (green box) and a typical DW-MRS spectrum at td= 2 s (here without diffusion weighting), as used to
measure ADC time dependence for each metabolite (Inset plots), are shown for each species. Points and error bars stand for ADC means and SEMs, re-spectively, estimated among the cohorts. Best fit of ADC (averaged over the cohorts) is also displayed as a continuous curve. A subset of the extracted synthetic cells for each metabolite is also reported. (Scale bar, 100μm.)
BIOPHYSICS
AND
COMPUTATION
AL
which critical value occurs). Results of Sholl analysis performed on mouse hippocampal astrocytes using conventional histology, and on synthetic astrocytes generated from the Ins and tCho dif-fusion compartments in the mouse brain, are reported in Table 2 andSI Appendix, Fig. S9. In our opinion, the very good agreement between Sholl analysis on synthetic and real astrocytes firmly supports the notion that most of Ins and tCho signal indeed comes from astrocytes and provides a strong argument in fa-vor of the validity of our experimental and modeling strate-gies. Note that in this work we focused on mouse astrocytes because they represent a relatively homogenous population (compared with neurons), and in the mouse brain their domains do not overlap, facilitating Sholl analysis.
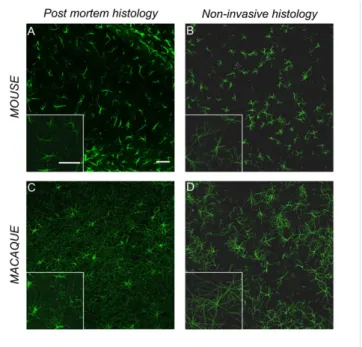
Measuring Cell-Specific Interspecies Difference: Rodents vs. Primates.
Fig. 3 B and D represent a collection of synthetic astrocytes in the mouse and macaque brain, respectively, generated from the Ins and tCho compartments. In Fig. 3 A and C, a conventional GFAP staining of astrocytes in the mouse and macaque brain is displayed for comparison. The increased size and complexity of primate as-trocytes compared with those in mice can be visually assessed. Quantitatively, morphological statistics obtained here from synthetic astrocytes are consistent with the most recent knowledge about as-trocytes in rodents and primates (27, 28); in particular, we find that the overall diameter of synthetic astrocytes is 2.52± 0.10 times larger in macaques than in mice, in good agreement with the 2.55± 0.05 ratio obtained from direct histological quantification (human vs. mouse) (28). Statistical significance of interspecies comparisons is given in detail inSI Appendix, Table S5. Although it is difficult to obtain reference values about the morphometric characteristics of neurons at the scale of the whole DW-MRS volume of interest, the synthetic neurons are reminiscent of iconic images of Golgi-stained neurons. Their size (∼500 μm overall diameter) agrees well with the typical extension of the dendritic tree described for pyramidal neu-rons, granule cells, striatal interneuneu-rons, or medium spiny neurons. Unlike for astrocytes, the literature does not report dramatic in-terspecies difference regarding neurons (apart from the apical den-drites of pyramidal neurons, which are significantly longer in primates, but our simulations show that this kind of very long fibers does not affect the morphometric statistics extracted by our method and might instead explain the higher Dintrain the monkey brain;SI Appendix, Section VII). However, it has been reported that primate neurons tend to exhibit larger size and complexity than their rodent counterparts in some structures, such as the hippocampus (29), and
also greater heterogeneity (30). Our work supports these findings at the scale of the investigated volume of interest: we extract relatively similar structural characteristics for neurons in mice and primates, despite a small (and not significant most of the time;SI Appendix, Table S5) tendency for larger size and complexity (Lsegment and
Nbranch) and greater heterogeneity (SDLsegmentand SDNbranch)
in primates. Discussion
In this work, we introduced the use of Monte Carlo simulation to calculate diffusion-weighted signal of intracellular particles in many
Table 1. Estimated morphometric parameters
Metabolite Nbranch SDNbranch Lsegment(μm) SDLsegment(μm) Dintra(μm2/ms)
Mouse Ins (A) 3.3 (±0.1) 2.2 (±0.2) 23.8 (±0.3) 11.1 (±1.0) 0.386 (±0.003) tCho (A) 2.6 (±0.1) 2.1 (±0.1) 16.3 (±0.1) 8.5 (±0.3) 0.344 (±0.003) tCr (A+N) 3.4 (±0.2) 2.4 (±0.1) 45.4 (±0.3) 17.8 (±0.9) 0.404 (±0.002) Tau (A+N) 3.4 (±0.2) 2.3 (±0.6) 45.9 (±0.4) 15.0 (±0.9) 0.440 (±0.003) NAA (N) 4.0 (±0.2) 2.2 (±0.2) 60.4 (±0.3) 4.8 (±0.6) 0.306 (±0.001) Glu (N) 4.5 (±0.1) 2.1 (±0.4) 60.5 (±0.2) 8.1 (±0.7) 0.421 (±0.003) Macaque Ins (A) 4.0 (±0.1) 2.4 (±0.2) 39.7 (±0.2) 7.1 (±0.6) 0.393 (±0.001) tCho (A) 4.2 (±0.1) 2.3 (±0.2) 37.5 (±0.1) 5.7 (±1.0) 0.370 (±0.001) tCr (A+N) 4.7 (±0.6) 2.5 (±0.5) 56.0 (±7.4) 16.0 (±2.8) 0.467 (±0.072) NAA (N) 4.6 (±0.2) 1.8 (±0.3) 64.6 (±0.4) 7.1 (±0.7) 0.454 (±0.002) Glu (N) 4.5 (±0.3) 2.4 (±0.4) 60.0 (±0.4) 7.6 (±0.5) 0.476 (±0.002) Morphometric parameters estimated for the metabolite compartments by fitting the ADC time dependency in the mouse and macaque brain. Metabolites thought to be preferentially compartmentalized in astrocytes are indicated by the letter A, those thought to be preferentially compartmentalized in neurons are indicated by the letter N, and those thought to be evenly mixed are indicated by A+N. Taurine could only be measured in the mouse brain, because of its higher abundance.±Error in parentheses represents the SD on the fitted parameters (SI Appendix, Section VI, including P value calculation).
Fig. 3. Conventional vs. noninvasive histology. Comparison between conven-tional histological images of astrocytes and the corresponding synthetic tissue in the mouse and macaque brain. Confocal microscopy images by GFAP staining of astrocytes in the hippocampus of the mouse brain (A) and of the macaque brain (C). Collection of synthetic astrocytes extracted from Ins and tCho compartments in the mouse brain (B) and in the macaque brain (D). (Scale bars, 50μm.) Corner Insets are a 1.5× magnification of a portion of the main image.
complex and heterogeneous synthetic cells generated randomly according to defined morphometric statistics, allowing the fitting of experimental DW-MRS data. To our knowledge, this is the first time such a paradigm is proposed. Monte Carlo simulations have been proposed in the past to fit simulated (31) or experimental data (32), but consisted in diffusion in determinist axonal geometries. Note that, in these two previous studies (31, 32), diffusion signal was precalculated for different parameter values to create a dictionary that could then be compared with experimental data. Although the generation of the dictionary requires a very large computational time, data fitting is then extremely fast, which is interesting for stabilized acquisition/modeling pipelines used routinely. Dictionary-based fitting could be done in the future for the modeling strategy proposed here, although the increasing power of GPU may mitigate the practical interest of such precalculation.
Starting from a unique model and without a priori constraints on cell morphology, the simulation-fitting pipeline analyzed long-td
diffusion data and consistently classified cellular compartments, strongly supporting the generally accepted (but sometimes debated) preferential compartmentation of Ins and tCho inside astrocytes and of Glu and NAA in neurons, whereas some other metabolites such as tCr and Tau seem to have no preferential compartmentation. In addition, extracted cell morphologies were qualitatively and quanti-tatively consistent with histological data, which strongly supports the idea that modeling metabolite diffusion based solely on the long-range structural properties used here is essentially valid. Further-more, the Sholl analysis on astrocytes provides solid arguments in favor of a marked astrocytic specificity of Ins and tCho. Finally, our strategy allowed the assessment of relevant interspecies differences in astrocytic structure, providing additional arguments in favor of our strategy and its underlying assumptions and demonstrating the translational nature of the approach.
As far as we can see, the methods proposed here are the first steps of a new paradigm for DW-MRS acquisition and modeling, which will stimulate future works, including methodological improvements and developments, as well as further validation (e.g., by more ex-haustive comparison with microscopy data). For the interpreta-tion of our results, in particular for comparison with histology, we considered a strict cell specificity of metabolites: i.e., Ins and tCho purely reflecting astrocytic properties and Glu and NAA purely reflecting neuronal properties. Although we show here that this assumption already gives very consistent results, the estimation of astrocytic and neuronal morphology might be im-proved in the future by knowing a priori what fraction of Ins and tCho is actually in neurons and what fraction of Glu and NAA is in astrocytes. As discussed above, in this initial work, we de-cided to model neurons and astrocytes using the same morphom-etric descriptors, but the high flexibility of our approach is perfectly compatible with refining the model by including cell-specific morphometric statistics, such as axonal length or neuronal asym-metry, or by using context-aware modeling of cells morphologies (33). Quantifying these additional long-range morphometric pa-rameters would certainly benefit from acquisitions at longer td,
but the methodological challenge remains open, as signal loss due to relaxation makes measurements at longer td extremely
difficult. Acquisitions at ultra-short td would allow the
in-dependent determination of Dintra or the introduction of
ad-ditional free parameters describing short-range morphological features (e.g., fiber diameter and spine density). Generally speaking, a great advantage of our modeling strategy is that it can be adapted to available experimental data, whose amount and quality is expected to keep increasing in the future, con-sidering the continuous improvement of magnetic resonance technology.
In conclusion, beyond the conceptual insights about intracellular diffusion at long diffusion times and metabolite compartmentation, the possibility to quantitatively estimate brain cell morphology using the “noninvasive histology” method as suggested and introduced here lays the ground for future methodological research and many potential applications. The translational nature of the method may have a great impact in the study and management of brain diseases, e.g., to monitor neuronal atrophy in neurodegenerative diseases or hypertrophic activated astrocytes in neuro-inflammation. In this context, the strategy proposed here might find applications in pre-clinical and pre-clinical research, in particular to evaluate treatment ef-ficacy at a cellular level.
Materials and Methods
Metabolite Diffusion at Ultra-Long Diffusion Times Measured by DW-MRS. All animal studies were conducted according to the French regulation (directive 2010/ 63/EU; French Act Rural Code R 214-87 to 131). The animal facility was approved by veterinarian inspectors (authorization #B 92-032-02) and complies with Standards for Humane Care and Use of Laboratory Animals of the Office of Laboratory Animal Welfare (OLAW; #A5826-01). All experimental procedures were approved by the local Ethics Committee (committee #44; approval #10-057). Primate experi-ments were performed on healthy male macaque monkeys (Macaca fascicularis, body weight 4–6 kg) anesthetized with propofol, using a 7-T MRI scanner (Agi-lent). The animals were held in the sphinx position, and the head was positioned in a stereotaxic frame with a bite-bar and ear rods and maintained at 37 °C by warm air. A1H quadrature surface coil was used for radiofrequency emission
and reception. An 18-× 18- × 18-mm3(5.8-mL) voxel was positioned in the
region of interest. The methodology used is exactly the same as described in our recent work in the primate brain (20), i.e., spectra were acquired with a diffusion contrastΔb = 3,000 s/mm2using a STEAM (stimulated echo
ac-quisition mode) sequence modified for diffusion weighting, and td was
changed by changing the mixing time. Rodent experiments were performed on healthy C57/BL6 male mice (body weight∼ 30 g) anesthetized at low iso-flurane dose (<1.5%), using an 11.7-T MRI scanner (Bruker BioSpec). The animals were positioned in a stereotaxic frame with a bite-bar and ear rods and maintained at 37 °C by circulation of warm water. Radiofrequency transmission and reception was achieved using a quadrature surface cryo-probe, and acquisitions were performed in a 5-× 2.4- × 6-mm3(72-μL) voxel.
A DW-MRS approach comparable to that described above for the monkey was used. Metabolite signal was quantified using LCModel (34). Additional details about experiments and postprocessing can be found inSI Appendix, Section I.
Simulating and Fitting Metabolite ADC by Monte Carlo Simulations in Synthetic Cells. To simulate the ADC as a function of tdfor a given set of values of the
morphometric statistics, 80 different cell-graphs for each metabolite were gen-erated (SI Appendix, Section II). Diffusion of n= 2,000 particles in each cell was simulated according to a Monte Carlo algorithm (9). The corresponding diffusion-weighted signals arising from each cell were computed by using the phase ac-cumulation approach (9) and then summed over the whole set of cell graphs to obtain the coarse-grained averaged ADC (SI Appendix, Section III). All codes were implemented in Matlab (The Mathworks). An important assumption of our model is that metabolites remain in a given cell during td, i.e., intercellular exchanges are
negligible. We think this assumption of clear metabolic compartmentation is valid at the time scale of diffusion measurement: for example, the glutamate-gluta-mine cycle, which is a major metabolic pathway between neurons and astrocytes, is estimated in the range 0.2–0.5 μmol/g per minute based on13C MRS studies (35),
so that less than 0.1% of the glutamate pool (∼10 μmol/g) is transferred from neurons to astrocytes every second.
To fit experimental ADC as a function of td, it is necessary to iteratively change
the set of parameters describing the morphometric statistics used for cell graph generation and then simulate particles diffusion and compute corresponding ADC, until the difference between simulated and measured ADC satisfies some Table 2. Estimated Sholl-based metrics
Sholl-based metrics Stained astrocytes Synthetic astrocytes Ramification index 2.96 (±0.72) 2.66 (±0.64) Enclosing radius (μm) 15.3 (±2.8) 22.5 (±5.1) Normalized critical value 2.61 (±0.75) 2.24 (±0.73) Critical radius (μm) 6.7 (±1.8) 5.7 (±1.3)
Results of Sholl analysis performed on mouse GFAP-stained hippocampal astrocytes using conventional histology and on synthetic astrocytes gener-ated from the mouse Ins and tCho diffusion compartments.±Error in paren-theses represents the SD (estimated on 135 cells).
BIOPHYSICS
AND
COMPUTATION
AL
convergence criteria. The fitting procedure was based on the minimization of the sum of square residuals by using an efficient and stable algorithm based on combined Parallel Tempering and Levenberg–Marquardt approaches. The Parallel Tempering method was used for the unsupervised initialization of the fitting parameters. Then, starting from these initial values, the Levenberg–Marquardt algorithm was used to quickly converge toward the set of parameters which better describe experimental data. The average number of total iterations re-quired to satisfy the convergence criteria ranged from 20 to 100 (with 80 cell graphs generated at each iteration). The resulting simulation-fitting complexity was then∼1011. An efficient code was implemented in Matlab to manage in
parallel on a GPU device (NVIDIA Tesla K20c) this huge amount of computation. Because of this approach, it was possible to fit experimental ADC in less than 3 min for each metabolite. To obtain very stable results with respect to Monte Carlo simulation fluctuations, we repeated each simulation fitting 20 times (the SD of the simulated ADC was then∼2%), taking the average parameter value over the 20 repetitions as the most likely value. The whole procedure required about 1 h for each metabolite. The resulting outputs are reported in Table 1. Synthetic Tissue Generation and Comparison with a Real Histological Slice. Once the morphometric parameters were estimated for each metabolite com-partment, it was possible to generate synthetic tissues directly comparable with conventional histology, by representing together the corresponding cell graphs in a realistic manner. Here we consider Ins and tCho compartments to obtain a synthetic tissue representative of astrocytes and directly comparable with tissues stained for GFAP observed by confocal microscopy. A large number of cell graphs were generated according to the morphometric statistics for Ins and tCho compartments for both mouse and macaque. Then, only the cell graphs inter-secting a slice with the same thickness as the histological section (40μm) were considered for the direct comparison with the histological ones reported in Fig. 3. Further details are available inSI Appendix, Section VIII.
Histology and Confocal Microscopy. Coronal brain sections (30–40 μm) fixed with 4% (wt/vol) paraformaldehyde were cut on a freezing microtome. Sections were blocked with 4.5% normal goat serum (Sigma-Aldrich), incu-bated with GFAP-Cy3 (1:1,000, mouse clone GA-5; Sigma-Aldrich) for 24 h at 4 °C and mounted using FluorSave reagent (Calbiochem). Sections were analyzed using a confocal microscope (SP8 X; Leica) equipped with a white light laser source and 20× (HC PL APO 20×/0.70 CS) and 40× (HC PL APO 40×/1.30 Oil CS2) objectives. Images were acquired at 1,024 × 1,024 resolu-tion with a pixel size of 0.568 (20×) or 0.189 μm (40× with 1.5 zoom). Sholl Analysis. We performed Sholl analysis (25) directly from bitmap images by using the Fiji toolbox integrated in ImageJ (imagej.net/Sholl). The plug-in pairs an improved algorithm to retrieve data from bitmap images with curve fitting, regression analysis, and statistical inference so that an automatic estimation of Sholl-based metrics of arborization is possible (36). An example of the Sholl-based analysis is reported inSI Appendix, Fig. S9 A and B. Histological slices from three different healthy mice were used to perform Sholl analysis of the hippocampal GFAP-stained astrocytes. Three histological slices per animal were investigated, taking into account 15 cells per slice. A total of 135 cells were thus taken into account to estimate the mean and SD of the Sholl-based metrics reported in Table 2 andSI Appendix, Fig. S9C, for both conventional histology and synthetic astrocytes. Parameters depending on the number of processes were normalized by it (because our diffusion data and modeling do not allow extracting this number).
ACKNOWLEDGMENTS. We thank Aurélie Berniard for help with immunofluo-rescent staining and Martine Guillermier, Diane Houitte, and Romina Aron-Badin for help with the primate experiments. This work was supported by the European Research Council (Grant 336331). The 11.7-T MRI scanner was funded by a grant from“Investissement d’Avenir–ANR-11-INBS-0011” NeurATRIS: A Translational Research Infrastructure for Biotherapies in Neurosciences.
1. Basser PJ, Mattiello J, LeBihan D (1994) MR diffusion tensor spectroscopy and imag-ing. Biophys J 66(1):259–267.
2. Beaulieu C (2002) The basis of anisotropic water diffusion in the nervous system: A technical review. NMR Biomed 15(7-8):435–455.
3. Basser PJ, Pierpaoli C (2011) Microstructural and physiological features of tissues elucidated by quantitative-diffusion-tensor MRI. 1996. J Magn Reson 213(2):560–570. 4. Wedeen VJ, et al. (2012) The geometric structure of the brain fiber pathways. Science
335(6076):1628–1634.
5. Norris DG (2001) The effects of microscopic tissue parameters on the diffusion weighted magnetic resonance imaging experiment. NMR Biomed 14(2):77–93. 6. Chin CL, Wehrli FW, Hwang SN, Takahashi M, Hackney DB (2002) Biexponential
dif-fusion attenuation in the rat spinal cord: Computer simulations based on anatomic images of axonal architecture. Magn Reson Med 47(3):455–460.
7. Yeh CH, et al. (2013) Diffusion microscopist simulator: A general Monte Carlo simu-lation system for diffusion magnetic resonance imaging. PLoS One 8(10):e76626. 8. Li JR, et al. (2014) Numerical study of a macroscopic finite pulse model of the diffusion
MRI signal. J Magn Reson 248:54–65.
9. Hall MG, Alexander DC (2009) Convergence and parameter choice for Monte-Carlo simulations of diffusion MRI. IEEE Trans Med Imaging 28(9):1354–1364.
10. Grebenkov DS (2007) NMR survey of reflected Brownian motion. Rev Mod Phys 79(3): 1077–1137.
11. Assaf Y, Blumenfeld-Katzir T, Yovel Y, Basser PJ (2008) AxCaliber: A method for measuring axon diameter distribution from diffusion MRI. Magn Reson Med 59(6): 1347–1354.
12. Alexander DC, et al. (2010) Orientationally invariant indices of axon diameter and density from diffusion MRI. Neuroimage 52(4):1374–1389.
13. Zhang H, Schneider T, Wheeler-Kingshott CA, Alexander DC (2012) NODDI: Practical in vivo neurite orientation dispersion and density imaging of the human brain. Neuroimage 61(4):1000–1016.
14. Gill SS, et al. (1989) Brain metabolites as 1H NMR markers of neuronal and glial dis-orders. NMR Biomed 2(5-6):196–200.
15. Simmons ML, Frondoza CG, Coyle JT (1991) Immunocytochemical localization of N-acetyl-aspartate with monoclonal antibodies. Neuroscience 45(1):37–45. 16. Petroff OA, Pleban L, Prichard JW (1993) Metabolic assessment of a neuron-enriched
fraction of rat cerebrum using high-resolution 1H and 13C NMR spectroscopy. Magn Reson Med 30(5):559–567.
17. Choi JK, Dedeoglu A, Jenkins BG (2007) Application of MRS to mouse models of neurodegenerative illness. NMR Biomed 20(3):216–237.
18. Brand A, Richter-Landsberg C, Leibfritz D (1993) Multinuclear NMR studies on the energy metabolism of glial and neuronal cells. Dev Neurosci 15(3-5):289–298. 19. Mangia S, et al. (2011) Response to‘comment on recent modeling studies of
astro-cyte-neuron metabolic interactions’: Much ado about nothing. J Cereb Blood Flow Metab 31(6):1346–1353.
20. Najac C, et al. (2014) Intracellular metabolites in the primate brain are primarily localized in long fibers rather than in cell bodies, as shown by diffusion-weighted magnetic resonance spectroscopy. Neuroimage 90:374–380.
21. Najac C, Branzoli F, Ronen I, Valette J (2016) Brain intracellular metabolites are freely diffusing along cell fibers in grey and white matter, as measured by diffusion-weighted MR spectroscopy in the human brain at 7 T. Brain Struct Funct 221(3): 1245–1254.
22. Marchadour C, Brouillet E, Hantraye P, Lebon V, Valette J (2012) Anomalous diffusion of brain metabolites evidenced by diffusion-weighted magnetic resonance spectroscopy in vivo. J Cereb Blood Flow Metab 32(12):2153–2160.
23. Santamaria F, Wils S, De Schutter E, Augustine GJ (2006) Anomalous diffusion in Purkinje cell dendrites caused by spines. Neuron 52(4):635–648.
24. Van Nguyen D, Grebenkov D, Le Bihan D, Li JR (2015) Numerical study of a cylinder model of the diffusion MRI signal for neuronal dendrite trees. J Magn Reson 252: 103–113.
25. Sholl DA (1953) Dendritic organization in the neurons of the visual and motor cortices of the cat. J Anat 87(4):387–406.
26. Schoenen J (1982) The dendritic organization of the human spinal cord: The dorsal horn. Neuroscience 7(9):2057–2087.
27. Oberheim NA, Wang X, Goldman S, Nedergaard M (2006) Astrocytic complexity dis-tinguishes the human brain. Trends Neurosci 29(10):547–553.
28. Oberheim NA, et al. (2009) Uniquely hominid features of adult human astrocytes. J Neurosci 29(10):3276–3287.
29. Belichenko PV (1993) Neuronal cell types in entorhinal cortex and hippocampal formation of man and other mammalia: An interspecies comparison. Hippocampus 3(Spec No, S1):3–10.
30. Seress L, Frotscher M (1990) Morphological variability is a characteristic feature of granule cells in the primate fascia dentata: A combined Golgi/electron microscope study. J Comp Neurol 293(2):253–267.
31. Nilsson M, et al. (2010) Evaluating the accuracy and precision of a two-compartment Kärger model using Monte Carlo simulations. J Magn Reson 206(1):59–67. 32. Nedjati-Gilani GL, Schneider T, Hall MG, Wheeler-Kingshott CA, Alexander DC (2014)
Machine learning based compartment models with permeability for white matter microstructure imaging. Med Image Comput Comput Assist Interv 8675:257–264. 33. Torben-Nielsen B, De Schutter E (2014) Context-aware modeling of neuronal
mor-phologies. Front Neuroanat 8(92):92.
34. Provencher SW (1993) Estimation of metabolite concentrations from localized in vivo proton NMR spectra. Magn Reson Med 30(6):672–679.
35. Rothman DL, De Feyter HM, de Graaf RA, Mason GF, Behar KL (2011) 13C MRS studies of neuroenergetics and neurotransmitter cycling in humans. NMR Biomed 24(8): 943–957.
36. Ferreira TA, et al. (2014) Neuronal morphometry directly from bitmap images. Nat Methods 11(10):982–984.