HAL Id: hal-01679653
https://hal.sorbonne-universite.fr/hal-01679653
Submitted on 10 Jan 2018
HAL is a multi-disciplinary open access
archive for the deposit and dissemination of
sci-entific research documents, whether they are
pub-lished or not. The documents may come from
teaching and research institutions in France or
abroad, or from public or private research centers.
L’archive ouverte pluridisciplinaire HAL, est
destinée au dépôt et à la diffusion de documents
scientifiques de niveau recherche, publiés ou non,
émanant des établissements d’enseignement et de
recherche français ou étrangers, des laboratoires
publics ou privés.
Distributed under a Creative Commons Attribution| 4.0 International License
transition to relativistic self-induced transparency in laser-driven ion acceleration. New Journal of
Physics, Institute of Physics: Open Access Journals, 2017, 19, �10.1088/1367-2630/aa8e66�.
�hal-01679653�
PAPER • OPEN ACCESS
Kinetic and finite ion mass effects on the transition
to relativistic self-induced transparency in
laser-driven ion acceleration
To cite this article: E Siminos et al 2017 New J. Phys. 19 123042
View the article online for updates and enhancements.
Related content
Electron heating by intense short-pulse lasers propagating through near-critical plasmas
A Debayle, F Mollica, B Vauzour et al.
-Wavebreaking-associated transmitted emission of attosecond extreme-ultraviolet pulses from laser-driven overdense plasmas
Zi-Yu Chen, Mykyta Cherednychek and Alexander Pukhov
-Energy dispersion in radiation pressure accelerated ion beams
M Grech, S Skupin, A Diaw et al.
-Recent citations
Summary of working group 2: Ion beams from plasmas
A. Flacco and L. Willingale
1 Department of Physics, Chalmers University of Technology, Gothenburg, Sweden 2 LULI, CNRS, UPMC, Ecole Polytechnique, CEA, F-91128 Palaiseau, France
E-mail:siminos@chalmers.se
Keywords: laser plasma interaction, relativistic transparency, hole-boring, near critical plasmas, Hamiltonian, separatrices Supplementary material for this article is availableonline
Abstract
We study kinetic effects responsible for the transition to relativistic self-induced transparency in the
interaction of a circularly-polarized laser-pulse with an overdense plasma and their relation to
hole-boring
(HB) and ion acceleration. It is demonstrated using particle-in-cell simulations and an analysis
of separatrices in single-electron phase-space, that ion motion can suppress fast electron escape to the
vacuum, which would otherwise lead to transition to the relativistic transparency regime. A simple
analytical estimate shows that for large laser pulse amplitude a
0the time scale over which ion motion
becomes important is much shorter than usually anticipated. As a result of enhanced ion mobility, the
threshold density above which HB occurs decreases with the charge-to-mass ratio. Moreover, the
transition threshold is seen to depend on the laser temporal pro
file, due to the effect that the latter has
on electron heating. Finally, we report a new regime in which a transition from relativistic
transparency to HB occurs dynamically during the course of the interaction. It is shown that, for a
fixed laser intensity, this dynamic transition regime allows optimal ion acceleration in terms of both
energy and energy spread.
1. Introduction
Modern high intensity laser technology has made the regime of relativistic optics experimentally accessible. In this regime electrons interacting with the laser-field gain relativistic velocities within an optical cycle and their motion becomes highly nonlinear. Exploiting complex laser-plasma interaction in this regime has led to a wealth of novel applications ranging from charged particle acceleration[1–3] to sources of ultra-short radiation [4,5].
It has long been recognized that in the relativistic optics regime even the most basic properties of a plasma such as its index of refraction are profoundly affected by nonlinearities in electron motion[6,7]. In particular,
the increase of the effective electron mass due to itsγ-factor dependence on the laser normalized vector potential
= ( )
a0 eA0 m ce leads to an effective increase of the critical density
= + ( )
n 1 a n
2 . 1
ceff 0 c 2
Herenc=0mew2L e2is the classical critical density above which a plasma is nominally opaque to a laser pulse
with angular frequencywL, meand-eare the electron mass and charge, respectively, c is the speed of light in
vacuum, and0is the permittivity of free space.
This simple form for the relativistic critical density nceffholds for plane waves propagating through a uniform
and infinitely long plasma. By our choice of normalization of the incident laser pulse vector potential,
equation(5), the laser wave amplitude a0relates to the wave intensity asIL Ll2 1.38a02´10 W cm18 -2mm-2,
with lL =2p wc Lthe laser wavelength. With this choice, equation(1) is valid for both circular and linear
polarization, if the cycle-averagedγ-factor is used for the latter. This effective increase of the critical density is the REVISED
20 September 2017
ACCEPTED FOR PUBLICATION
22 September 2017
PUBLISHED
22 December 2017
Original content from this work may be used under the terms of theCreative Commons Attribution 3.0 licence.
Any further distribution of this work must maintain attribution to the author(s) and the title of the work, journal citation and DOI.
basis of the effect known as relativistic self-induced transparency(RSIT), in which a relativistically intense laser pulse(a01) can propagate in a nominally overdense plasma.
However, when one considers a laser pulse incident on a bounded plasma, the situation is much more complicated. In order to allow insight into the basic physical mechanisms involved and to establish connection with previous works we consider a simplified one-dimensional geometry. We consider a circularly polarized (CP) laser pulse with finite rise timetrand semi-infinite duration, normally incident onto a semi-infinite plasma with a constant electron densityn0>nc, and a sharp interface with vacuum, seefigure1(a). This configuration
is of particular interest for ultra-high contrast laser interaction with thick targets. Since no pre-plasma is assumed, the incoming laser pulse interacts directly with a nominally overdense plasma. The ponderomotive force pushes electrons deeper into the plasma, creating a high-density peak(compressed electron layer) that may prevent the pulse from propagating further,figure1(b). For linearly polarized pulses the strong ´J B electron heating can lead to the destruction of the electron density peak and, to a good approximation, the threshold for RSIT is found to be in agreement with nceff[8,9]. By contrast, for CP pulses, the ponderomotive force is
quasi-steady and electron heating is reduced. As a result, the compressed electron layer forms, efficiently reflecting the incident laser pulse. An equilibrium between the ponderomotive and charge-separation forces is reached and a standing wave is formed, with the plasma boundary displaced at a new(time-independent) position xb, figure1(b) [10]. This situation can be described in the framework of (stationary) cold-fluid theory [11,12], and
the existence of a standing wave solution defines the opaque regime of interaction. It is found that a plasma of a given density n0is opaque(self-shutters) for a0smaller than a threshold amplitudeaSW(n0)such that:
= ( + )( + - )- ( )
aSW2 n0 1 aB2 1 aB2 1 aB4 2, 2
Figure 1.(a) Schematic representation of the interaction setup for a hydrogen plasma, showing the electric field Ex(x), vector potential
amplitude∣ ( )∣a x and ion and electron densities niand ne, respectively.(b) Ignoring ion motion a standing wave solution is predicted
where = ⎛ - + - + ⎝ ⎜ ⎞ ⎠ ⎟ ( ) a n 9 n n n 8 1 3 2 9 16 1 , 3 B2 0 0 02 0
andn0ºn0 nc. In the limit of high densitiesn0ncwe can invert these expressions to obtain[13] the density
threshold for the existence of a standing wave
+ - ( ) ( ) ( ) n a 2 a n 9 3 9 6 12 c. 4 SW 0 0
Equation(4) is plotted in figure1, and, for the rangea0= –5 25considered here, it is in excellent agreement with the exact expression equation(2). Conversely, cold-fluid theory [11,12,14] predicts that RSIT occurs for
<
n0 nSW. Note that equation(4) implies a differenta01scaling for the transition to RSIT,nSWµa01 2, than
equation(1) which givesnceff µa0.
Nevertheless, PIC simulations have shown that even modest electron heating during the early stages of the interaction can disturb the plasma vacuum interface leading to a linear scaling for the density transition threshold,nthµa0with a coefficient that depends on the details of the interaction [13], see triangles in figure2.
In addition, ion motion(finite ion mass) has also been found to lower nthsignificantly in PIC simulations
[15]. However, the exact mechanism responsible for this reduction has not yet been clarified. Determining the
conditions and mechanisms responsible for transition from the opaque to the RSIT regime using CP light is of paramount importance as it determines the efficiency of laser energy coupling to the plasma, while it is also crucial for a wide range of applications. For example, relativistic transparency can be exploited to enhance the characteristics of laser-pulses[16], it may affect the propagation of probe pulses in plasmas with fast particles
[17–19] and has led to the development of novel ion acceleration schemes [20–29].
Here we are interested in the role that RSIT may play in laser radiation pressure acceleration of ions that has recently attracted a lot of attention[16,22,30–32]. Indeed, when the plasma is opaque (for large enough plasma
densities), and for thick enough targets, the so-called laser-driven hole-boring (HB) regime occurs [15,30,31,
33–36]. Ions are accelerated in the electrostatic field induced by charge separation and a double layer structure
known as a laser piston is formed, figure1(c). For non-relativistic ions, the resulting ion energy scales as
HBµ a n02 0, wheren0is the normalized electron plasma density, and thus there has been considerable interest
in operating HB as close to the threshold density for RSIT as possible[15,24,37,38].
In this work we show that the transition from the RSIT to the HB regime is associated with a much richer dynamical behavior than previously reported, owing to the complex interplay of fast electron generation and ion motion. In order to characterize the regime of interaction we perform a parametric scan in the a0–n0plane and
study signatures of RSIT in section2. In contrast to previous studies[15], which characterize the regime of
interaction in the asymptotic, long time limit, we do consider the full time evolution, including transient dynamics. This is particularly important in the mobile ion case and it allows us to uncover a new dynamic transition regime in which the transition from RSIT to HB occurs dynamically, i.e. during the course of
Figure 2. Different transition thresholds for RSIT. The black dashed line indicates the transition boundary for infinite plane waves
= +
nceff 1 a 2
02 . The red solid line is the cold-fluid threshold for existence of a standing wave, nSW, given by equation(4). The
green triangles indicate the results for the transition threshold nthfrom PIC simulations with immobile ions, see section2. The lower
end of the error bars indicates the boundary of the RSITregime for hydrogen and helium, as determined by PIC simulations (section2). The upper end of the error bars indicates the boundary of the HB regime. The dynamic transition regime lies within the
interaction. In order to understand the exact mechanism we develop a dynamical systems description based on the effect of ion motion on electron phase-space separatrices in section3. It is shown that the time scale over which ion becomes important is much shorter than usually anticipated leading to a dependence of the transition threshold on the ion charge-to-mass ratio. Moreover, the dynamic transition regime is shown to strongly depend on kinetic effects developing in the early stage of interaction and can be controlled by varying the temporal profile of the laser pulse. The importance of studying transient effects is emphasized by comparing ion spectra in the conventional near-critical HB regime and the dynamic transition regime in section4. In the latter case much smaller energy dispersion is observed. Finally, in section5, we discuss the differences of the dynamic transition regime with some previously explored near-critical regimes of ion acceleration[15,23,24], and
present our conclusions.
2. Detection of the transition threshold
The transition from the HB(opaque) regime to RSIT is investigated using 1D3P PIC simulations performed with the code EPOCH[39]. The(a0,n0)-parameter plane was scanned to locate the transition threshold nthfor
different values of the ion charge-to-mass ratio corresponding to hydrogen, helium and immobile ions,figure2. The simulation box extends fromx= -L up to x=L, whereL=200lL. The plasmafills half of the box with a
constant electron density n0and a step-like plasma-vacuum interface. The initial electron and ion temperatures
areTi=Te= ´5 10-4m ce 2. The plasma is irradiated by a CP laser pulse with normalized vector potential
x x = + ( ) ( )[ ˆ ˆ ] ( ) a x t, a f t y z 2 cos sin , 5 L 0
where x=wLt -k xL ,kL=wL cand the envelope f (t) is a flat-top profile with a sin2ramp-up of durationtr
figure1(a). The pulse reaches the plasma at t=0 and the total simulation time istsim=2L c. The spatial
resolution is set toD =x 0.8lD, wherel =D 0T e ne 2 0is the Debye length of the unperturbed plasma, the
time-step is D =t 0.95Dxand 1000 macroparticles-per-cell have been used.
In order to determine the density threshold nthbetween the two regimes of interaction, we examine two
different time-series which are associated to either the velocity of the pulse front or the overlap of the laser pulse with the plasma electrons.
First, the pulse front position xf(t) is identified as the largest solution ofa x( f,t)=a0 2[15], where
=
( ) ∣ ( )∣ ( )
a x t, eAx t, m ce is the normalized amplitude of the vector potential, seefigure1(c). The pulse front
position moves deeper into the plasma at a velocity vfthat strongly depends on the interaction regime. In the
opaque regime, which occurs forn0>nth, propagation is dominated by transfer of momentum from the laser
photons to the ions and vfequals the so-called HB(or piston) velocity [30,40]
b b
= ( + ) ( )
vHB c 0 1 0 , 6
where b =0 a0 2m ni i0 (m ne c), miis the ion mass and ni0is the ion plasma density. As outlined in the
introduction, defining the RSIT regime is not straightforward when boundaries are involved. Here, we adapt the point of view of earlier works which associated the RSITregime in the immobile ion case with the absence of a standing wave solution[11–14]. In the RSIT regime with mobile ions no double layer (relativistic piston) is
formed and transfer of momentum to ions is minimal. This operating definition of RSITfor plasmas with an interface with vacuum implies deviations from the relativistic dispersion relation applicable in plasmas of infinite extent [6,7]. Eventhough the energy balance has been invoked in a number of works in order to
determine the front propagation velocity in the RSIT regime[41–43], no generally valid, closed-form solution
exists[15,43]. Therefore, in order to determine if the laser-front velocity vfin mobile ion simulations corresponds to propagation in the RSIT regime we compare it withvSIT¥, the front velocity from immobile ion simulations with otherwise identical interaction parameters. For laser amplitudes in the range5a025that we study here, it is expected thatvSIT¥ >vHB[15]. We thus anticipate that at the threshold density for the
transition from HB to RSIT a discontinuous change of vfoccurs.
The second quantity on which we rely in order to distinguish between the opaque and transparency regimes provides a measure of the overlap of the laser pulse with plasma electrons. It is the cross-correlation function
ò
l = - -( ) ( )∣ ( )∣ ( ) S t nc L dx n x t a x t, , 7 L L e 1 1 2 2 2introduced in[38]. In the HB regime the laser-pulse overlap with plasma electrons is limited to the electron
skin-depth[31,38], see figure1(c), and therefore S(t) is expected to remain approximately constant (and small)
during the interaction. On the other hand, in the RSIT regime we expect S to increase linearly with time as the laser-pulse propagates deeper into the plasma at the constant velocity vf.
With these two methods we can numerically determine the density thresholdnth( )a0 that delineates the HB
=
a0 10and ramp-up time tr= 4tL, where tL = 2p wL. Infigures3(a) and (b), we plot as a function of time
and for different n0the position of the pulse front xfand the cross-correlation function S, respectively. For
n0= 3.3, we observe that, after an initial stage of durationtrduring which a partially standing wave[44] is
formed, the front propagation velocity reaches a constant valuevf =0.08c. This matches very well the
analytically predicted HB velocityvHB=0.083c. Moreover, S remains approximately constant fort>tr. This
is characteristic of the HB regime, in which the overlap of the laser pulse with plasma electrons is limited to the skin depth[38].
Forn0=2.6ncon the other hand, the pulse front propagates with a velocity which at large times approaches
the constant valuevf =0.24c,figure3(a). This is much higher thanvHB=0.09and very close tovSIT¥ =0.23c
obtained by performing a simulation with immobile ions and identical interaction parameters. This shows that this regime of propagation is indeed dominated by electron motion effects. In addition, S increases
approximately linearly aftert=tr. This implies that the laser overlap with plasma electrons increases with time
as expected in the RSIT regime[38].
For intermediate densities, between these two clearly defined regimes of propagation, we observe a behavior that has not been identified before. As an example, we show in figure3the casen0=2.8ncfor which the pulse
front propagates initially with a velocityvf =0.11clarger thanvHB=0.09cuntil up to approximatelyt~9tL.
After this time the front velocity changes abruptly and matches closely the HB velocity. The change in velocity between the initial andfinal stages of propagation is subtle, and thus it is essential to also examineS t( ). In figure3(b) we see that during the initial stage S grows linearly, as is typical of the RSIT regime. However, for
t
>
t 9 Lthis growth saturates and an almost constant value of S is reached, as is typical of the HB regime. This
demonstrates the existence of a dynamic transition from RSIT to HB.
In order to check the applicability of these results beyond the specific case studied so far, we performed a parametric scan for the transition threshold in the(a0–n0)plane for immobile ions, helium and hydrogen. The
results are summarized infigure2, in which the extent of the error-bar indicates the extent of the dynamic transition regime. We observe that RSIT occurs at much lower densities for mobile than for immobile ions. Moreover, we see that the transition to RSIT occurs at lower density for ions with higher charge-to-mass ratio, as
Figure 3.(a) Pulse front position xf(t) fora0=10, tr= 4tLand different densities,n0=2.6, 2.8and3.3nc(RSIT, dynamic
transition and HB regime, respectively). The upper and lower straight solid lines correspond to front propagation withvSIT¥(with
=
also observed in previous numerical simulations[15]. We note that for mobile ions the transition occurs below
the coldfluid theory threshold nSWfor existence of a standing wave with immobile ions[11,12], shown as a red
solid curve infigure1(b). These observations suggest that we need to study the interplay of kinetic effects and ion
motion in order to gain a qualitative understanding of the transition mechanism, a task that will be pursued in section3.
3. Importance of kinetic and
finite ion mass effects
3.1. Phase-space separatrices
As we will show, the transition to RSITis in large part determined by laser energy absorption, which in near-critical plasmas can be significant even with CP pulses [13,41,42,45]. During the early stage of the interaction
the ponderomotive force of the laser pulse accelerates electrons deeper into the plasma, until it is shielded by an electron density spike and wavebreaking occurs. Some of the accelerated electrons are trapped in the potential well formed by the combination of the ponderomotive and electrostatic potentials. The exact mechanism of plasma heating is highly involved and a detailed model is still lacking. Here we will show that we can gain insight into kinetic effects despite the lack of a model of electron heating by using topological information encoded in distinguished trajectories in single-electron phase-space. In the case of immobile ions the escape of electrons from single-particle separatrices at the plasma-vacuum interface was shown to be responsible for transition to RSIT[13]. In particular, it was demonstrated that the width of these separatrices decreases with decreasing
density n0. Below a certain density n0,finite amplitude perturbations in longitudinal momentum pxcan then
lead to electron escape to the vacuum, lowering the electrostaticfield. Then the ponderomotive force prevails and pushes the electron front deeper in the target. This cycle repeats allowing laser pulse penetration in the target.
For the case of mobile ions the situation is more involved since the transient nature of ion motion during the early stages of the interaction implies that well-defined separatrices may not exist. In order to make progress we assume that such separatrices between escaping and confined trajectories do exist over the electron time-scale and verify this assumption a posteriori. In particular, we transform the single-electron Hamiltonian
f
= + +
-( ) ( ) ( ) ( )
H x p t, x, m ce 2 1 a x t, 2 px2 m ce2 2 e x t, 8 to a frame moving with the instantaneous front velocityvf. Here, f (x t, )is the instantaneous scalar
(electrostatic) potential and pxis the electron momentum. The Lorentz transformed Hamiltonian reads
g
¢ = [ - ] ( )
H f H v p ,f x 9
with g =f (1 -vf2 c2)-1 2(where a prime denotes a Lorentz-transformed coordinate). The potentials and front
velocityvfare determined from our PIC simulations. We assume that in the frame moving with velocityvfa
quasi-steady state of equilibrium between the ponderomotive and electrostatic force has been reached. In particular, we assume that the variation of the potentials due to ion motion is slow compared to the typical time-scale for electron motion and thus,H¢can be treated as time-independent. Although we plot contours ofH¢
both in and out of the plasma, we are interested in their form in the charge separation layer, where fast electron dynamics have small effect on thefields [13].
Separatrices are associated with saddle type(unstable) equilibria of the equations of motion (referred to as X-points). Taking into account Hamilton’s equations, the equilibrium condition is written ¢ = ¶ ¢ ¶ ¢ =x H px 0,
¢ = -¶ ¢ ¶ ¢ =
px H x 0. The separatrices for electron motion are determined as iso-contours ofH¢associated with its local minima. Distinguishing saddle(unstable) from center (neutrally-stable) equilibria would involve examining second derivatives ofH¢. However, for our purposes, the distinction will be clear by inspection of phase-space plots. Examples of separatrices are plotted infigure4, which will be discussed in detail in section3.2. The critical momentum magnitude ∣pxcr∣is defined as the minimum momentum that an electron at the plasma boundary must have in order to escape to the vacuum. In the immobile ion case it is equal to the momentum an electron initially placed at(the vicinity of) the X-point gains by the time it crosses the plasma boundary xb[13].
3.2. Effect of ion charge-to-mass ratio: a case study
We begin by examining the effect of ion charge-to-mass ratio on the dynamics in the total-reflection regime. In figure4we show the electron phase space from simulations forn0=4.5nc,a0=10, tr= 4tLfor the cases of
hydrogen, helium and immobile ions. These parameters were chosen so that all three cases correspond to the opaque regime. We show snapshots att=5tL>trso that theflat-top part of the pulse has reached the target.
We choose to compare the phase space at this early stage of interaction because, as will become evident in the following, this is when the transition to RSIT is determined. Wefind that there are no significant differences in the width of the electron distribution close to the plasma-vacuum interface at this stage. This shows that any
differences in electron heating due to laser pulse energy being expended in ion motion are minimal and cannot explain the difference in transition threshold.
Figure4allows us to confirm that the electrostatic field is perturbed (compared to the immobile ion case) due to ion motion already at this early stage. The reduction in the electrostaticfield in the charge separation layer (more visible for hydrogen, figure4(c)) is larger at the position of the X-point xXrather than at the position of the electron front xf. This is due to the fact that the perturbation in ion density depends both on the magnitude of the
electrostaticfield and on the time over which it acts on ions. Before ion motion becomes important, the field increases approximately linearly with x,
= < < ( )
Ex Ec n k x0 L 0 x xb, 10 withEc=m ce wL ethe so-called Comptonfield. Moreover, since it takes a finite time for the charge separation
layer to be setup, the time over which an ion is accelerated decreases with its initial position x. As a result, ions close to the plasma boundaryxbxfdid not yet have enough time to respond and the difference in the position
of the front xfbetween the mobile and immobile ion cases is negligible. On the other hand, the position of the
X-point is determined by the balance of the ponderomotive and electrostatic force. Due to the reduction of the electrostaticfield in the middle of the charge separation layer, a new equilibrium is reached at a position where the magnitude of the ponderomotive force is smaller, i.e., the X-point xXis moved towards the left where the
slope of ∣ ∣a is smaller, seefigure4. At the same time the magnitute of critical momentum for escape to vacuum (the separatrix width) becomes larger as the distance of xXand xbincreases.To understand this qualitatively, note
that a test electron with small positive initial momentum placed at xXwill gain a net momentum(approximately
equal to the critical momentum magnitude ∣pxcr∣) while moving up to xb, since the ponderomotive force is larger than the electrostatic force forxX< <x xb. In the mobile ion case the same electron would experience a larger
average accelerating force(due to the reduction in electrostatic field) for a larger distance (due to the increase in
-xb xX) therefore gaining larger net momentum.
3.3. Time-scale for ion motion
Let us now give an estimate for the time-scale over which ion motion becomes important in the sense that it can affect the electron dynamics close to the interfacex~xf. Naively, an estimate could be provided by pw2 -pi1,
where wpi= Z e n2 2 0i/(e0mi)is the ion plasma frequency,n0i=n0 Zis the ion number density, Z is the
atomic number of the ion species, and miis the ion mass. For a typical case of hydrogen withn0i=n0=3, we
find pw- t
2 pi1 25 L. This appears to be too large to affect the transition dynamics according to the timeframe
implied byfigure3.
The main problem with the above estimate is that it does not depend on the laser strength a0, since it does not
take into account that transient ion motion can occur in the strong electrostaticfield of order 2a E0 cset up by
the laser pulse ponderomotive force. This is particularly important here, sincefigure4shows that a relatively small change in the electrostaticfield Excan lead to change in critical momentum for escape of the order ofm ce .
Indeed, as we are here investigating the effect of ion motion on the electron dynamics, we can anticipate that a change in electricfield of the order of Ec(the typical field for relativistic electron effects), could lead to qualitative changes in dynamics despite the fact that the maximum unperturbedfield is many orders of magnitude larger
Figure 4. Results of PIC simulations in the total reflection regime (n0=4.5nc,a0=10, tr= 4tL) for different ion charge-to-mass
ratio:(a), (d) immobile ions, (b), (e) helium, (c), (f) hydrogen. Top panels show electron (black solid line) and ion density (blue solid line), electric field (green solid line) and vector potential amplitude (magenta solid line) and bottom panels show the electron distribution functionf x p te( , x, )and contours of the Hamiltonian. The separatrices of bounded and unbounded electron motion are shown with red dashed line. All snapshots are shown fort=5tL.
than this. We will now develop a simple model for the transient ion response at the early stage of interaction in order to estimate the time required for a change in electricfield of order Ecto occur.
In order to obtain an upper bound for the response time of the ions we model the interaction as a two stage process[46]. Initially the electrons are pushed by the ponderomotive force and a charge separation layer is
formed. The resulting electrostaticfield is a linear function of the space coordinate x, as described by
equation(10). At a second stage, ions are accelerated in this electrostatic field. Since it takes a finite time to setup
the charge separation layer, ions with smaller x are accelerated for a longer time (but experience a smaller electric field). Treating the ions as a cold fluid, we write the ion momentum equation as
¶ ¶ + ¶ ¶ = ( ) ( ) m n V t m n V V x q n E x t, , 11 i i i i i i i i i x
whereV x ti( , )is the ionfluid velocity. We let = ( )t0 t x0 denote the time at which the charge separation‘front’
sweeps point x, and the field takes the value predicted by equation (10), i.e. the plateau in figure5(a) is reached.
The ions are assumed initially at rest,V x ti( , 0)=0, and we consider short enough evolution times that we may linearize equation(11) and drop the term ¶Vi x iV. For the same reason we also ignore relativistic ion effects. Even
though the ions obtainfinite momentum at early times, their density response is expected to be minimal and, since we are only interested in obtaining an upper bound on the characteristic time for ion motion to affect the electron dynamics, the effect of ion density variations in the electricfield (through Poisson’s equation) will not be considered. Under these assumptions, we only need the longitudinal component of Maxwell–Ampere’s equation to close the model,
= - ¶ ¶ ( ) j E t . 12 x x 0
In the charge separation layer there are no electrons, so thatjx =q n Vi i i. Substituting equation(12) in the
linearized version of equation(11) we obtain
w ¶ ¶ = - ( ) V t V . 13 i pi i 2 2 2
This has the solution
w w = -( ) ( ) [ ( )] ( ) V x t q m E x t t t , , sin , 14 i i i pi x 0 pi 0
where for each x,E x t( , 0)=n k E x0 L c from equation(10) is taken as initial condition and we have enforced
consistency of ¶t i t tV∣=0with equation(11). Taking into account equation (14), the solution of equation (12) can be written
w
=
-( ) ( ) [ ( )] ( )
E x tx , E x t, 0 cos pi t t0 . 15 Fora0ab1we have that[13]k xL b 2a0 (n0)and thusE x tx( b, 0) 2a E0 c. From equation(15) we
find that an ( )Ec change in the electricfield at xb, DEx-Ec, occurs at a timescale
Figure 5. Evolution of the local electrostaticfield Exfor the PIC simulations offigure4(n0=4.5nc,a0=10, tr= 4tL) for three
different positions in the charge separation layerx* =0.3, the X-point xXand the electron layer boundary xb. Dashed horizontal lines
indicate the theoretically predicted value for the maximum electrostaticfield for each x, according to equation (10). The solution of
equation(15) for (E x tx , )for each case is shown as a red, dashed curve. The initial time t0corresponds to the time, for each x, for
t w t = g a( ) =g a( ) A n m ( ) Z n m , 16 i pi c p e L 0 0 0 where = ⎛ -⎝ ⎜ ⎞⎠⎟ ( ) g a a arccos 1 1 2 . 0 0
We note that equation(16) is derived under the assumption of a large initial electric field. It is valid only in
the limita0ab1, and becomes singular fora0<1 2 2( ). For completeness, we mention that in the
large density regime,n0a02, the maximum electrostaticfield at xbscales as[13]Ex,max Ec2a02 n01 2and a
different limiting behavior can be derived,g a( )0 =arccos 1( -n01 2a0-2 2).
Figure5shows the evolution of the electrostaticfield in the initial phase of the interaction for the three cases offigure4and for three different positions in the charge separation layer * =x 0.3, theX-point xXand the
electron density boundary xb. We see that the solution of equation(15) for (E x tx , )(red, dashed curve) agrees
well with the simulations for smaller x, while for larger x the observed change in Exis faster than predicted by
equation(15). This is because we did not take into account the fact that ions will start to move even before the
field reaches the value predicted by equation (10). Indeed, as seen in figures5(b) and (c), the time interval during
which the electricfield rises is finite and increases with the position x. Although we could, in principle, account for this by solving equation(13) with initial conditionV x ti( , 0)¹0, we will not pursue this here since we are only interested in obtaining an estimate. Moreover, in the above derivation, we did not take into account the effect of ion density variation. At later times, this leads to deviation from the sinusoidal behavior predicted by equation(15). However, even in the worse case scenario of figure5(c) this only occurs after a change of order Ec
in Exhas taken place. Therefore, equation(16) constitutes a useful upper bound for the time-scale at which ion
motion becomes important in our problem. For the case of helium(hydrogen) withn0=4.5ncanda0=10,
equation(16) predicts a change in electric field of the order of Ecat time ti= 1.7tL(ti= 1.2tL) after the time
t =
t0 4.1 Lat which the charge separation layer has been set up at the X-point (found from the PIC simulations,
seefigure5). Although this is still a conservative upper bound, it matches much better the results of figures4(b)
and(c) than the naive scaling pw2 -pi1=28tLand20tLobtained for helium and hydrogen, respectively.
3.4. Transition to relativistic self-induced transparency
In order to establish the connection of the separatrix width to the transition to RSIT, we now concentrate in the case of a hydrogen plasma and reduce the density, compared tofigure4(c), to the lowest possible density
=
n0 3.3ncfor which dynamics is still in the HB regime. Infigure6we show, for two different timest=5tLand
t
=
t 15 L, the results of a simulation witha0=10,n0=3.3nc. For these parameters coldfluid theory with
immobile ions predicts that no standing wave solution exists and electrons from the dense electron layer would be able to escape to the vaccuum leading to RSIT according to the scenario in[13,14]. However, we see in
figure6(c) that due to ion motion a separatrix merely wide enough that no electrons escape to the vacuum
during the initial stage of the interaction exists. The separatrix width is smaller than in the casen0=4.5ncof
Figure 6. HB regime simulation(n0=3.3nc,a0=10, t = 4r , hydrogen): electron and ion density, electric field and vector potential
amplitude for(a)t=5tLand(b)t=15tL. Electron distribution fuctionf x p t( , x, )and iso-contours ofH¢(black, solid lines),
figure4because it takes longer for ion effects to become important in this case of lower density(according to equation(16), ti= 1.4tL). With time, a double layer is formed and propagates deeper into the plasma as a laser
piston(figures6(b) and (d)). At this stage the separatrix becomes wider in pxas ions catch up with the electrons, reducing the charge separation induced electrostaticfield. This contributes to the stability of the HB process as electrons cannot escape at this point.
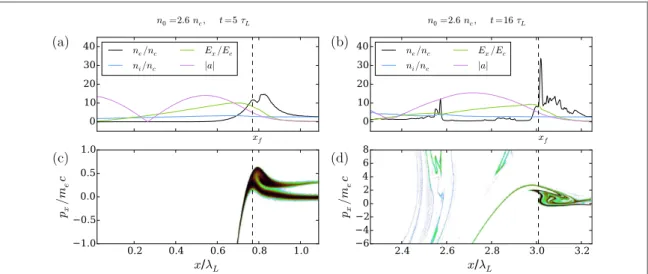
We next examine typical dynamics in the RSIT regime, i.e., at lower density( =a0 10,n0=2.6nc,figure7).
Lowering the density further decreases the effect of ion motion, t 1.6i , preventing the plasma to reach a
quasi-static state which could trap electrons. As electrons escape, the space-charge is largely reduced and the ions remain essentially immobile during the course of the simulation. Therefore, the immobile ion results apply: the interaction is in the RSIT regime sincen0<nSW[11–14]. Since the quasi-static approximation does not hold in
this case, we do not plot separatrices infigure7. However, we note that the fact that electron escape in the PIC simulations occurs for all values below n0= 3.3 for which the separatrix (figure6(c)) was marginally wide
enough to prevent electron escape justifies using the Lorentz-transformed Hamiltonian in order to define separatrices of confined and escaping electrons. We note that laser propagation in this RSIT regime is not associated to the destruction of the electron density peak; the latter remains higher than the threshold nceff
predicted by equation(1), see figure7(b). Rather, while some electrons are pushed into the plasma, other
electrons continuously escape in the region where they interact with the laser-pulse through a mechanism akin to beatwave heating[45]. We thus conclude that, as in the case of immobile ions [13], electron escape drives
transition to RSIT.
For intermediate densities2.7<n0 nc<3.3between the hole boring and RSIT regimes wefind the dynamic transition regime. As an example we see infigure8that fora0=10,n0=2.8ncelectrons are initially
escaping(panels (a) and (c)). The estimate for the ion response time, t 1.5i , is slightly smaller than in the RSIT
case, while at the same time the RSIT velocityvSIT¥decreases with the density[13,15]. Therefore ions in the
charge separation layer gain enough momentum to catch up with the electron front. This leads to the eventual formation of a piston and of a potential well in which electrons are trapped(panels (b) and (d)). Electron escape then saturates and the subsequent dynamics are of the HB type.
For completeness, we note that for even larger laserfield amplitudes ( a0 20), interaction in the dynamic transition regime can be even more complex and a transition may also occur in the reverse direction, from HB to RSIT, since electrons accelerated by the beatwave heating mechanism[45] can re-enter the plasma and
destabilize the relativistic piston.
4. Effect of laser envelope on the transition threshold and ion energy distribution
4.1. Effect on the transition threshold
Since kinetic effects in the early phase of interaction play an important role in the transition between the different regimes, we can, to some extent, control the transition by varying the shape of the laser pulse. The ponderomotive force associated to a pulse with a shorter rise-time is larger than for one with a longer rise-time and this is expected to lead to stronger electron heating in the former case[42]. In order to illustrate this, we
Figure 7. RSIT regime simulation(n0=2.6nc,a0=10, t = 4r , hydrogen): electron and ion density, electric field and vector
potential amplitude for(a)t=5tLand(b)t=15tL. Electron distribution functionf x p t( , x, )and, when applicable, iso-contours of ¢
choosefixed values ofa0=10andn0=2.7ncand perform simulations with different pulse rise-times,
t = 4, 7r and12tL.
Infigure9we show that for the shortest value tr= 4tLthe pulse propagates in the RSIT regime, while astr
increases to tr= 7tLandtr= 12tL, the dynamic transition and HB regimes are reached, respectively. The
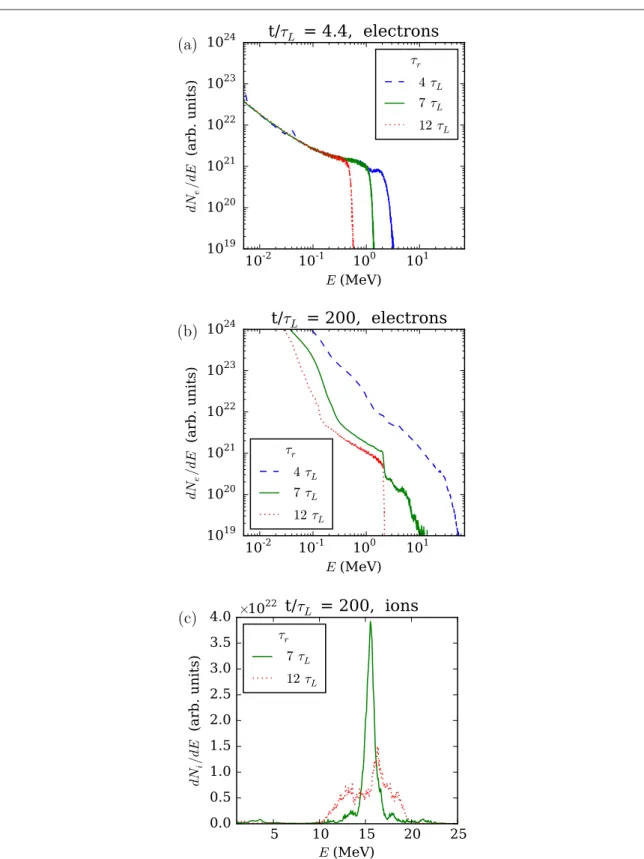
relation of this effect to electron heating is illustrated infigure10(a), where the electron spectra are compared at
an early interaction time,t=4.4tL, before electrons escape in any of these cases. Wefind that electron spectra
in the case of shorter rise-time are broader than for longer rise-times, showing that electron heating indeed occurs at a higher rate for the pulse with shorter rise timetr. Moreover, it was verified by plotting the electron
separatrices(not shown) that the transition mechanism is identical to the one described above. In the case of
tr= 4tLthe stronger electron heating leads to electron escape and triggers RSIT. For tr= 12tLno electrons gain
enough momentum to escape to the vacuum and we have HB. Finally, fortr= 7tLsome electrons escape but
eventually ion response leads to a dynamic transition to HB.
4.2. Effect on the ion energy distribution
In either the case of tr= 7tL(dynamic transition) or tr= 12tL(HB) the long time dynamics corresponds to
HB. It is therefore worth asking whether there are any differences in ion spectra in these cases. The ion spectra at
t
=
t 200 Lare shown infigure10(c). We observe that in the HB regime (tr= 12tL) the spectrum has a
multi-peak structure around the HB energy HB= 15.8 MeV. By contrast, for a typical simulation in the dynamic
transition regime(tr= 7tLand all other parameters kept unchanged), we see in figure10(c) that the spectrum
has a much lower energy spread. The peak energy 15.6 MeV is very close to the analytical prediction for HB, HB= 15.8 MeV, and the energy spread(1 MeV or 6% FWHM) is much smaller than in the pure HB regime for
tr= 12tL(correspondingly, 16.3 MeV, and energy spread of5 MeVor 30% FWHM).
To explain the differences in the ion spectra, one has to examine into more detail the dynamics of the double layer structure. Indeed, the broadening of the spectrum in the conventional HB regime is usually attributed to large amplitude periodic oscillations of the double layer, known as piston oscillations[31,32,40]. These
oscillations are illustrated infigure12(a) (for the conventional HB case (tr= 12tL)), where large scale
(DEx,max Ex,max0.3) periodic fluctuations are observed in the temporal evolution of the maximum value electrostaticfield. These oscillations result in ions being reflected at different phases of the oscillating piston and therefore accelerated to different energies as described in[40], thus leading to ion bunching and modulation of
the ion beam inx-pxphase space, sometimes referred to as‘rib-cage’ structure, and illustrated in figure11(b).
Although the exact mechanism behind these oscillations is still largely not understood, e.g. no model yet describes the time at which they set in nor why they appear, one can still get a deeper understanding of how they proceed by examining more closely the time evolution of the maximum values of the electrostaticfield and electron/ion densities, as shown in figures12(a)–(c).
The following discussion focuses on non-relativistic HB velocities, and builds on the previous analysis of piston oscillations as a three-step process presented in[31], where the piston structure was also described within
the framework of stationary coldfluid theory.
Figure 8. Dynamic transition regime simulation(n0=2.8nc,a0=10, t = 4r , hydrogen): electron and ion density, electric field and
vector potential amplitude for(a)t=5tLand(b)t=15tL. Electron distribution fuctionf x p t( , x, )and iso-contours ofH¢(black,
In afirst stage (region I in figures12(a)–(c)), an ion bunch is formed in the charge separation layer close to
the laser front, associated with an increase of the maximum ion density as shown infigure12(b). This can be seen
more clearly in the supplemental movie1 available online atstacks.iop.org/NJP/19/123042/mmedia. In a second stage(region II in figures12(a)–(c)), this ion bunch crosses the charge separation layer and is
launched into the plasma. This results in the abrupt decrease of the electrostaticfield evidenced in figure12(a).
Note that stage I and II are characterized by the maxima of ion and electron density as well as electricfield being in a very close vicinity(supplemental movie 1). Furthermore, ion bunches launched into the target during the second stage have a velocity ~ v2 HB. This can be seen infigure12(c) where the velocity computed from the
position of the maximum ion density is about twice that computed from the maximum electron density moving atvHB(note that the discontinuity in the position of the maximum ion density occurs when the ion bunch
launched into the target becomes more dense than the the ion density peak in the charge separation layer and vice versa).
The characteristic time for these twofirst stages is related to the thicknessDeof the compressed electron
layer. As shown in[31],D ce wpe, and the duration of thesefirst two stages is negligible with respect to the
characteristic time of the piston oscillations.
Of particular importance is the third stage(region III in figures12(a)–(c)), during which not yet reflected
ions move deeper into the charge separation layer, thus increasing the charge imbalance and enhancing the electrostricfield as observed in figure12(a). The rate of increase of the electrostatic field can be estimated from
Ampère’s equation asdEx dt~Zen vi0 HB 0, and the characteristic duration of this stage is t32Di vHB,
whereDiis the width of the charge separation layer. The latter can be estimated from the piston model proposed
in[31] asD i vHB (3wpi), forvHBc. This leads t3~2 3( wpi), much larger than the characteristic duration
of thefirst two stages ( wµ -pe1) so that the characteristic duration of an oscillation is tosc ~t3w-pi1. The total
increase of the electrostaticfield during this stage can then be computed asDEx~2Zen vi0 HB (30wpi)
w
32 a m c0 e 0 e. Recalling that the(normalized) maximum electrostatic field iseEx,max (m ce w 0) 2a0,
one thenfinds that the relative amplitude of the electrostatic field oscillations are of the order DEx Ex,max1 3.
Figure 9.(a) Pulse front position xf(t) for hydrogen plasma,a0=10,n0=2.7ncand different rise-times t = 4, 7r and12tL(RSIT,
This simple estimate turns out to be in very good agreement with our numerical simulations, for example for figure12(a) we find DEx,max Ex,max 0.3. It is also confirmed by all our simulations performed in the pure HB (near critical) regime where piston oscillations have been observed, all of them exhibiting oscillations
DEx Ex,max ~0.3, independently of the initial plasma density n0and laserfield amplitude a0.
This three-step process suggests that, to set in, piston oscillations require a clear separation between the ion and electron layers, so that the third stage lasts long enough for the electrostaticfield perturbation to build up. While this is the case in most of our pure HB simulations, this clear separation does not hold when considering the dynamic transition regime(fortr= 12tL). In that case indeed, some of the electrons that escape into the
Figure 10. Energy spectra fora0=10,n0=2.7ncand different rise-timestr= 4tL(RSIT), tr= 7tL(dynamic transition regime)
and tr= 12tL(HB). (a) Electron spectra for electrons withx>xfobtained att=4.4tL,(b) same as above but for att=200tLand
vacuum during the initial stage interact with the standing wave and form energetic bunches through beatwave heating[45]; they then return to the plasma leading to enhanced electron heating by beam-plasma instabilities,
seefigure10(b), where electron spectra are plotted at late interaction timet =200tL,figure11and supplemental
movie2. This electron heating actually prevents the formation of the double layer with clearly separated ion and electron layers, as can be seen infigure11(b) for the dynamic transition regime, in contrast with figure11(a) for
the pure HB regime. This henceforth prevents piston oscillations to set in, as is confirmed in figures12(b), (d)
and(f) where none of the three stages discussed for the pure HB case are observed. In that case indeed some residual oscillations in the maximum electrostaticfield, albeit with a decreased amplitude
DEx,max Ex,max 0.15, can be observed. Their irregular nature prevents a strong imprint on the ion energy spectrum as they cannot not coherently contribute to acceleration or deceleration of the fast ions around their mean velocity, seefigure11, and explains the smaller energy spread in the fast ion spectrum observed in figure10(c).
As a result, operating in the dynamic transition regime may allow to produce ion beams via HB with a low energy spread. In contrast to operating in the pure HB regime at lower intensity(or conversely larger density), a situation which has been shown not to be prone to piston oscillation[31], small energy dispersion is here
obtained without sacrificing mean energy.
Let usfinally note that the effect of electron heating to prevent piston oscillations was also discussed in a previous work[47]. In that case however, the authors relied on the use of elliptically polarized light to allow for
electron heating to set in.
5. Discussion and conclusions
Before concluding on this work, we wish to briefly stress that various ion acceleration mechanisms have been identified in near-critical plasmas, which are clearly different from the ion acceleration process in the dynamic transition regime discussed here. At the boundary of the RSIT regimen0nthan energetic ion bunch can be
formed and accelerated to energies much higher than expected from a pure HB scenario, as discussed in[24]. In
[15] an incomplete HB regime has been reported, which occurs for much larger intensities (a0100) when
Figure 11. Snapshots att=45tLof electron neand ion density ni, normalized vector potential∣ ∣aand longitudinal electricfield Ex
normalized to the ComptonfieldEc=m ce wL efor simulations with hydrogen anda0=10,n0=2.7ncand(a) tr= 12tL(HB),
(b) tr= 7tL(dynamic transition regime). Corresponding ion and electron phase space are shown in (c), (d) and (e), (f), respectively.
¥
vSIT vHB. Finally, in the presence of a long enough pre-plasma, trace light ions can be accelerated by the charge
separationfield in the pre-plasma [23,48]. In all these regimes ion spectra scale differently than those obtained in
the dynamic transition regime, which follows the usual HB scaling.
To conclude, we have studied the transition from the opaque(HB) to a transparent (RSIT) regime in the interaction of relativistic laser pulses with plasmas using a combination of PIC simulations and Hamiltonian dynamics. The transition to RSITis found to be linked to an instability of the plasma-vacuum interface triggered by fast electron generation during the early stages of the interaction, as revealed by studying single-electron separatrices. Remarkably, this instability can be saturated by an ion-motion-induced deepening of the trapping potential at the plasma boundary. We thereforefind that ion motion is involved in a transition which is commonly thought of as a purely electron effect. As shown in section3, this occurs because the strong
electrostaticfieldEx,maxµa0at the charge separation layer causes ion response on a time-scale shorter than the
naive pw2 -pi1estimate. An upper bound for this time-scale which depends on bothwpiand, importantly, on a0
has been derived.
We showed that transient effects are important and identified a new dynamic transition regime from RSIT to HB. Surprisingly, the short, transient RSIT phase in this regime has a long-lasting impact on the properties of the accelerated ions. HB spectra in near critical plasmas suffer from broadening due to periodic piston oscillations. We analyzed these oscillations for non-relativistic HB as a three-step process and estimated the electricfield oscillation amplitude to be approximately 30%, independently of a0and n0, in very good agreement with PIC
simulations. Enhanced electron heating in the dynamic transition regime prevents this three-step process from setting in, therefore ameliorating the effect of the oscillations on the ion spectrum. As a result an optimal ion spectrum is obtained both in terms of mean energy and energy spread.
The transition between the transparent and opaque regimes of interaction, and the dynamic transition regime in particular, are characterized by complex dynamics which have been here studied in a reduced 1D geometry. In realistic(3D) geometries, further complicating factors may play an interesting role. Transverse, instabilities developing at the laser-plasma interaction surface[30,34,49–51] can trigger additional electron
heating[52,53] thus modifying the threshold density in a complex way. It is therefore important that these 3D
effects are taken into account in future works and that mitigation strategies for transverse instabilities relying, for
Figure 12. Difference in piston oscillations for simulations with hydrogen anda0=10,n0=2.7ncfor the two values of the rise time tr= 12tL(HB, left column) and tr= 7tL(dynamic transition regime, right column). (a), (d) Maximum longitudinal electric field
Ex,maxnormalized to the ComptonfieldEc=m ce wL eversus time.(b), (e) Maximum density ns,maxfor electrons(solid lines) and
example, on tuning the laser polarization[54] or intensity profile [55] be employed. Recently developed
optimization strategies drawing on thefield of complexity science, such as those that rely on genetic algorithms to control adaptive optics[56], suggest that there is a potential to operate laser-driven ion acceleration in the
dynamic transition regime despite the inherently complex dynamics at play.
These results are of fundamental importance for our understanding of relativistic laser-plasma interaction and for a wide-range of applications, from particle acceleration to fast ignition, as they open new paths, for example for the optimization of laser-driven ion beams.
Acknowledgments
The authors are grateful to Andrea Macchi and Tim Dubois for fruitful discussions and to Joana Martins for a careful reading of the manuscript. ES and MG also thank Theo Schlegel and Vladimir Tikhonchuk for early discussions on HB and piston oscillations. ESthanks Stephan Kuschel for help with the use of the package postpic [57]. This work was supported by the Knut and Alice Wallenberg Foundation (PLIONAproject) and the European Research Council(ERC-2014-CoG grant 647121). MG and ES acknowledge the hospitality of the Max Planck Institute for the Physics of Complex Systems where this work was initiated. Simulations were performed on resources at Chalmers Centre for Computational Science and Engineering(C3SE) provided by the Swedish National Infrastructure for Computing(SNIC) and on resources of the Max Planck Computing and Data Facility at Garching. EPOCH was developed under UK EPSRC grants EP/G054950/1, EP/G056803/1, EP/G055165/1 and EP/M022463/1.
References
[1] Mourou G A, Tajima T and Bulanov S V 2006 Rev. Mod. Phys.78 309
[2] Esarey E, Schroeder C B and Leemans W P 2009 Rev. Mod. Phys.81 1229
[3] Macchi A, Borghesi M and Passoni M 2013 Rev. Mod. Phys.85 751
[4] Teubner U and Gibbon P 2009 Rev. Mod. Phys.81 445
[5] Corde S, Ta Phuoc K, Lambert G, Fitour R, Malka V, Rousse A, Beck A and Lefebvre E 2013 Rev. Mod. Phys.85 1
[6] Akhiezer A I and Polovin R V 1956 Sov. Phys.—JETP 3 696 [7] Kaw P and Dawson J 1970 Phys. Fluids13 472
[8] Lefebvre E and Bonnaud G 1995 Phys. Rev. Lett.74 2002
[9] Palaniyappan S et al 2012 Nat. Phys.8 763
[10] Marburger J H and Tooper R F 1975 Phys. Rev. Lett.35 1001
[11] Cattani F, Kim A, Anderson D and Lisak M 2000 Phys. Rev. E62 1234
[12] Goloviznin V V and Schep T J 2000 Phys. Plasmas7 1564
[13] Siminos E, Grech M, Skupin S, Schlegel T and Tikhonchuk V T 2012 Phys. Rev. E86 056404
[14] Eremin V I, Korzhimanov A V and Kim A V 2010 Phys. Plasmas17 043102
[15] Weng S M, Murakami M, Mulser P and Sheng Z M 2012a New J. Phys.14 063026
[16] Bin J H et al 2015 Phys. Rev. Lett.115 064801
[17] Stark D J, Bhattacharjee C, Arefiev A V, Toncian T, Hazeltine R and Mahajan S 2015 Phys. Rev. Lett.115 025002
[18] Sävert A et al 2015 Phys. Rev. Lett.115 055002
[19] Siminos E, Skupin S, Sävert A, Cole J M, Mangles S P D and Kaluza M C 2016 Plasma Phys. Control. Fusion58 065004
[20] Yin L, Albright B J, Hegelich B M and Fernández J C 2006 Laser Part. Beams24 291
[21] Willingale L et al 2009 Phys. Rev. Lett.102 125002
[22] Henig A et al 2009 Phys. Rev. Lett.103 245003
[23] Sahai A A, Tsung F S, tableman A R, Mori W B and Katsouleas T C 2013 Phys. Rev. E88 043105
[24] Robinson A P L 2011 Phys. Plasmas18 056701
[25] Palaniyappan S, Huang C, Gautier D C, Hamilton C E, Santiago M A, Kreuzer C, Sefkow A B, Shah R C and Fernández J C 2015 Nat. Commun.6 10170
[26] Gonzalez-Izquierdo B et al 2016 Nat. Commun.7 12891
[27] Brantov A, Govras E, Kovalev V and Bychenkov V Y 2016 Phys. Rev. Lett.116 085004
[28] Grassi A, Fedeli L, Sgattoni A and Macchi A 2016 Plasma Phys. Control. Fusion58 034021
[29] Bychenkov V Y et al 2017 Phys. Plasmas24 010704
[30] Naumova N, Schlegel T, Tikhonchuk V T, Labaune C, Sokolov I V and Mourou G 2009 Phys. Rev. Lett.102 025002
[31] Schlegel T, Naumova N, Tikhonchuk V T, Labaune C, Sokolov I V and Mourou G 2009 Phys. Plasmas16 083103
[32] Grech M, Skupin S, Diaw A, Schlegel T and Tikhonchuk V T 2011 New J. Phys.13 123003
[33] Macchi A, Cattani F, Liseykina T V and Cornolti F 2005 Phys. Rev. Lett.94 165003
[34] Klimo O, Psikal J, Limpouch J and Tikhonchuk V T 2008 Phys. Rev. ST Accel. Beams11 031301
[35] Robinson A P L, Zepf M, Kar S, Evans R G and Bellei C 2008 New J. Phys.10 013021
[36] Yan X Q, Lin C, Sheng Z M, Guo Z Y, Liu B C, Lu Y R, Fang J X and Chen J E 2008 Phys. Rev. Lett.100 135003
[37] Macchi A and Benedetti C 2010 Nucl. Instrum. Methods A620 41
[38] Mironov V, Zharova N, d’Humières E, Capdessus R and Tikhonchuk V T 2012 Plasma Phys. Control. Fusion54 095008
[39] Arber T D et al 2015 Plasma Phys. Control. Fusion57 1
[40] Robinson A P L, Gibbon P, Zepf M, Kar S, Evans R G and Bellei G 2009 Plasma Phys. Control. Fusion51 024004
[41] Guérin S, Mora P, Adam J C, Héron A and Laval G 1996 Phys. Plasmas3 2693
[42] Robinson A P L, Trines R M G M, Polz J and Kaluza M 2011 Plasma Phys. Control. Fusion53 065019