HAL Id: hal-00316759
https://hal.archives-ouvertes.fr/hal-00316759
Submitted on 1 Jan 2001
HAL is a multi-disciplinary open access
archive for the deposit and dissemination of
sci-entific research documents, whether they are
pub-lished or not. The documents may come from
teaching and research institutions in France or
abroad, or from public or private research centers.
L’archive ouverte pluridisciplinaire HAL, est
destinée au dépôt et à la diffusion de documents
scientifiques de niveau recherche, publiés ou non,
émanant des établissements d’enseignement et de
recherche français ou étrangers, des laboratoires
publics ou privés.
resonance energy sources as observed in
artificially-induced HF radar backscatter
T. K. Yeoman, D. M. Wright
To cite this version:
T. K. Yeoman, D. M. Wright. ULF waves with drift resonance and drift-bounce resonance energy
sources as observed in artificially-induced HF radar backscatter. Annales Geophysicae, European
Geosciences Union, 2001, 19 (2), pp.159-170. �hal-00316759�
Annales
Geophysicae
ULF waves with drift resonance and drift-bounce resonance energy
sources as observed in artificially-induced HF radar backscatter
T. K. Yeoman and D. M. WrightDepartment of Physics and Astronomy, University of Leicester, University Road, Leicester LE1 7RH, UK Received: 3 July 2000 – Revised: 7 December 2000 – Accepted: 18 December 2000
Abstract. HF radar backscatter which has been artificially-induced by a high power RF facility such as the EISCAT heater at Tromsø has been demonstrated to provide iono-spheric electric field data of unprecedented temporal reso-lution and accuracy. Here such data are used to investigate ULF wave processes observed by the CUTLASS HF radars. Within a short period of time during a single four hour ex-periment three distinct wave types are observed with differ-ing periods, and latitudinal and longitudinal phase evolution. Combining information from the three waves allows them to be divided into those with a large-scale nature, driven exter-nally to the magnetosphere, and those with small azimuthal scale lengths, driven by wave-particle interactions. Further-more, the nature of the wave-particle interactions for two dis-tinct small-scale waves is revealed, with one wave interpreted as being driven by a drift resonance process and the other by a drift-bounce resonance interaction. Both of these mecha-nisms with m ≈ −35 and proton energies of 35–45 keV ap-pear to be viable wave energy sources in the postnoon sector. Key words. Ionosphere (active experiments; wave-particle interactions) – Magnetospheric physics (MHD waves and in-stabilities).
1 Introduction
In general, magnetospheric Ultra Low Frequency (ULF) waves which have an energy source external to the Earth, such as an impulse in the solar wind, solar wind buffeting, or the Kelvin-Helmholtz instability on the magnetopause, are characterised by small effective azimuthal wavenumbers m, (or equivalently a large scale size in the azimuthal direction). Conversely, it is now widely accepted that an energy source for small-scale, high-m ULF waves exists in drifting ener-getic particle fluxes through drift and drift-bounce resonance interactions. Such high-m waves are a topic of considerable
Correspondence to: T. K. Yeoman
importance in both theoretical and experimental studies at present. Energetic particles entering the Earth’s inner mag-netosphere from the magnetotail will experience gradient-curvature drift and thus move around the Earth, constitut-ing part of the global rconstitut-ing current. The driftconstitut-ing particles can drive MHD wave modes through wave-particle interactions, leading to perturbations in the electric and magnetic fields in the magnetosphere and ionosphere when free energy is avail-able to the wave. It has been suggested (e.g. Southwood, 1976; Hughes et al., 1978) that the part of the ion distribution function which is able to feed energy into the wave is when
∂f/∂W >0, where f is the ion distribution function and W is the energy. Such non-Maxwellian ion distribution func-tions can be created quite commonly by naturally-occurring processes in the magnetosphere, such as substorm-associated particle injections. Subsequent to such an injection the ions will gradient-curvature drift westwards, where they will on occasion match the local drift-bounce resonance condition (Southwood et al., 1969),
ωwave−mwaveωdrift=N ωbounce (1)
where N is an integer (usually ±1) and ωwave, ωbounce, and
ωdrift are the angular frequencies of the wave, the proton
bounce, and the proton azimuthal drift, respectively. Such wave-particle interactions are a process of fundamental im-portance in collisionless astrophysical plasmas.
The ionosphere modifies the magnetospheric ULF wave signature, leading to rotation and attenuation of the wave magnetic signature detected on the ground (e.g. Hughes and Southwood, 1976; Hughes, 1983). This attenuation of the pulsation magnetic perturbation below the ionosphere is pro-portional to exp(−kz) (e.g. Hughes and Southwood, 1976) where k is the field perpendicular component of the wave number and z is the E-region height. It is thus clear that ground magnetometer data is far from optimal for the study of high-m ULF waves, and that direct observation in the iono-sphere or magnetoiono-sphere is usually required. In particular, two categories of particle-driven waves have been intensively studied with ground-based data: storm time pulsations and
giant ‘Pg’ waves, which are dusk and dawn sector phenom-ena, respectively.
Storm time Pc5 pulsations have been seen in STARE (the Scandinavian Twin Auroral Radar Experiment; Greenwald et al., 1978) data (Allan et al., 1982, 1983). They are com-pressional waves of high m number (m = −20 . . . − 80; here negative m is taken to represent westward phase propagation) and frequency in the Pc5 range (1.7–6.7 mHz) which are as-sociated with a drift resonance source mechanism. Drift res-onance involves fundamental wave modes, with the electric field symmetric about the equator (i.e. an equatorial elec-tric field antinode). Storm-time Pc5s are observed in the dusk sector during magnetically disturbed intervals. Simi-lar waves, but with an equatorward phase motion, have been seen in SABRE (the Sweden And Britain auroral Radar Exp-eriment; Nielsen et al., 1983) and BARS (Bistatic Auroral Radar System; McNamara et al., 1983) coherent radar sys-tems in the dusk sector by Yeoman et al. (1992) and Grant et al. (1992) respectively.
The second class of particle driven ULF waves of inter-est are giant ‘Pg’ pulsations which have been observed on the ground as well as by orbiting satellites at times when geomagnetic conditions are quiet. Pgs are an example of a particle-driven ULF wave which may be studied with ground-based magnetometers. Chisham and Orr (1991) presented a statistical study of 34 of these events observed on the EIS-CAT magnetometer cross network in northern Scandinavia. They found a peak in occurrence of these waves in the dawn/ prenoon sector and no events were observed in the afternoon. The average value of the azimuthal wave number was ∼–26 for the 34 events. Pgs have been related to drift-bounce res-onance mechanisms with both symmetric (e.g. Takahashi et al., 1992) and antisymmetric (e.g. Chisham and Orr, 1991) wave modes, and the wave-particle interaction responsible for their generation thus remains controversial.
Recent results from DOPE (the DOppler Pulsation Experi-ment; Wright et al., 1997) at Tromsø in northern Norway have demonstrated the existence of populations of high-m waves in both the morning and afternoon sectors (Yeoman et al., 2000). In this case the morning sector waves were the most populous, and had m-numbers in the order of 100, high enough to screen the waves completely from ground mag-netometers. The structure and occurrence of such particle-driven waves have been studied by a number of authors in the magnetosphere with in situ spacecraft data, for both case studies (e.g. Hughes et al., 1979; Takahashi et al., 1990) and statistically (e.g. Kokubun, 1985; Takahashi et al., 1985; Anderson et al., 1990; Woch et al., 1990; Engebretson et al., 1992; Lessard et al., 1999). These studies are largely consis-tent with the ground-based results, identifying a strong pop-ulation of particle-driven waves in the dusk sector. Events are also detected near dawn however, and a variety of wave-particle interaction modes have been invoked. In this paper, the HF radar artificial backscatter technique is used to pro-vide a dataset for the study of particle-driven ULF waves of both symmetric and antisymmetric modes in the postnoon sector.
2 Instrumentation
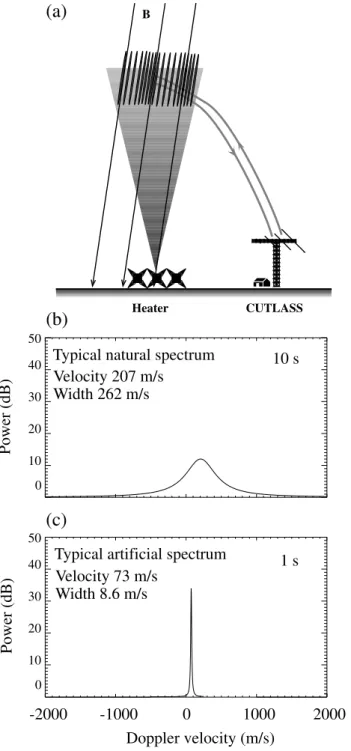
The data presented here result from the generation of artifi-cial ionospheric HF coherent backscatter. It is well known that the EISCAT Heating facility at Tromsø, Norway (Ri-etveld et al., 1993) is capable of generating artificial field-aligned irregularities using high power HF radio waves (e.g. Robinson, 1989). These irregularities are detectable by both incoherent and coherent scatter radars (e.g. Robinson et al., 1997). It is possible, given favourable ionospheric condi-tions, to modify the magnetosphere-ionosphere coupling con-ditions with facilities such as the Tromsø heater. Typically such experiments use modulated E region electrojet heating (e.g. Robinson et al., 2000). The present study involves unmodulated F region heating during quiet magnetospheric conditions, with the main electrojet currents lying far north of Tromsø. The action of the heater is thus restricted to increas-ing the backscatter cross-section which the F region iono-sphere offers to HF coherent radars. The CUTLASS (Co-operative UK Twin Located Auroral Sounding System) radar is an HF coherent backscatter radar system located at Han-kasalmi, Finland and Þykkvibær, Iceland, and forms part of the SuperDARN array (Greenwald et al., 1995). CUTLASS is ideally situated for making observations of the heated vol-ume over Tromsø (e.g. Bond et al., 1997; Eglitis et al., 1998), as shown schematically in Fig. 1a. Here data is presented from the SP-UK-OUCH (Observations of ULF waves with CUTLASS and the Heater; Wright and Yeoman, 1999b) ex-periment. In this experiment the CUTLASS radars run in a high temporal and spatial resolution mode, with Hankasalmi running a 6-beam scan (scanning beams 7 through to 2, inclu-sive) with an integration time of 1 s, whilst Þykkvibær runs a 3-beam scan (beams 13–15) with a 2 s integration period. Thus, both radars produce data with a temporal resolution of 6 s and both run in a high spatial resolution mode, with each radar having 75 range gates of 15 km length, centred on the heated volume at Tromsø. The EISCAT heater was in continuous operation at 50% power (using 6 X 80 kW trans-mitters, an ERP of ∼130 MW), at a frequency of ≈4 MHz for 4-hour intervals. The heater produces artificial electron density irregularities in the F region ionosphere, which act as targets for the HF radar. The artificial targets have been demonstrated to accurately track the natural ionospheric con-vection velocity, and the backscatter obtained is of very high power and very narrow spectral width. This allows a short integration time to be run on the radar, providing higher time resolution than is normally available. The narrow spectral widths also produce ionospheric electric field measurements of unprecedented accuracy (Yeoman et al., 1997; Wright and Yeoman, 1999a,b). Sample coherent and incoherent scatter spectra from natural and artificial irregularities are illustrated in Fig. 1b, c.
Data are also presented from the IMAGE (International Monitor for Auroral Geomagnetic Effects; Lühr, 1994)
mag-netometer station at Tromsø (TRO, location 69.7◦N, 18.9◦E
Heater CUTLASS B 0 10 20 30 40 50 0 10 20 30 40 50
Power (dB)
Power (dB)
Typical natural spectrum
Typical artificial spectrum
Velocity 73 m/s
Width 8.6 m/s
Velocity 207 m/s
Width 262 m/s
10 s
1 s
-2000
-1000
0
1000
2000
Doppler velocity (m/s)
(a)
(b)
(c)
Figure 1
Fig. 1. (a) A schematic of the artificial backscatter experiment, SP-UK-OUCH. The Tromsø heater continuously heats the F region ionosphere, creating artificial ionospheric irregularities. These are detected by the CUTLASS radars, operating in a high temporal and spatial resolution mode. (b) A typical HF radar spectrum, obtained from fitting to the autocorrelation function of backscatter from nat-ural F region irregularities after an integration period of 10 s. (c) A similar spectrum, but this time obtained from a 1 s integration from a heated F region. A narrower spectrum results, even from a shorter integration time.
3 Observations
During a four hour experimental run of the SP-UK-OUCH, the artificial backscatter technique has provided bistatic
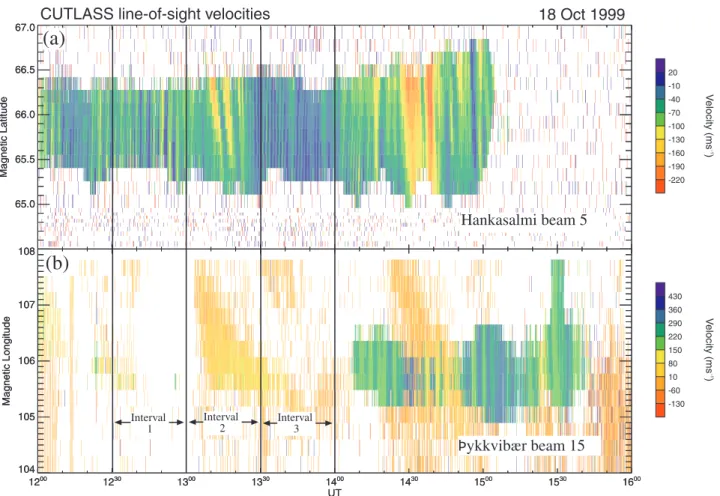
elec-tric field data during a complex period of wave activity. Un-precedented spatial, temporal and electric field resolution is achieved. Figure 2 presents a colour-coded representation (flow away from the radars (negative velocities) are colour coded red, with flow towards the radars (positive velocities) colour-coded blue) of the l-o-s (line-of-sight) velocity mea-sured by the CUTLASS Hankasalmi and Þykkvibær radars for several radar range gates over the complete four hour ex-periment. Figure 2a presents l-o-s velocity from beam 5 of the Hankasalmi radar. This beam points roughly meridion-ally, and the data is plotted as a function of magnetic lati-tude. Figure 2b presents l-o-s velocity from beam 15 of the Þykkvibær radar, which is directed roughly azimuthally east-wards, as a function of magnetic longitude. A region of the high latitude ionosphere of roughly one degree in both lat-itude and longlat-itude is illuminated by the EISCAT heater at Tromsø. Complex and variable wave activity is clear in data from both radars. The wave characteristics in three different intervals are examined here: Interval 1, a period of large-scale field line resonance activity; Interval 2, a period of low frequency, small-scale wave activity and Interval 3, a higher frequency, small-scale wave.
3.1 Interval 1: 1230–1300 UT
Interval 1 is presented in more detail in Fig. 3, which il-lustrates data from 1230–1300 UT. L-o-s velocity data only from Hankasalmi is presented, with the colour-coded veloc-ities from a number of range gates plotted as a function of magnetic latitude in panel 3a. Panel 3b presents the l-o-s velocities in a simple timeseries format, whilst panels 3c, d present X and Y component data from the underlying TRO magnetometer (which lies under range gate 32). The clear-est wave signature in this interval is between 1250 and 1300 UT, although higher frequency waves are detectable before this. A poleward phase progression can be observed in Fig. 3a, b and the longer period wave is also visible in both com-ponents of the Tromsø magnetograms. An analysis of the spectral power and phase of the wave is shown in Fig. 4. Figure 4a presents a Fourier power spectrum of the wave ob-served in the Hankasalmi velocity data from beam 5, range gate 28. The dominant Fourier component is at 5.7 mHz, al-though some evidence of higher frequency wave activity at
∼16 mHz is also apparent. The magnetic latitude profile of
Fourier power and phase deduced from the radar data at 5.7 mHz is shown in Fig. 4b. The wave shows some evidence of poleward phase propagation, and has an amplitude peak at the equatorward edge of the region of artificial scatter close
to 65.6◦ magnetic latitude. Only latitudes poleward of the
resonance location are within the artificial scatter region, and
this presumably precludes the observation of the full 180◦
phase change expected around resonance (e.g. Walker et al., 1979). Figure 4c illustrates a velocity hodogram formed from merging l-o-s velocities from the Hankasalmi and Þykkvibær radars. An elliptical, anticlockwise polarisation is seen (note that in this case the hodogram is for a later period of sim-ilar wave activity to Interval 1, for which data was
avail-65.0 65.5 66.0 66.5 67.0 Magnetic Latitude 65.0 65.5 66.0 66.5 67.0 Magnetic Latitude Hankasalmi beam 5 -220 -190 -160 -130 -100 -70 -40 -10 20 V elocity (ms -1 ) 1200 1230 1300 1330 1400 1430 1500 1530 1600 UT 104 105 106 107 108 Magnetic Longitude 1200 1230 1300 1330 1400 1430 1500 1530 1600 UT 104 105 106 107 108 Magnetic Longitude
CUTLASS line-of-sight velocities 18 Oct 1999
-130 -60 10 80 150 220 290 360 430 V elocity (ms -1 ) Þykkvibær beam 15 Interval 1 Interval 2 Interval 3
(a)
(b)
Fig. 2. An overview of the CUTLASS l-o-s velocity data for the run of the SP-UK-OUCH from 1200–1600 UT on 18 October, 1999. (a) Beam 5 velocities from Hankasalmi, Finland as a function of geomagnetic latitude. (b) Beam 15 velocities from Þykkvibær, Iceland as a function of geomagnetic longitude. The velocities are colour-coded such that flow away from the radar (negative velocities) are indicated in red and flow toward the radar (positive velocities) are indicated in blue. The three intervals of data which will be examined further are indicated with solid vertical lines.
able from both Hankasalmi and Þykkvibær). A comparison of beams 4 and 5 of the Hankasalmi radar, and azimuthally separated stations of the IMAGE magnetometer array reveals that the wave has an azimuthal wavenumber, m = +6 ± 3, i.e. an eastward phase propagation, in the direction of the solar wind flow. This wave is interpreted as a fundamental,
large-scale toroidal field line resonance centred near 65.6◦
magnetic latitude. The smaller wave at 16 mHz has a simi-lar low m-number and is interpreted as a harmonic of the 5.7 mHz large-scale toroidal wave. This smaller amplitude wave is not detected by the ground magnetometer at Tromsø.
3.2 Interval 2: 1300–1330 UT
Interval 2 is presented in the same format as Interval 1 in Figs. 5 and 6, covering 1300–1330 UT. The wave in Inter-val 2 shows a clear equatorward phase propagation (Fig. 5a, b). It is only very weakly present in the Tromsø magnetome-ter records (Fig. 5c, d). The characmagnetome-teristics of the wave in the radar data are examined in detail in Fig. 6. The Fourier power spectrum in Fig. 6a shows a dominant frequency in this interval of 3.8 mHz. The magnetic latitude profile of
Fourier power and phase between 2.8–3.8 mHz (Fig. 6b) confirms the strong equatorward phase propagation, and the wave can be seen to have a maximum amplitude at or above the poleward edge of the region of artificial backscatter at
66.0◦ magnetic latitude. A comparison of beams 4 and 5
of the Hankasalmi radar reveals an azimuthal wavenumber,
m = −35 ± 6. The wave thus has an effective azimuthal wavenumber much larger than the Interval 1 wave, and prop-agates westward in a direction opposite to the solar wind flow, but in the direction of gradient-curvature drifting pro-tons. The merged velocity hodogram from a subset of Inter-val 2 in Fig. 6c shows the wave to have a more linear polar-isation than the large scale waves similar to those examined in Interval 1, but again have anticlockwise polarisation.
3.3 Interval 3: 1330–1400 UT
Interval 3 is again presented in the same format as Interval 1 and 2, in Figs. 7 and 8, covering 1330–1400 UT. The wave in Interval 3 shows a poleward phase propagation (Fig. 7a, b). It is not visible in the Tromsø magnetometer records (Fig. 7c, d). The characteristics of the wave in the radar
65.0 65.5 66.0 66.5 67.0 Magnetic Latitude 65.0 65.5 66.0 66.5 67.0 Magnetic Latitude -220 -190 -160 -130 -100 -70 -40 -10 20 V elocity (ms -1 ) Beam 5, ranges 26 27 28 29 30 31 0 500 1000 1500 V elocity (ms -1) (increment = 300) -15 -10 -5 0 5 X (nT) -8 -6 -4 -2 0 2 4 Y (nT) 1230 1235 1240 1245 1250 1255 UT 26 28 30 32 Range gate 18 Oct 1999 Tromsø magnetometer Hankasalmi beam 5 l-o-s velocity
(a)
(b)
(c)
(d)
Figure 3
Fig. 3. Interval 1, 1230–1300 UT: (a) Beam 5 velocities from Hankasalmi, Finland as a function of geomagnetic latitude. The velocities are colour-coded such that flow away from the radar (negative velocities) are indicated in red and flow toward the radar (pos-itive velocities) are indicated in blue. Radar range gate is also indicated on the right. (b) A timeseries representation of the velocity measurements in (a). (c) X and (d) Y component magnetograms from the TRO magnetometer. The mag-netometer lies under range gate 32.
Hankasalmi beam 5 los velocity -Fourier amplitude and phase vs. latitude 1240-1300 UT 5.7 mHz
Power Spectrum Hankasalmi Beam 5, Gate 28 1240-1300 UT
1413-1430 UT: Hankasalmi b5, r30; Pykkvibær b15, r38, Filter 276-316 s Merged Velocity Hodogram
(a)
(b)
(c)
Figure 4
0 50 100 150 200 250 0 5 10 15 20 Frequency (mHz)Spectral Power (Arb. Units)
0 50 100 150 200 250 300 Power (Arb. Units) 65.2 65.4 65.6 65.8 66.0 66.2 66.4 Magnetic latitude -100 0 100 Phase (degrees) -10 -5 0 5 E-W Component (m s-1) -10 -5 0 5 N-S Component (m s -1)
Fig. 4. Interval 1. (a) Fourier power spectrum, (b) magnetic latitude profile of Fourier power and phase, (c) merged velocity hodogram (note the hodogram is for a later period of similar wave activity to Interval 1, for which data was available from both Hankasalmi and Þykkvibær).
65.0 65.5 66.0 66.5 67.0 Magnetic Latitude 65.0 65.5 66.0 66.5 67.0 Magnetic Latitude -220 -190 -160 -130 -100 -70 -40 -10 20 V elocity (ms -1 ) Beam 5, ranges 26 27 28 29 30 31 500 1000 1500 V elocity (ms -1) (increment = 300) -4 -2 0 2 4 6 8 X (nT) -10 -5 0 5 Y (nT) 1300 1305 1310 1315 1320 1325 UT 26 28 30 32 Range gate 18 Oct 1999 Tromsø magnetometer Hankasalmi beam 5 l-o-s velocity
(a)
(b)
(c)
(d)
Figure 5
Fig. 5. Interval 2, 1300–1330 UT. For-mat as for Fig. 3.
Hankasalmi beam 5 los velocity -Fourier amplitude and phase vs. latitude 1305-1325 UT 2.8-3.8 mHz
0 20 40 60 80 100 120 Power (Arb. Units) 65.2 65.4 65.6 65.8 66.0 66.2 66.4 Magnetic latitude -100 0 100 Phase (degrees) Power Spectrum
Hankasalmi Beam 5, Gate 28 1305-1325 UT 0 20 40 60 80 100 120
Spectral Power (Arb. Units)
0 5 10 15 20
Frequency (mHz)
1308-1324 UT: Hankasalmi b5, r30; Pykkvibær b15, r38, Filter 300-340 s Merged Velocity Hodogram
-10 -5 0 5 10 -10 -5 0 5 10
(a)
(b)
(c)
Figure 6
E-W Component (m s-1) N-S Component (m s -1)65.0 65.5 66.0 66.5 67.0 Magnetic Latitude 65.0 65.5 66.0 66.5 67.0 Magnetic Latitude -130 -110 -90 -70 -50 -30 -10 10 30 V elocity (ms -1 ) Beam 5, ranges 26 27 28 29 30 31 0 500 1000 1500 V elocity (ms -1) (increment = 300) 18 Oct 1999 -5 0 5 10 15 X (nT) -4 -2 0 2 4 Y (nT) 1330 1335 1340 1345 1350 1355 UT 26 28 30 32 Range gate Tromsø magnetometer Hankasalmi beam 5 l-o-s velocity
(a)
(b)
(c)
(d)
Figure 7
Fig. 7. Interval 3, 1330–1400 UT. For-mat as for Fig. 3.
Hankasalmi beam 5 los velocity -Fourier amplitude and phase vs. latitude 1330-1350 UT 14.3-15.4 mHz
0 20 40 60 Power (Arb. Units) 65.2 65.4 65.6 65.8 66.0 66.2 66.4 Magnetic latitude -100 0 100 Phase (degrees) 0 20 40 60 80 100 0 5 10 15 20 Frequency (mHz) Hankasalmi Beam 5, Gate 28 1330-1350 UT
Spectral Power (Arb. Units)
Power Spectrum
1330-1334 UT: Hankasalmi b5, r30; Pykkvibær b15, r38, Filter 70-90 s Merged Velocity Hodogram
-10 -5 0 5 -10 -5 0 5
(a)
(b)
(c)
Figure 8
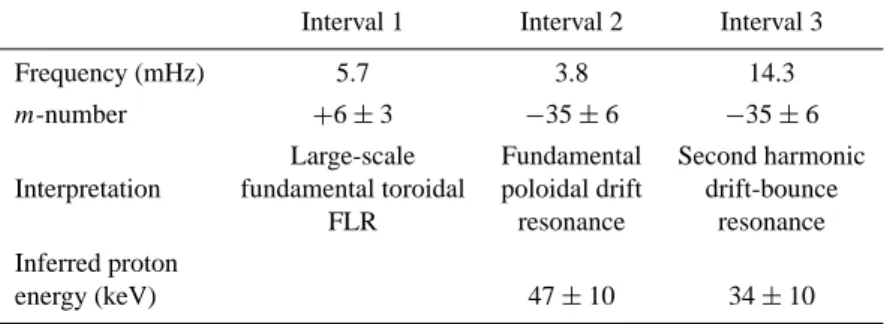
E-W Component (m s-1) N-S Component (m s -1)Table 1. Summary of the ULF wave parameters and their interpretation in terms of wave energy source, for the three intervals under study Interval 1 Interval 2 Interval 3
Frequency (mHz) 5.7 3.8 14.3
m-number +6 ± 3 −35 ± 6 −35 ± 6
Large-scale Fundamental Second harmonic Interpretation fundamental toroidal poloidal drift drift-bounce
FLR resonance resonance Inferred proton
energy (keV) 47 ± 10 34 ± 10
data are examined in detail in Fig. 8. The Fourier power spectrum in Fig. 8a shows a dominant frequency in this in-terval of 14.3 mHz. The magnetic latitude profile of Fourier power and phase between 14.3 − 15.4 mHz (Fig. 8b) con-firms the poleward phase propagation, and the wave can be
seen to have a maximum amplitude close to 65.7◦magnetic
latitude. A comparison of beams 4 and 5 of the Hankasalmi radar again reveals an azimuthal wavenumber, m = −35 ± 6. The wave thus has an effective azimuthal wavenumber much larger than the Interval 1 wave, but very similar to the wave in Interval 2, and again in a direction opposite to the solar wind flow, but in the direction of gradient-curvature drifting protons. The merged velocity hodogram from a subset of Interval 3 in Fig. 8c shows the wave to have a very linear polarisation.
4 Discussion
The artificial backscatter technique has provided an extended interval of very high resolution ionospheric velocity data, which has allowed the accurate characterisation of wave pa-rameters such as frequency, latitudinal evolution of Fourier phase and amplitude, and wave polarisation within the iono-sphere for 3 different, naturally-occurring ULF waves. These wave characteristics, described in Sect. 3, have revealed three very different wave types, occurring within 1.5 hours. Taken individually, each wave type would be difficult to interpret unambiguously. Here the three intervals will be considered in turn and in combination, in order to provide a convincing explanation of the complete interval. The wave parameters and interpretation for the three intervals are summarised in Table 1.
4.1 Interval 1: large-scale field line resonance
Interval 1 (Fig. 3) has a frequency of 5.7 mHz and an az-imuthal wavenumber, m = +6, indicating phase propagation in the solar wind flow direction. It is thus a large scale wave and as such, it is also observed by the IMAGE magnetometer at Tromsø. This wave is interpreted as a fundamental, large-scale toroidal field line resonance with an energy source ex-ternal to the magnetosphere. The wave is not of great
inter-est in itself, but in the interval under study it does provide an evaluation of the fundamental toroidal eigenfrequency of
the field line at 65.6◦ magnetic latitude, which provides an
invaluable context for the very different wave types which follow directly after Interval 1. In order to make predictions as to the frequencies of other possible wave modes in the ar-tificial scatter, numerical solutions of the MHD equations for the ratios of toroidal and poloidal eigenfrequencies and har-monics for a dipole field at the latitude of geosynchronous orbit are employed (Cummings et al., 1969). Cummings and co-authors presented tabulated frequencies for the first
6 harmonics for radial plasma density models r−n, where
0 ≤ n ≤ 6. These predict that for a toroidal fundamental
resonance frequency of 5.7 mHz at 65.6◦magnetic latitude,
the corresponding second and third harmonic frequencies lie between 11.8–15.3 mHz and 17.5–24.6 mHz, respectively, for both the toroidal and poloidal mode (the range of values being a function of the plasma density model adopted). The fundamental poloidal frequency at this latitude is calculated to be 4.2 mHz (this value is insensitive to the plasma density model). A correction of ∼10% would apply for resonances occurring at the poleward edge of the artificial scatter region due to the longer field lines connecting to this region (Mathie et al., 1999) and thus, leading to a predicted poloidal eigen-frequency in that location of 3.8 mHz.
4.2 Interval 2: drift resonance
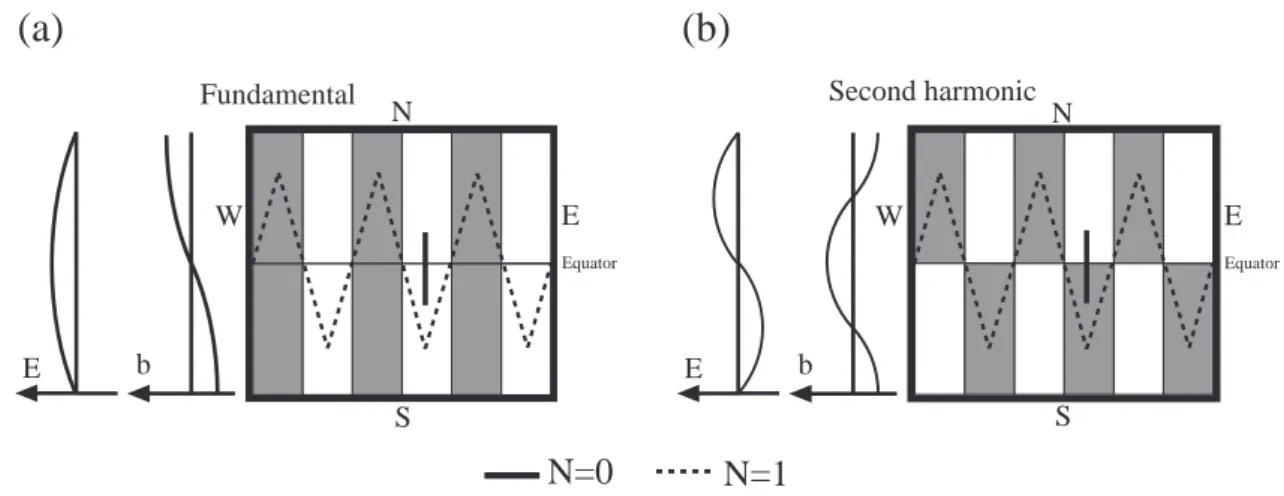
Interval 2 (Fig. 5) has a wave with a frequency of 3.8 mHz and an azimuthal wavenumber m = −35, and shows clear equatorward phase motion. The wave thus has azimuthal phase propagation opposite to the solar wind flow, but in the direction of gradient-curvature drifting protons. The fre-quency of this wave lies in the region expected for the damental poloidal mode, as deduced in Sect. 4.1. The fun-damental poloidal wave is thought to be driven by drift res-onance with westward moving, large pitch angle protons as suggested by Southwood and Kivelson (1982), and illustrated schematically in Fig. 9a. Interaction with the fundamental wave which has a symmetrical electric field is probably the only viable mode for drift resonance. The interaction will be strongest for large pitch angle protons which are confined near the equator where the wave electric field is strongest.
N=1
N=0
Fundamental N S W Equator E E b Second harmonic E b N S W Equator EFigure 9
(a)
(b)
Fig. 9. Trajectories of two ions (solid and dashed lines) in the wave rest frame. Shaded and unshaded regions represent positive and negative electric field respectively. The ions indicated with a solid line are in resonance with the N = 0 drift mode, and the ions represented by the dashed line with the N = 1 drift-bounce resonance (after Southwood and Kivelson, 1982).
Using the drift resonance equation (e.g. Hughes, 1983) the angular frequencies of the azimuthal evolution of the wave,
ωwaveand particles, ωdriftmay be related by
ωwave #2=mwave #2ωdrift.So ωdrift= (ω/m)wave #2. (2)
This gives a value for ωdrift of 6.8 · 10−4rad s−1. An
ex-pression of the angular frequency of drifting protons in the Earth’s reference frame as a function of proton energy has been given by Chisham (1996) as
ωdrift= − 6W L(0.35 + 0.15 sin α) BsRE2 +90(1 − 0.159Kp +0.0093Kp2)−3L3sin φ BsRE2 , (3) where W is the proton energy in eV, L is the proton’s L-shell,
Bsis the equatorial surface magnetic field strength, REis the
radius of the Earth, α is the proton equatorial pitch angle,
φthe azimuth of the particle measured anticlockwise from
local midnight and Kp the planetary magnetic activity
in-dex. The first term on the right hand side of Eq. 3 represents gradient-curvature drift and the second E × B drift under a model magnetospheric potential. Where the actual magneto-spheric electric field can be estimated from measured iono-spheric electric fields from radar data, as in this example, the equation may be replaced with
ωdrift= − 6W L(0.35 + 0.15 sin α) BsRE2 + EL 2 BsRE (4) (Chisham et al., 1992), where E is the magnetospheric elec-tric field. In the example presented here, Eqs. 3 and 4 give consistent results and suggest that the energy of drifting pro-tons which might drive the Interval 2 wave via drift resonance is 47 ± 10 keV for large pitch angle protons.
4.3 Interval 3: drift-bounce resonance
Interval 3 (Fig. 7) has a wave with a frequency of 14.3 mHz and an azimuthal wavenumber, m = −35. The wave thus
has azimuthal phase propagation opposite to the solar wind flow, but in the direction of gradient-curvature drifting pro-tons, as is the case for Interval 2. The frequency of this wave lies in the region expected for the second harmonic poloidal mode, as deduced in Sect. 4.1. The second har-monic poloidal wave is thought to be driven by drift-bounce resonance with westward moving, small pitch angle protons as suggested by Southwood and Kivelson (1982), and illus-trated schematically in Fig. 9b. If a drifting energetic proton population is to provide an energy source for Interval 3, then it must be able to satisfy the drift-bounce resonance condi-tion, Eq. 1. This condition can only be met for N = ±1 for wave modes with antisymmetric electric fields. The in-teraction will be the strongest for particles of smaller pitch angles, which spend appreciable amounts of time near the wave electric field antinodes.
The drift angular frequencies for particles with small pitch angles can again be evaluated as a function of particle energy using Eqs. (3) or (4). The bounce angular frequencies for such particles are given by
ωb= π √ W p2mpLRE(1.3 − 0.56 sin α) (5) (Glassmeier et al., 1999; Schulz and Lanzerotti, 1974), where
mpis the proton mass. Substituting these values into Eq. (1)
for N = +1 yields a quadratic equation in
√
W. Solution of
this quadratic yields a proton energy of 34±10 keV for small pitch angle particles. Substitution back into Eqs. (2) and (4) gives a value for the drift and bounce angular frequencies of
ωdrift=4.6 ± 0.9 · 10−4rad s−1and ωb =0.09 ± 0.02 rad
s−1, respectively. In fact, using Eqs. 3 or 4 for the
pro-tons of 47 keV associated with Interval 2, but with small pitch angles, gives a slightly reduced angular frequency of
ωdrift =5.5 · 10−4rad s−1(compared to the 6.8 · 10−4rad
s−1 deduced from Eq. 2 above for interval 2). Thus, we
conclude that we need a positive slope in the proton distribu-tion funcdistribu-tion in the region 35–45 keV to explain the observed
wave behaviours in both Interval 2 and Interval 3. Further-more, the pitch angle dependence of the drift period of the protons is consistent with the arrival of large pitch angle par-ticles slightly in advance of smaller pitch angle parpar-ticles, and thus the driving of the drift mode (Interval 2) slightly before the drift-bounce mode (Interval 3), as is observed.
4.4 Relationship with previous observations
Of the previously reported ground-based observations of ULF waves, the waves identified in Intervals 2 and 3 of the ported run of the SP-UK-OUCH experiment most closely re-semble those identified in naturally occurring coherent radar backscatter. The spatial resolution of such radars is ∼15 km and thus these instruments are much more sensitive to small-scale waves than ground magnetometers. Such small-small-scale waves observed by coherent radar have previously been clas-sified as storm-time Pc5s (Allan et al., 1982, 1983; Walker et al., 1982) and equatorward propagating Pc5s (Grant et al., 1992; Yeoman et al., 1992). Storm time Pc5 waves are thought to have an energy source in gradient-drifting ener-getic particles in the dusk sector during disturbed times, and are generally interpreted as examples of drift resonance, al-though Allan et al. (1983) pointed out that no one generation mechanism was able to explain all the observed wave char-acteristics. A similar interpretation was placed on the dusk sector equatorward propagating waves observed by Yeoman et al. (1992) and Grant et al. (1992). Gradient-curvature drift for protons with energies in the range 35–70 keV were deduced to be the driving mechanism for the storm time Pc5 pulsations of Allan et al. (1982, 1983). Such particle popu-lations are also consistent with the equatorward propagating Pc5 pulsations observed by Yeoman et al. (1992) and Grant et al. (1992). The wave observed here in Interval 2 is fully in accord with these observations and their interpretation, pro-viding high time resolution bistatic data of an equatorward propagating drift wave in the dusk sector. The wave polar-isation observed here was near-linear with the polarpolar-isation ellipse tilted north-west to south-east. This is also very sim-ilar to the bistatic radar results of Allan et al. (1982, 1983), Grant et al. (1992) and Walker et al. (1982). Walker et al. (1982) mapped such polarisation ellipses out into the equa-torial plane magnetosphere and demonstrated that they were consistent with poloidal wave modes. In Intervals 2 and 3 the ULF waves had a weak or non-existent signature in ground magnetometer data, as small-scale waves suffer attenuation through the ionosphere. This is again consistent with pre-vious results. Related spacecraft observations include those from Kokubun (1985), Anderson et al. (1990), Engebret-son et al. (1992) and Lessard et al. (1999) who observed Pc5 band ULF waves in the magnetosphere which were most common at dusk and were most likely storm-time Pc5 pul-sations. At lower occurrence rates, events have also been observed in the dawn region within the magnetosphere and their relative occurrences have been discussed by Yeoman et al. (2000).
The wave in Interval 3, in contrast, appears to result from a
second harmonic due to bounce-resonance interactions. This wave resembles ground-based magnetometer observations of giant pulsations (Pg) which have a similar m-number (Chis-ham and Orr, 1991). Pg events have also been observed by auroral radar (Chisham et al., 1992) and occur in the morn-ing sector in the 02–07 MLT interval, peakmorn-ing in the range 03–06 MLT. A drift-bounce resonance interaction with an antisymmetric wave mode in the quiet time ring current has been suggested as the likely mechanism causing this type of ULF wave (e.g. Chisham and Orr, 1991), although Pgs have also been related to drift-bounce resonance mechanisms with symmetric wave modes (e.g. Takahashi et al., 1992). Sim-ilar events in the morning sector, detected by DOPE, were reported by Yeoman et al. (2000). The spatial resolution of the DOPE sounder is ∼4 km (Wright et al., 1997) and thus it has the ability to detect ULF wave signatures with very small spatial scale sizes. These events were charac-terised by higher m-numbers (∼–90), and the wave particle interaction mode responsible for their generation is, as yet, unclear. Studies directed more towards the investigation of individual events have also provided related measurements from space, and a small number of direct measurements of
min space have been reported as well. Hughes et al. (1979)
described multiple satellite observations of a high frequency (18.2 mHz) compressional wave at geostationary orbit in the dusk to midnight local time sector. The wave number m was calculated to be −100. Hughes et al. (1979) deduced that the wave was a second harmonic standing wave which led to their interpretation of the driving mechanism being a bounce resonance interaction with ring current protons of energy 1– 10 keV. A similar interpretation was placed on a wave with a frequency of 5 mHz and |m| ∼ 110 in the postnoon sector studied by Takahashi et al. (1990). These events appear to be similar to the Interval 3 event identified here, although with a higher m-number.
Takahashi et al. (1985) made multi-spacecraft measure-ments of ULF waves in the frequency range 1–3 mHz. These workers were able to directly measure the azimuthal wave-numbers in the magnetosphere for a number of wave events, finding m = −40 . . . − 120, which is similar to those pre-sented here. The distribution of such events found by Taka-hashi et al. (1985) was symmetrical about noon. Woch et al. (1990) presented a study of compressional events observed at geostationary orbit. Two populations of events were iden-tified, one being a “diamagnetic" population, which occurred during an increase in the measured ion intensities, and was concentrated at the dusk sector. The second population was termed a “non-diamagnetic" population, which was not asso-ciated with recently injected particles, and was concentrated on the dawn flank. Both populations were interpreted as be-ing antisymmetric modes.
The interval presented here demonstrates that the dusk sec-tor is a region where drift resonance is a viable source of wave energy in the Pc5 band, as expected. What the data also demonstrates is that bounce-resonance interactions can also occur in the same region. The ground-based technique of artificial radar backscatter opens a new window on such
events, and bounce-resonance waves in the postnoon sector with m ∼ −35 are reported. It appears that a drifting particle population with a positive gradient in its proton distribution function can couple to ULF wave modes of both fundamen-tal and second harmonic frequencies. The slower drifting larger pitch angle particles interact first with the fundamen-tal, with the slightly delayed small pitch angle element of the population finding a preferred wave-particle interaction with the second harmonic slightly later on. Wright and Yeoman (1999a) presented an example of a high-m wave in artifi-cial backscatter which appeared to be a harmonic of a pre-existing large-scale wave. They suggested that this might be an example of the seeding of high-m waves by low-m waves, as suggested by Allan and Wright (1997), although at a har-monic, rather than at the fundamental. The present observa-tion strengthens this interpretaobserva-tion, with the low-m wave co-existing with both fundamental and second harmonic high-m modes. In addition, a mechanism for the evolution from the high-m fundamental to the second harmonic has been sug-gested in the differential drift speeds of gradient-curvature particles of different pitch angles. The observation of both drift resonance and drift-bounce resonance interactions in the dusk sector has implications for the interpretation of the in-teractions responsible for previous and future observations of ULF waves driven by wave particle interactions in this sec-tor. The dawn sector, in contrast, appears to be dominated by bounce-resonance interactions. Future observations will be able to determine if drift resonances are sustainable in the dawn region.
5 Summary
The artificial backscatter technique has provided an interval of bistatic ionospheric electric field data during a complex period of wave activity. Unprecedented spatial, temporal and electric field resolution is achieved. A large-scale (low-m) field line resonance is observed, and gives the fundamental toroidal eigenfrequency as 5.7 mHz. Subsequently, small-scale (high-m) particle-driven waves are also observed at fre-quencies of 3.8 and 14.3 mHz, near the expected frefre-quencies of the fundamental and second harmonic poloidal modes, as deduced from the large-scale field line resonance observa-tions. These two waves are consistent with a drift wave and a bounce-resonance energy source, respectively, with a driving particle population at 35–45 keV. It appears that the postnoon sector can support both drift resonance and drift-bounce res-onance interactions for waves with m ∼ −35.
Acknowledgements. The authors thank the director and staff of
EIS-CAT for the operation of the Tromsø heater facility. EISEIS-CAT is an international facility funded collaboratively by the research coun-cils of Finland (SA), France (CNRS), the Federal Republic of Ger-many (MPG), Japan (NIPR), Norway (NAVF), Sweden (NFR) and the United Kingdom (PPARC). The SuperDARN Hankasalmi and Þykkvibær HF radars are deployed and operated by the University of Leicester, and funded by the PPARC (Grant number PPA/R/R/ 1997/00256), the Finnish Meteorological Institute, and the Swedish
Institute for Space Physics. IMAGE data were kindly supplied by the Finnish Meteorological Institute. DMW is supported on PPARC Grant number PPA/G/O/1997/000254.
Topical Editor G. Chanteur thanks W. Allan and M. Hudson for their help in evaluating this paper.
References
Allan, W. and Wright, A. N., Large-m waves generated by small-m field line resonances via the nonlinear Kelvin-Helmholtz insta-bility, J. Geophys. Res., 102, 19927, 1997.
Allan, W., Poulter, E. M., and Nielsen, E., STARE observations of a Pc5 pulsation with large azimuthal wave number, J. Geophys. Res., 87, 6163, 1982.
Allan, W., Poulter, E. M., and Nielsen, E., Pc5 pulsations associ-ated with ring current proton drifts: STARE radar observations, Planet. Space Sci., 31, 1279, 1983.
Anderson, B. J., Engebretson, M. J., Rounds, S. P., Zanetti, L. J., and Potemra, T. A., A statistical study of Pc 3–5 pulsations ob-served by the AMPTE/CCE magnetic fields experiment. 1. Oc-currence distributions, J. Geophys. Res., 95, 10495, 1990. Bond, G. E., Robinson, T. R., Eglitis, P., Wright, D. M., Stocker, A.
J., Reitveld, M. T., and Jones, T. B., Spatial observations by the CUTLASS coherent scatter radar of ionospheric modification by high power radio waves, Annales Geophysicae, 15, 1412, 1997. Chisham, G., Giant pulsations: An explanation for their rarity
and occurrence during geomagnetically quiet times, J. Geophys. Res., 101, 24755, 1996.
Chisham, G. and Orr, D., Statistical studies of giant pulsations (Pgs): harmonic mode, Planet. Space Sci., 39, 999, 1991. Chisham, G., Orr, D., and Yeoman, T. K., Observations of a giant
pulsation across an extended array of ground magnetometers and on auroral radar, Planet. Space Sci., 40, 953, 1992.
Cummings, W. D., O’Sullivan, R. J., and Coleman Jr., P. J., Stand-ing Alfvén waves in the magnetosphere, J. Geophys. Res., 74, 778, 1969.
Eglitis, P., Robinson, T. R., Rietveld, M. T., Wright, D. M., and Bond, G. E., The phase speed of artificial irregularities observed by CUTLASS during HF modification of the auroral ionosphere, J. Geophys. Res., 103, 2253, 1998.
Engebretson, M. J., Murr, D. L., Erickson, K. N., Strangeway, R. J., Klumpar, D. M., Fuselier, S. A., Zanetti, L. J., and Potemra, T. A., The spatial extent of radial magnetic pulsation events ob-served in the dayside near synchronous orbit, J. Geophys. Res., 97, 13741, 1992.
Glassmeier, K.-H., Buchert, S., Motschmann, U., Korth, A., and Pedersen, A., Concerning the generation of geomagnetic giant pulsations by drift-bounce resonance ring current instabilities, Ann. Geophysicae, 17, 338, 1999.
Grant, I. F., McDiarmid, D. R., and. McNamara, A. G, A class of high-m pulsations and its auroral radar signature, J. Geophys. Res., 97, 8439, 1992.
Greenwald, R. A., Weiss, W., Nielsen, E., and Thomson, N. P., STARE: A new radar auroral backscatter experiment in northern Scandinavia, Radio Sci., 13, 1021, 1978.
Greenwald, R. A. et al., DARN/SUPERDARN A global view of the dynamics of high- latitude convection, Space Sci. Rev., 71, 761, 1995.
Hughes, W. J., Hydromagnetic waves in the magnetosphere, So-lar Terrestrial Physics (edited by R. L. Carovillano and J. M. Forbes), Reidel, Dordrecht, 1983.
Hughes, W. J. and Southwood, D. J., The screening of micropulsa-tion signals by the atmosphere and ionosphere, J. Geophys. Res., 81, 3234, 1976.
Hughes, W. J., McPherron, R. L., Barfield, J. N., and Mauk, B. H., A compressional Pc4 pulsation observed by three satellites in geostationary orbit near local midnight, Planet. Space Sci., 27, 821, 1979.
Kokubun, S., Statistical characteristics of Pc5 waves at geostation-ary orbit, J. Geomag. Geoelectr., 37, 759, 1985.
Lessard, M. R., Hudson, M. K., and Lühr, H., A statistical study of Pc 3 – Pc 5 magnetic pulsations observed by the AMPTE/Ion Release Module satellite, J. Geophys. Res., 104, 4523, 1999. Lühr, H., The IMAGE magnetometer network, STEP International
Newsletter, 4, 4, 1994.
Mathie, R. A., Menk, F. W., Mann, I. R., and Orr, D., Discrete field line resonances and the Alfvén continuum in the outer magneto-sphere, Geophys. Res. Lett., 26, 659, 1999.
McNamara, A. G. , McDiarmid, D. R., Sofko, G. J., Koeler, J. A., Forsyth, P. A., and Moorcroft, D. R., BARS – a dual bistatic au-roral radar system for the study of electric fields in the Canadian sector of the auroral zone, Adv. Space Res., 2, 145, 1983. Nielsen, E., Guttler, W., Thomas, E. C., Stewart, C. P., Jones, T.
B., and Hedburg, A., SABRE – new radar-auroral backscatter experiment, Nature, 304, 712, 1983.
Rietveld, M. T., Kohl, H., Kopka, H., and Stubbe, P., Introduction to ionospheric heating at Tromsø – I. Experimental overview, J. Atmos. Terr. Phys., 55, 577, 1993.
Robinson, T. R., The heating of the high latitude ionosphere by high power radio waves, Phys. Rep., 179, 79–209, 1989.
Robinson, T. R., Stocker, A. J., Bond, G. E., Eglitis, P., Wright, D. M., and Jones, T. B., O- and X-mode heating effects observed simultaneously with the CUTLASS and EISCAT radars and low power HF diagnostics at Tromsø, Annales Geophysicae, 15, 134, 1997.
Robinson, T. R., Strangeway, R., Wright, D. M., Davies, J. A., Horne, R. B., Yeoman, T. K., Stocker, A. J., Lester, M., Rietveld, M. T., Mann, I. R., Carlson, C. W., and McFadden, J. P., FAST observations of ULF waves injected into the magnetosphere by means of modulated RF heating of the auroral electrojet, Geo-phys. Res. Lett., 27, 3165, 2000.
Schulz, M. and Lanzerotti, L. J., Particle diffusion in the radiation belts, Springer-Verlag, Berlin, Heidelberg, New York, 1974. Southwood, D. J., A general approach to low-frequency instability
in the ring current plasma, J. Geophys. Res., 81, 3340, 1976.
Southwood, D. J. and Kivelson, M. G., Charged particle behavior in low-frequency geomagnetic pulsations, 2. Graphical approach, J. Geophys. Res., 87, 1707, 1982.
Southwood, D. J., Dungey, J. W., and Etherington, R. J., Bounce resonant interactions between pulsations and trapped particles, Planet. Space Sci., 17, 349, 1969.
Takahashi, K., Higbie, P. R., and Baker, D. N, Characteristics of compressional Pc5 waves observed at geostationary orbit, J. Geo-phys. Res., 90, 1473, 1985.
Takahashi, K., McEntire. R. W., Lui, A. T. Y., and Potemra, T. A., Ion flux oscillations associated with a radially polarised trans-verse Pc5 magnetic pulsation, J. Geophys. Res., 95, 3717, 1990. Takahashi, K., Sato, N., Warnecke, J., Lühr, H., Spence, H. E., and Tonegawa, Y., On the standing wave mode of giant pulsations, J. Geophys. Res., 97, 10,717, 1992.
Walker, A. D. M., Greenwald, R. A., Stuart, W. F., and Green, C. A., STARE auroral radar observations of Pc5 geomagnetic pul-sations, J. Geophys. Res., 84, 3373, 1979.
Walker, A. D. M., Greenwald, R. A., Korth, A., and Kremser, G., STARE and GEOS-2 observations of a storm time Pc5 ULF pul-sation, J. Geophys. Res., 87, 9135, 1982.
Woch, J., Kremser, G., and Korth, A., A comprehensive investiga-tion of compressional ULF waves observed in the ring current, J. Geophys. Res., 95, 15113, 1990.
Wright, D. M. and Yeoman, T. K., CUTLASS observations of a high-m ULF wave and its consequences for the DOPE HF Doppler sounder, Ann. Geophysicae, 17, 1493–1497, 1999a. Wright, D. M. and Yeoman, T. K., High resolution bistatic radar
observations of ULF waves in artificially generated backscatter, Geophys. Res. Lett., 26, 2825–2828, 1999b.
Wright, D. M., Yeoman, T. K., and Chapman, P. J., High-latitude HF Doppler observations of ULF waves: 1. Waves with large spatial scale sizes, Ann. Geophysicae, 15, 1548, 1997.
Yeoman, T. K., Tian, M., Lester, M., and Jones, T. B., A study of Pc5 hydromagnetic waves with equatorward phase propagation, Planet. Space Sci., 40, 797, 1992.
Yeoman, T. K., Wright, D. M., Robinson, T. R., Davies, J. A., and Rietveld, M. T., High spatial and temporal resolution observa-tions of an impulse-driven field line resonance in radar backscat-ter artificially generated with the Tromsø heabackscat-ter, Ann. Geophys-icae, 15, 634, 1997.
Yeoman, T. K., Wright, D. M., Chapman, P. J., and Stockton-Chalk, A. B., High-latitude observations of ULF waves with large az-imuthal wavenumbers, J. Geophys. Res., 105, 5453–5462, 2000.