HAL Id: insu-01311008
https://hal-insu.archives-ouvertes.fr/insu-01311008
Submitted on 3 May 2016
HAL is a multi-disciplinary open access
archive for the deposit and dissemination of
sci-entific research documents, whether they are
pub-lished or not. The documents may come from
teaching and research institutions in France or
abroad, or from public or private research centers.
L’archive ouverte pluridisciplinaire HAL, est
destinée au dépôt et à la diffusion de documents
scientifiques de niveau recherche, publiés ou non,
émanant des établissements d’enseignement et de
recherche français ou étrangers, des laboratoires
publics ou privés.
hysteresis projection, illustrated with a study of
limestones
Graham Borradaile, France Lagroix
To cite this version:
Graham Borradaile, France Lagroix. Magnetic characterization using a three-dimensional hysteresis
projection, illustrated with a study of limestones. Geophysical Journal International, Oxford
Univer-sity Press (OUP), 1999, 141 (1), pp.213-226. �10.1046/j.1365-246X.2000.00066.x�. �insu-01311008�
Magnetic characterization using a three-dimensional hysteresis
projection, illustrated with a study of limestones
Graham J. Borradaile and France Lagroix
Department of Geology, L akehead University, T hunder Bay, Ontario P7B 5E1, Canada. E-mail: [email protected]
Accepted 1999 November 10. Received 1999 November 1; in original form 1999 July 30
S U M M A R Y
Limestones provide an important source of palaeomagnetic information despite their low content of submicroscopic remanence-bearing minerals. The chief sources of these minerals are thought to be clastic volcanic magnetite and titanomagnetite, and organic magnetite, the latter mostly from bacterial sources. Chemically remagnetized limestones carry magnetite or pyrrhotite. Three hysteresis properties prove useful in identifying and characterizing these mineralogical influences on limestones: the ratio of zero-field maximum remanence to saturation remanence (Mr/Ms) in an applied field, coercivity of remanence (B
cr) and coercivity (Bc). To a lesser extent Kf/Ms may be useful, where K
f is the ferrimagnetic susceptibility. Traditionally, these have been plotted on a combination of 2-D graphs that of necessity only preserve two variables (Day et al. 1977; Wasilewski 1973). However, we found that magnetic discrimination and charac-terization of the limestones was much easier on a three-axis hysteresis projection that preserves the values of B
cr, Bcand Mr/Ms as independent variables. Using logarithmic scales, the regression surfaces through the data become almost planar and distinguish pelagic, shallow marine, shelf and remagnetized limestones on the basis of the slope and intercept of the associated regression surface. Clearly, there are sensitive sedi-mentological, geochemical or organic influences that dictate the magnetic mineralogy through sedimentary environment. Moreover, the 3-D plot of hysteresis criteria affords easy recognition of remagnetized limestones and may permit the rejection of material unsuitable for palaeomagnetic study. The 3-D hysteresis projection may be useful for the characterization of other rocks and magnetic materials
Key words: chemical remagnetization, limestones, magnetic hysteresis, magnetic
materials.
extraterrestrial or chemical-authigenic. Clastic titanomagnetite,
I N T R O D U C T I O N
usually characterized by traces of Cr, is attributed to subaerial dust from continental, island arc or submarine environments Despite their weak remanence, often <10 mA m−1, much
(Henshaw & Merrill 1980; Freeman 1986); however, magnetite valuable palaeomagnetic information is now obtained from
inclusions carried by fluvial clay minerals of continental origin limestones, and this has sparked interest in the rock magnetic
may be dispersed to great distances in the oceans. Exhalative properties that influence and characterize their magnetic
iron oxides associated with mid-ocean ridge emissions may behaviour (Lowrie & Heller 1982; Freeman 1986). Previously,
cover large areas, for example of the North Pacific, and are it has been shown that the hysteresis parameters differ from
chiefly of haematite. Cosmic magnetite spherules, commonly one sedimentary environment to another (Borradaile et al.
with traces of Ni, are ubiquitous and could be a significant 1993). Since there are a limited number of different possible
source of remanence in slowly accumulating sediments that sources of remanence-bearing minerals, it seems reasonable to
are isolated from continental detritus. Chemical authigenic hypothesize that the few distinctive marine depositional
environ-processes are poorly understood but should also be considered ments should control the proportions of magnetic grains and
as possible sources of iron oxides in marine environments, as be characterized by their magnetic properties.
Briefly, the main primary origins of remanence-carrying emphasized by Mackereth (1971) and Henshaw & Merrill (1980). However, Chang & Kirschvink (1989) caution that the minerals in limestones fall into two classes: physical and
biogenic. The physical sources may be clastic, exhalative, physical conditions required are rarely encountered in nature.
at INIST-CNRS on May 3, 2016
http://gji.oxfordjournals.org/
The relative roles of these physical sources of iron oxides will to remove without destroying some useful part of the primary palaeomagnetic record. Haematite may also be a secondary vary with depositional and chemical environment, but the
consensus seems to be that clastic volcanic sources, chiefly mineral in limestones. A greater concern, albeit in restricted regions, is the extensive chemical remagnetization of lime-providing magnetite and titanomagnetite, should be significant.
There are well known sources of biogenic remanence; all are stones, involving the creation of new, fine-grained magnetite (Jackson 1990; Jackson & Sun 1992; McCabe & Channell due to magnetite and they include chiton teeth (Lowenstam
1962) and magnetite-producing bacteria (Blakemore 1975; 1994; Channell & McCabe 1994). Since its signal may have high unblocking temperatures, it may be difficult to recognize its Kirschvink & Lowenstam 1979; Kirschvink 1982). They are
particularly important since all produce magnetite in grain secondary nature. Thus, these authors have developed numerous rock-magnetic criteria that identify chemically remagnetized sizes favourable to the preservation of durable palaeomagnetic
signals. Chitons are magnetofossils with restricted stratigraphic limestones. range and palaeoenvironment, whereas the many species of
magnetite-producing bacteria have been active since the early
T H E D ATA
Proterozoic (~2 Ga) in a wider range of marine and
fresh-water environments (Chang & Kirschvink 1989)—perhaps even The use of the 3-D plot will be illustrated with our hysteresis data (Table 1), comprising 557 measurements of calcareous on Mars (Kirschvink et al. 1997).
Magnetite-producing bacteria fall into two classes: magneto- sediments from numerous published sources. The broad environmental categories, with numbers of measurements in tactic bacteria and dissimilatory iron-reducing bacteria. The
former grow intracellular single-domain magnetite arranged parentheses, include pelagic chalks (n=208) and a pelagic-shallow transitional sequence (n=99) (Lagroix & Borradaile in chains for the purpose of short-range navigation (Frankel
et al. 1981). The fossil preservation of this delicate linear 2000); shallow water limestones (n=42) and shelf limestones (n=76), including some samples from Borradaile et al. (1993), magnetosome arrangement, producing characteristic magnetic
interactions, may be quite fortuitous. In anoxic environments, Borradaile (1991, 1992, 1994, 1999) and Borradaile & Brann (1997) that were restudied. Remagnetized limestones include iron-reducing bacteria are much more productive, shedding
magnetite through their life cycle. Their more copious pro- Jackson’s (1990) data set (n=21), a larger set (n=83) from McCabe & Channell (1994), and a silicified shelf limestone duction is in a wide range of grain sizes from
superpara-magnetic (SP) to small pseudo-single domain (Moskowitz et al. (n=28) that differs from its unaltered counterpart (Maher et al. 2000). The latter is not ‘remagnetized’ in the sense of 1989). Using rock-magnetic tests, Moskowitz et al. (1989) could
distinguish them from linear magnetosomes of magnetotactic Jackson (1990), but our new 3-D hysteresis projection reveals some similarities. Using traditional 2-D projections as well as bacteria. However, their study involved bacterial cultures in
the laboratory, in which interacting grains of magnetotactic a new 3-D projection, we shall try to characterize these different limestone suites according to their environmental influences chains were perfectly preserved.
Secondary remanence carriers are common in certain lime- on rock-magnetic criteria.
In this study, we introduce a diagram used by Lagroix and stones. Lowrie & Heller (1982) note that acquisition of IRM
or hysteresis studies in fields equivalent to values of<1 T may Borradaile during a study of magnetic fabrics illustrating the neotectonic environment of Cyprus (Lagroix & Borradaile give a false impression of saturation and leave the researcher
with the opinion that magnetite is the only carrier. Goethite, 2000). They showed that the wide variation in hysteresis properties did not hinder the use of anisotropy of remanence however, is a common contaminant. It may be of primary
origin; indeed, it is the only iron oxide compatible with the or low-field susceptibility for tectonic analysis. This paper focuses on the contribution of magnetite to the remanence and Eh/pH conditions of seawater (Henshaw & Merrill 1980). One
often suspects, however, a secondary origin that may be difficult hysteresis of limestones from a wide range of locations and
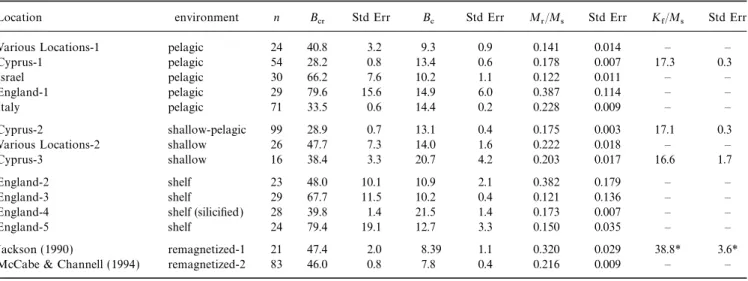
Table 1. Mean and standard errors of hysteresis parameters.
Location environment n Bcr Std Err Bc Std Err Mr/Ms Std Err Kf/Ms Std Err
Various Locations-1 pelagic 24 40.8 3.2 9.3 0.9 0.141 0.014 – –
Cyprus-1 pelagic 54 28.2 0.8 13.4 0.6 0.178 0.007 17.3 0.3
Israel pelagic 30 66.2 7.6 10.2 1.1 0.122 0.011 – –
England-1 pelagic 29 79.6 15.6 14.9 6.0 0.387 0.114 – –
Italy pelagic 71 33.5 0.6 14.4 0.2 0.228 0.009 – –
Cyprus-2 shallow-pelagic 99 28.9 0.7 13.1 0.4 0.175 0.003 17.1 0.3
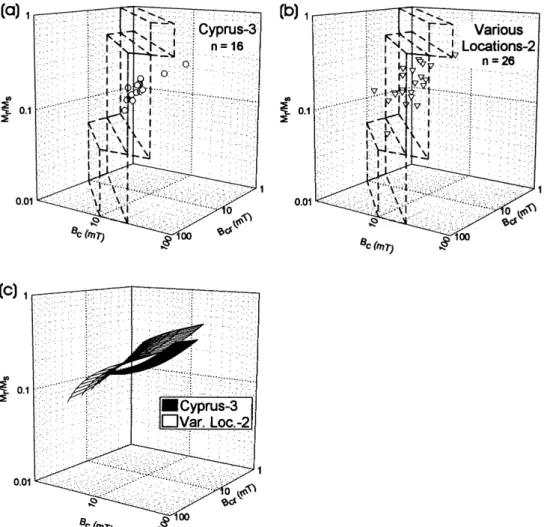
Various Locations-2 shallow 26 47.7 7.3 14.0 1.6 0.222 0.018 – –
Cyprus-3 shallow 16 38.4 3.3 20.7 4.2 0.203 0.017 16.6 1.7
England-2 shelf 23 48.0 10.1 10.9 2.1 0.382 0.179 – –
England-3 shelf 29 67.7 11.5 10.2 0.4 0.121 0.136 – –
England-4 shelf (silicified) 28 39.8 1.4 21.5 1.4 0.173 0.007 – –
England-5 shelf 24 79.4 19.1 12.7 3.3 0.150 0.035 – –
Jackson (1990) remagnetized-1 21 47.4 2.0 8.39 1.1 0.320 0.029 38.8* 3.6*
McCabe & Channell (1994) remagnetized-2 83 46.0 0.8 7.8 0.4 0.216 0.009 – –
B
cr, Bcare in units of mT (Jackson 1999); Kf/Ms in units of 10−6 m A−1 (or mm A−1). * Data from table1 of Jackson et al. (1993)
at INIST-CNRS on May 3, 2016
http://gji.oxfordjournals.org/
Table 2. Linear regression data for Day plot parameters ( Figs 3 and 4).
Location Type n c intercept b slope R test stat signif.
a=0.05
Various Locations-1 pelagic 24 0.30 −0.58 0.53 2.93 √
Cyprus-1 pelagic 54 0.29 −0.57 0.73 7.70 √
Israel pelagic 30 0.31 −0.54 0.61 4.07 √
England-1 pelagic 29 0.30 −0.57 0.40 2.27 √
Italy pelagic 71 0.62 −1.26 0.75 9.42 √
Cyprus-1 shallow-pelagic 99 0.26 −0.58 0.53 6.16 √
Various Locations-2 shallow 26 0.28 −0.28 0.50 2.83 √
Cyprus-3 shallow 16 0.27 −0.48 0.73 4.00 √
England-2 shelf 23 0.71 −1.18 0.48 2.51 √
England-3 shelf 29 0.73 −1.42 0.70 5.09 √
England-4 shelf (silicified) 28 0.32 −0.98 0.85 8.23 √
England-5 shelf 24 0.66 −1.50 0.65 4.01 √
Jackson (1990) remagnetized-1 21 0.90 −0.60 0.95 13.26 √
McCabe & Channell (1994) remagnetized-2 83 0.82 −0.75 0.88 16.67 √
Regression was performed for the relationship (M
r/Ms)=c(Bcr/Bc)b. The significance of the correlation is determined by comparing the test statistic,
R√[(n−2)/(1−R2)], with t. Critical t-test values for a given sample size are listed in Table 3. Significant regressions at a 95 per cent confidence
level are marked by√.
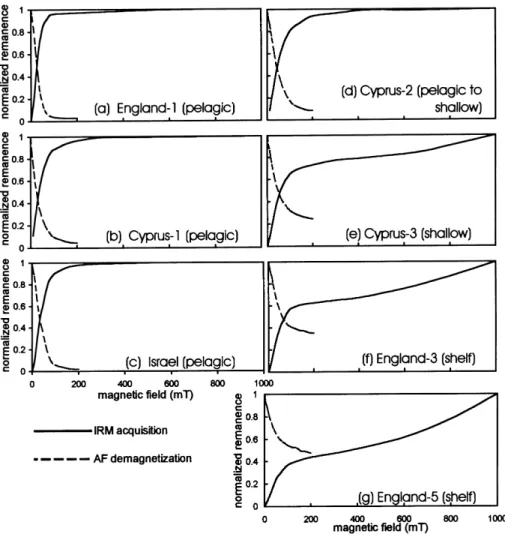
Figure 1. Cisowski (1981) showed that symmetrical IRM acquisition and subsequent AF demagnetization curves of the same sample, crossing at
normalized intensities~0.5 indicate the absence of magnetic interactions between magnetite grains. For our samples, the normalized intensity
at the intersection is 0.45±0.04 (std err.). Interacting SD grains would produce an assemblage more difficult to magnetize than demagnetize, so
the intersection occurs at a normalized intensity %0.5. Following the cautionary advice of Lowrie & Heller (1982) we magnetized all samples to at least 1 T in both IRM acquisition and hysteresis studies to detect whether any of the common high-coercivity phases are present (e.g. goethite, maghemite). The failure of (e) (f ) and (g) to saturate shows that they probably contain such a phase.
at INIST-CNRS on May 3, 2016
http://gji.oxfordjournals.org/
palaeoenvironments. The hysteresis parameters, coercivity B c and coercivity of remanence B
cr, in units of millitesla (Jackson 1999), are important in distinguishing between single domain (SD), pseudo-single domain (PSD) and multidomain (MD) states in magnetite. The ratio Mr/Ms of zero-field (or low-field) remanence (M
r) to saturation remanence (Ms) is zero for superparamagnetic sizes but peaks for SD and small PSD sizes. Wasilewski (1973) plotted B
c versus Bcr to successfully distinguish SP/SD/PSD/MD states for magnetite, and Day et al. (1977) extended this by plotting (Mr/Ms) against (Bcr/Bc). Generally, judicious choice of one or both plots may prove effective in characterizing behaviour, or discriminating between rock-magnetic properties. This was the approach used, for example, by Borradaile et al. (1993). It is, however, useful to preserve the information contained in the individual coercivity values, rather than merging them as a ratio, Bcr/Bc. We will show subsequently that a 3-D plot of Bcr versus Bc versus Mr/Ms is more versatile in this regard and combines the best of the Wasilewski and Day et al. plots.
All our hysteresis data were obtained with an alternating field gradiometer, the Princeton Measurements Corporation MicroMag 2900, usually using a peak direct field of 1 T. Hysteresis loops were corrected for the diamagnetic or para-magnetic matrix contribution. Supplementary data on SIRM acquisition and AF demagnetization were derived with equipment supplied by Molspin and Sapphire Instruments.
D ATA A N A LY S I S
Table 1 summarizes the main hysteresis values determined for our limestone samples. Table 2 provides the information on regression surfaces that fit the hysteresis data distributions in a new 3-D projection (B
cr: Bc: Mr/Ms) described below. Table 4 lists regression data for the 3-D plots.
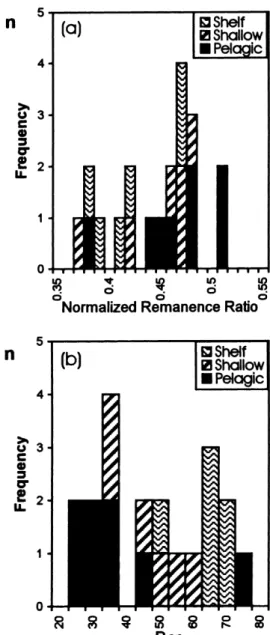
One of the simplest characterizations from hysteresis uses the ratio Mr/Ms. Low values indicate a superparamagnetic contribution, and peak values favour SD or PSD behaviour. In our context, the observations of Moskowitz et al. (1989) on
the hysteresis of laboratory-cultured bacteria are important. For Figure 2. (a) Histograms showing the frequency distributions of the the magnetotactic bacteria, whose magnetosomes encapsulate normalized magnetizations at which IRM acquisition and AF demag-a chdemag-ain of smdemag-all SD mdemag-agnetite grdemag-ains, typicdemag-ally they found netization curves intersect. None of our samples indicate the potential
M
r/Ms~0.41. This value is within the range of error for only for magnetic interaction (intersections %0.5), which is found for examplein the closely juxtaposed magnetite grains of magnetotactic bacteria. two of our sample suites (Table 1: pelagic, England-1; shelf,
( b) Frequency distributions of the coercivities of remanence (Bcr).
England-2), but this is not conclusive. Our samples are rocks in which magnetite chains could have been disrupted after organic decay, compaction, and, in the case of the Cyprus
suite, mild tectonism. The interaction expected between the Another hysteresis ratio that provides characterization is the SD magnetite crystals of intact magnetosomes is not recognized M
r/Ms intercept at Bcr=Bc. For example, Mr/Ms~0.86 and in this study either: it is generally more difficult to magnetize ~0.82 have been reported from regionally remagnetized lime-than demagnetize all of our limestones, especially the shallow stones (Jackson 1990; McCabe & Channell 1994, respectively). marine and shelf varieties (Fig. 1: method of Cisowski 1981). The chemical remagnetization is attributed to late or post-Cisowski showed that interactive SD grains are more difficult orogenic, anchimetamorphic fluid migration that triggered the to magnetize than AF-demagnetize. Thus, their remanence- formation of illite and chlorite, with fine-grained magnetite as acquisition curves intersect the AF demagnetization curves at a byproduct (Lu et al. 1991).
a normalized remanence value~0.25. Non-interacting grains At Bcr=Bc we recognize generally consistent values of magnetize and demagnetize equally easily, producing sym- Mr/Ms~0.3 for pelagic chalks (Figs 3a to d), and Mr/Ms~0.7 metrical curves that intersect at normalized remanences~0.5. for shelf carbonates (Figs 3i, j, l). However, a silicified shelf For our data, the normalized remanences of acquisition–AF limestone also has Mr/Ms~0.3 (Fig. 3k). Shallow water lime-demagnetization curve intersections average 0.45±0.04 (std err.), stones have slightly lower intercepts~0.27 (Figs 3f to h). This seems to corroborate the use of this simple parameter to close to the ideal value of 0.5 for non-interacting grains (Fig. 2).
at INIST-CNRS on May 3, 2016
http://gji.oxfordjournals.org/
Figure 3. The conventional hysteresis plot of Day et al. (1977) indicating the distribution of our data and some from the literature. Regression lines significant at the 95 per cent level are shown. The high M
r/Ms=0.89 considered to be indicative of remagnetization due to magnetite (Jackson
1990), or perhaps magnetite and pyrrhotite (Jackson et al. 1993) shown in (m) is not recognized in any other suites we studied. Critical values
associated with bacterial magnetite are not recognized either. It will be shown that these suites can be differentiated on hysteresis parameters in a
three-axis plot below.
at INIST-CNRS on May 3, 2016
http://gji.oxfordjournals.org/
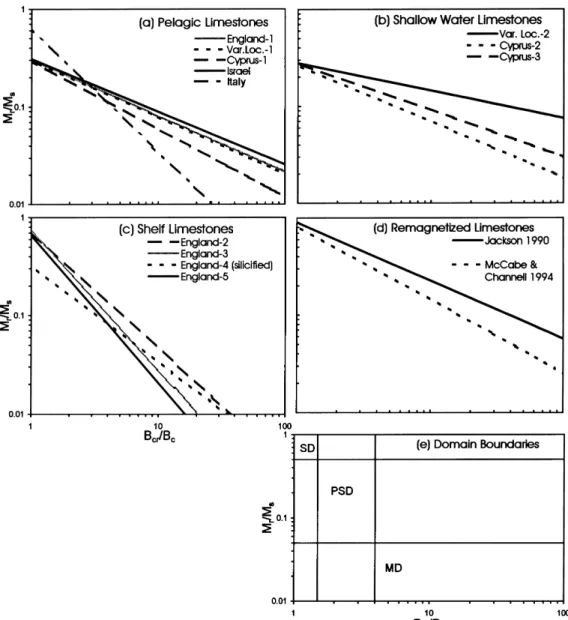
discriminate between sedimentary environments on the basis steeper for pelagic limestones (Fig. 4a), and steepest for shelf limestones (Fig. 4c). Regression data for the Day Plots are in of magnetic mineralogy.
The recognition of remagnetization in limestones is Table 2, with all regression lines significant at the 95 per cent level using the t-test, for which selected critical values are important for palaeomagnetists, who naturally avoid secondary
magnetizations in most aspects of palaeomagnetic and tectonic presented in Table 3.
We attempted to preserve the individual values B cr, Bc by reconstructions. Channell & McCabe (1994) used the Day plot
to discriminate successfully between two large data sets of plotting these as x, y axes and then identifying these data points with contours of their associated Mr/Ms value. Thus all remagnetized and non-remagnetized limestones, from Italy and
England. They showed that data for remagnetized limestones three pieces of hysteresis information could be combined on followed a gentler slope than the SD-PSD-MD trend (compare
Figs 3m and n with Fig. 3o). Essentially, the (Bcr/Bc) ratios Table 3. Critical values of t to be exceeded by the test statistic if
were too high, due to the presence of secondary fine magnetite |R|>0. (A one-tailed test at the 95 per cent level). that also produced wasp-waisted hysteresis loops. Jackson
n=n−2 critical value n=n−2 critical value
et al. (1993) explain this as the result of a bimodal coercivity distribution: low-coercivity grains carry more M
s, and harder 5 2.571 30 2.042
grains carry more M
r, thus displacing data to the right of the 10 2.228 40 2.021
SD-PSD-MD trend on the Day plot (see, for example, our
15 2.131 60 2.000
Figs 3m and n). For our data, the traditional Day plots reveal
20 2.086 120 1.980
some interesting general trends with best fit lines in log–log 25 2.060 2 1.960 space being shallowest for shallow-water limestones (Fig. 4b),
Figure 4. Summary and comparison of the Day plot regression lines significant at the 95 per cent level for the limestones studied.
at INIST-CNRS on May 3, 2016
http://gji.oxfordjournals.org/
one 2-D plot. Unfortunately, this is difficult to assess visually data, and which in v.5.0 are interactively rotatable for enhanced visualization. Whereas traditional 2-D plots are (Fig. 5). Thus, to preserve all the hysteresis measurements and
exploit them to discriminate further among environments, we cumbersome and obfuscate some trends, the 3-D projection clarifies patterns and reveals significant differences. This is introduced the three-axis plots below.
aided by non-linear regression fitting the surface log(Mr/Ms) to log(B
cr) and log(Bc) to define surfaces that generalize the
3-D projection of data
behaviour of the sample suites. The t-statistic was used to determine where the correlation coefficients (R) were signifi-The new projection preserves all measured parameters in
one plot using logarithmic scales: log(B
cr) versus log(Bc) cantly non-zero at the 95 per cent level (using the critical values, examples of which are abbreviated in Table 3). Only versus log(Mr/Ms) (x :y : z). We used the commercial
soft-ware v.5.0 to view the projection in any desired significant results are graphed, for the relationship log(Mr/Ms)= a log(B
cr)+b log(Bc)+c (Table 4; Figs 7 to 10). By using orientation. MD, PSD and SD responses occupy volumes
represented by six-sided prisms (Fig. 6) whose bounds are defined logarithmic parameters, the regression surfaces become planar and thus are more readily visualized and distinguishable. by commonly accepted values (Dunlop & O¨ zdemir 1997).
Superparamagnetic (SP) responses should occupy the lowest level of the 3-D space plotted in Fig. 6, where Mr/Ms~0.01.
Hysteresis trends with depositional shallowing, illustrated
We chose an arbitrary orientation that shows clearly the main
by the 3-D plot
domain-response regimes in 3-D space, and, for the
con-venience of the reader, that can be used consistently with all The Upper Cretaceous to Pliocene carbonate cover of Cyprus forms an upward shallowing sequence dated by micro-our data in this paper. Other workers may choose equally
valid alternative angles of view that are more suitable to their palaeontology (Henson et al. 1949; Mantis 1970). It commences
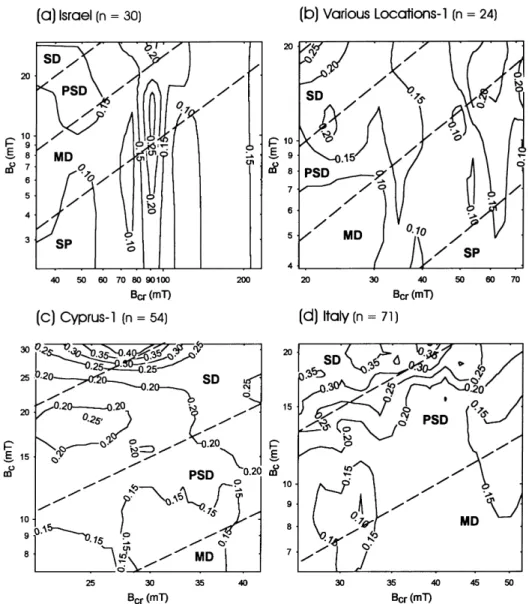
Figure 5. Plots of Bc versus Bcr with the data points of the pelagic limestone suites contoured according to their Mr/Ms ratio. Although this
preserves all of the hysteresis parameters, this presentation is difficult to evaluate. Therefore, we developed the 3-D plot shown later.
at INIST-CNRS on May 3, 2016
http://gji.oxfordjournals.org/
Table 4. Planar regression data for 3-D log-hysteresis parameters (Figs 7 to 10).
Location Type n a b c R test stat. signif.
a=0.05
Various Locations-1 pelagic 24 n/s 0.013 n/s 0.76 5.48 √
Cyprus-1 pelagic 54 n/s 0.011 0.052 0.91 15.83 √
Israel pelagic 30 n/s 0.008 0.055 0.72 5.49 √
England-1 pelagic 29 no significant regression plane
Italy pelagic 71 −0.005 0.026 n/s 0.80 11.08 √
Cyprus-1 shallow-pelagic 99 n/s 0.008 0.081 0.88 18.25 √
Various Locations-2 shallow 26 0.042 0.009 0.138 0.71 4.94 √
Cyprus-3 shallow 16 n/s 0.004 0.104 0.90 7.73 √
England-2 shelf 23 no significant regression plane
England-3 shelf 29 no significant regression plane
England-4 shelf (silicified) 28 n/s 0.006 0.091 0.94 14.05 √
England-5 shelf 24 no significant regression plane
Jackson (1990) remagnetized-1 21 −0.003 0.022 0.284 0.94 12.01 √
McCabe & Channell (1994) remagnetized-2 83 n/s 0.020 0.098 0.91 19.75 √
The planar regression surface is defined by log(M
r/Ms)=a log(Bcr)+b log(Bc)+c. The significance of the correlation is determined by comparing
the test statistic, R√[(n−2)/(1−R2)], with t. Significant regressions at a 95 per cent confidence level are marked by √.
shallow water carbonates with some reefs and gypsum of Miocene age (23–7 Ma) (Gass & Cockbain 1961; Mantis 1970). Finally, the uppermost Nicosia Formation includes marls and sandstones of early to middle Pliocene age (5–3 Ma). The Lefkara, Pakhna and Nicosia formations are, respectively, termed Cyprus-1, -2 and -3 in the tables. The data lie predominantly in the PSD field but the regression surfaces become pro-gressively more gently dipping as the depositional environment becomes progressively shallower with time (Figs 7a to c). Such trends are, at the very least, difficult to observe by comparing different 2-D plots (e.g. Wasilewski 1973 versus Day et al. 1977) and are rather convoluted when using the contoured 2-D plot (Fig. 5) with which we experimented.
The 3-D plot clarifies trends: hysteresis regression planes slope more gently, as the depositional environment progresses from pelagic (Fig. 7a) to the shallowest depositional environment (Fig. 7c). The results are statistically significant and distinct (Tables 4 and 5), although one may debate the causes of the differences in magnetic mineralogy, in particular the relative roles of organic versus clastic magnetite, as the depositional depth changes.
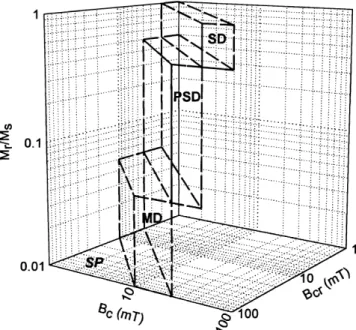
Figure 6. The three-axis hysteresis plot that facilitates the
dis-crimination and comparison of the limestones that we studied. Mr/Ms
Pelagic chalks
is the ratio of zero-field maximum remanence to saturation remanence in an applied field. B
cris the coercivity of remanence (mT ), and Bc A comparison of carbonates with similar depositional
environ-is the coercivity (mT). Superparamagnetic behaviour environ-is described ments from different areas is also instructive. Consider the
by conditions constrained to the basal plane in the triangular area
pelagic chalks shown in Fig. 8, from Cyprus, Israel, Italy and
indicated by SP. Multidomain (MD), pseudo-single domain (PSD)
England, inter alia (Jeans 1973; Borradaile 1994; Borradaile
and single domain (SD) responses are described by parameters
occupy-et al. 1993; Bernouilli & Jenkyns 1974). The data occupy PSD
ing the six-sided prismatic spaces indicated. The boundaries for the
space clearly, trending towards MD. However, MD magnetite is
characteristic spaces are taken from Banerjee & Moskowitz (1985)
virtually absent, and evidence for an SD response is completely
and Dunlop & O¨ zdemir (1997).
Table 5. Mean coercivity parameters for the upward shallowing
with the pelagic Lower Lefkara Formation, a 25-m thick
carbonate sequence, Cyprus.
chalk sequence of Maastrichtian age (74–65 Ma). The Middle Lefkara Formation is up to 300 m thick, a cherty sequence of
Bc(mT ) Mr/Ms
Palaeocene to Eocene age (65–35 Ma). The Upper Lefkara Formation is a chalk sequence of middle to late Eocene
shallow marine 20.71±4.23 0.203±0.017
age (35–23 Ma) that shows evidence of slumping and rapid pelagic 13.43±0.56 0.178±0.007 uplift (Gass 1960). The overlying Pakhna Formation comprises
at INIST-CNRS on May 3, 2016
http://gji.oxfordjournals.org/
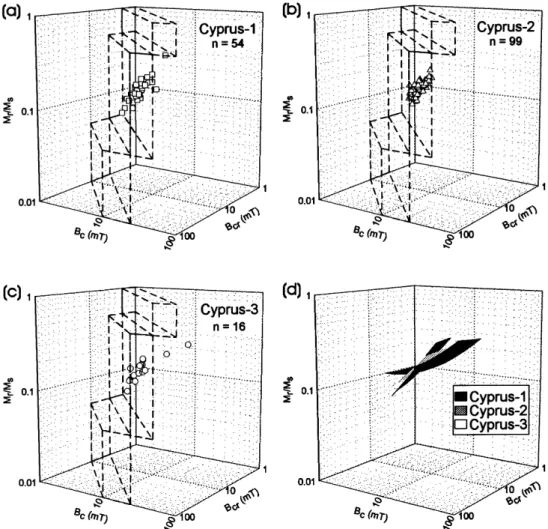
Figure 7. (a,b,c) An extensive continuous sequence of limestones in Cyprus was sampled, from pelagic types at the base (a) to progressively less deep depositional environments at the top (c). In the three-axis plot, the distribution of data is much clearer than in traditional 2-D Day plots (Fig. 3). (d) However, regression surfaces, significant at the 95 per cent level, still show more clearly the changing loci of hysteresis behaviour with depth of deposition. These surfaces appear nearly planar due to the logarithmic scaling of axes. This presumably indicates changing proportional influences of detrital input versus more homogeneous background sources of magnetite. In order of descending importance these are probably volcanic ash, bacterial sources or cosmic input. All occupy PSD space.
lacking in our samples. The regression surfaces are near-planar
Remagnetized limestones
and similarly steep from widespread localities. [In contrast,
shallow water limestones, from widespread localities, have The data of Jackson (1990) provide hysteresis data for three limestone formations of Ordovician and Devonian age in gentler inclined regression surfaces (Fig. 9).] There is no
con-clusive indication of a bacterial component. The environment the northeastern United States. These include the Trenton Limestone calcarenites and marls (Kay 1968), the Onondaga is, however, characterized by steep regression surfaces that
more-or-less follow the locus of the SD-PSD-MD trend, for the most fine-grained and coralline limestone (Oliver 1960) and the Knox Dolomite, a fine-grained dolostone (Churnet et al. 1982). part clinging to or transgressing the low-B
c and high-Bcr
boundaries of the PSD field. Of our samples, only the Israeli These were remagnetized in a pervasive fluid migration event that caused anchimetamorphic growth of magnetite associated chalks include a few outliers in the MD field (Fig. 8a).
with illite and chlorite (McCabe et al. 1984). Jackson noted that the data set yielded unusually high value of Mr/Ms~0.86
Shallow-water marine limestones
at B
cr=Bc. Using the three-axis plot shown here we further recognize significant regression surfaces with inclinations slightly Generally located more centrally in the PSD field (Fig. 9),
these data could be compatible with the grain sizes suspected steeper than pelagic limestones but considerably steeper than for those of shallow-water and shelf limestones. However, where clastic input becomes more significant in littoral
environ-ments. The regression surfaces are significantly shallower than the regression surfaces for remagnetized limestones are also displaced upwards above the locus of the SD-PSD-MD trend those for pelagic limestones (Fig. 8) and do not trend from
SD towards MD but rather appear to transect the upper but with lower B
c values (Fig. 10e; Table 4). This re-enforces Jackson’s (1990) observations of high Mr/Ms values using and lower Bc limits of the PSD field. The shallow regression
surfaces are due to small variations in Mr/Ms and a restricted 2-D diagrams. The larger sample suite of remagnetized lime-stones from McCabe & Channell (1994), consisting of British range of B
cvalues.
at INIST-CNRS on May 3, 2016
http://gji.oxfordjournals.org/
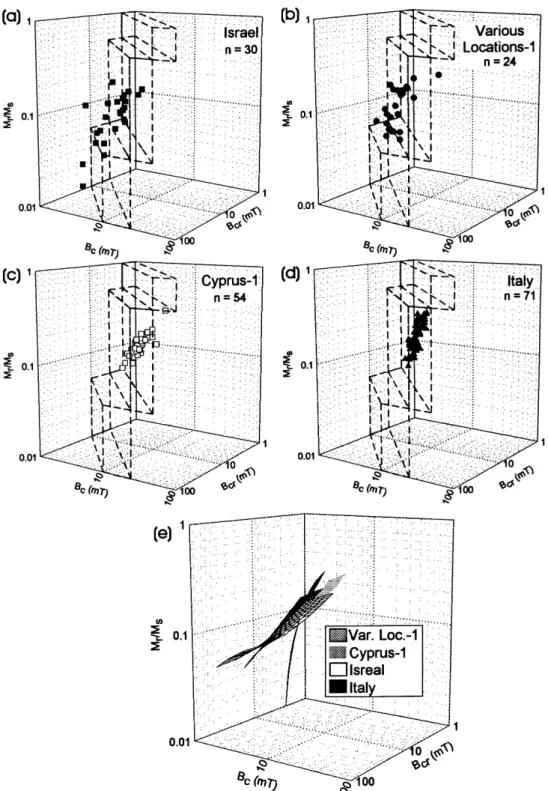
Figure 8. (a,b,c,d) Hysteresis parameters for pelagic limestones and chalks occupy steep surfaces in the 3-D plot in or close to PSD space, but generally near the low-B
cboundary. (e) The similarity of these environmental controls from widely differing locations is emphasized by the
similarity of slopes of their regression surfaces, all significant at the 95 per cent level, and nearly planar in logarithmic scales.
Carboniferous Limestone (Earp et al. 1961) (Fig. 10d), has to have erased primary palaeomagnetic signals, the limestones did suffer a pervasive alteration. The silicified shelf lime-a simillime-arly inclined regression pllime-ane in log–log splime-ace but lime-a
lower elevation (Mr/Ms intercept). Palaeomagnetists may be stones do, however, possess similarly inclined regression surfaces to those of the remagnetized limestones studied by Jackson encouraged that remagnetized limestones may be more readily
detected and rejected on the basis of the 3-D representation. and McCabe and Channell (Figs 10a and b), although their regression surfaces are displaced downwards; that is, they Our sampling of shelf limestones from England included
silicified examples. Although these are not remagnetized on do not have the high Mr/Ms values recognized for true remagnetized limestone.
the basis of any of the usual criteria, and they do not seem
at INIST-CNRS on May 3, 2016
http://gji.oxfordjournals.org/
Figure 9. (a,b) Shallow marine limestones, from different locations around the world, show (c) gently inclined regression surfaces in PSD space but following a locus more gently inclined than the traditionally recognized SD-PSD-MD trend of zones.
Jackson et al. (1993) recognized the presence of pyrrhotite
D I S C U S SI O N
in previously studied remagnetized North American limestones.
One of their conclusions is that high Bcr/Bc values may not The presentation of hysteresis data in a three-axis plot pre-serves all three commonly measured hysteresis values, Bcr, Bc always be interpreted in terms of bimodal magnetite
grain-size/hysteresis distributions. They recognized that it may also and Mr/Ms, and thus clarifies trends within the idealized SD-PSD-MD sequence, as well as indicating more clearly be attributable to pyrrhotite, which they confirmed in the
North American examples by recognizing its sharp reduction the anomalous trends lying outside this sequence. Non-linear regression in three dimensions identifies surfaces that charac-in remanence near 35 K.
The relationship Mr/Ms#0.89 (Bcr/Bc)−0.6 is a convenient terize different sedimentary environments and remagnetized limestones in a visual manner. In logarithmic space these fingerprint for remagnetized limestone due to magnetocrystalline
anisotropy of fine magnetite (Jackson 1990), although it need appear nearly planar, facilitating comparisons. The hysteresis parameters of pelagic limestones have steep regression surfaces, not be uniquely explained by magnetite, as Jackson et al. (1993)
noted. The ratio Kf/Ms is an easily comprehended indication whereas those of shallow-water limestones are progressively less steep (Figs 7 to 9). Furthermore, shallow-water limestones of fine-grained magnetite, for example due to chemical
remag-netization, where Kf is the ferrimagnetic susceptibility. Values have regression surfaces that do not follow the SD-PSD-MD trend but rather transgress the PSD field (Fig. 9). Remarkably, of Kf/Ms~80 mm A−1 are common for the remagnetized
samples studied by Jackson et al. (1993), ~50 mm A−1 for SD behaviour is absent from the limestone environments that we sampled, and MD magnetite is very rare. The hysteresis superparamagnetic grains,≤35 mm A−1 for bacterial magnetite
(Moskowitz et al. 1988), and ≤8 mm A−1 for stable single differences are primarily due to different effective magnetic grain sizes, although their geological origins are largely a matter of domain or larger grains. This criterion is presented for our
most complete suite of limestones, in Cyprus, in Fig. 11. The conjecture at the present. It seems difficult to characterize a bacterial source of magnetite with the routine hysteresis and ratio is essentially constant near 17.1±0.2 (std err.),
regard-less of the depositional environment. This value does not rock-magnetic parameters we employed, including Kf/Ms. A continuous carbonate sequence approximately 1 km thick rule out contributions from bacterial magnetite (reported as
≤8 mm A−1), but is compatible with any small SD grains and in Cyprus shows a complete upward transition from pelagic chalks to shallow-water marine limestones. The change in a superparamagnetic contribution.
at INIST-CNRS on May 3, 2016
http://gji.oxfordjournals.org/
Figure 10. Silicified limestones from (a,b) Maher et al. (2000); chemically remagnetized limestones (c) Jackson ( 1990) and Jackson et al. (1993 ),
and (d) McCabe & Channell (1994). (c) shows results of studies of the Kiaman chemical remagnetization event that affected limestones in
the northeastern United States. They have the regression surfaces with the highest Mr/Ms values and moderate inclination and lie outside the
traditionally defined PSD space because their Bcvalues are anomalously low. Although not remagnetized in the regionally significant sense of
Jackson et al. (1990), silicified shelf limestones from England show superficially similar characteristics regarding the inclination and relatively high
Mr/Ms value of their regression surface (compare b, e).
hysteresis regression surfaces is also progressive, confirming years. Thus, atmospheric, extraterrestrial and organic influx of magnetite could represent a high proportion of the sediment. for a single depositional basin (Fig. 7) what we observe in
our compilations from many sources (Figs 8 and 9). We It is really unimportant whether biogenic magnetite is intra-cellular, from magnetotactic bacteria, or the more copious suggest that the hysteresis parameters are primarily controlled
by depositional environment. The offshore, deeper sediments byproduct of iron-reducing bacteria (Moskowitz et al. 1989). The former is more likely but, in principle, it is possible to accumulate slowly, typically a few millimetres per thousand
at INIST-CNRS on May 3, 2016
http://gji.oxfordjournals.org/
A C K N O W L E D G M E N T S
We are particularly grateful to Mike Jackson for a very helpful and constructive review, particularly the suggestion to use logarithmic axes for Mr/Ms. J. Channell kindly provided the original data from Channell & McCabe (1994) and McCabe & Channell (1994). The work was funded by the Natural Sciences Engineering Research Council of Canada to Graham Borradaile.
R E F E R E N C E S
Banerjee, S.K. & Moskowitz, B.M., 1985. Ferrimagnetic properties of magnetite, in Magnetite Biomineralization and Magnetoreception in Organisms: a New Biomagnetism, pp. 17–41, eds Kirschvink, J.L., Jones, D.S. & Macfadden, B.F., Plenum Press, New York. Bernouilli, D. & Jenkyns, H.C., 1974. Alpine, Mediterranean, and
Central Atlantic Mesozoic facies in relation to early evolution of the Tethys, in Modern and Ancient Geosynclinal Sedimentation, eds Figure 11. Jackson et al. ( 1993) and Moskowitz et al. (1988, 1989)
Dott, R.H. & Shaver, R.H., Soc. Econ. Paleontol. Min., Spec. Publ.,
showed that (Kf/Ms in mm A−1) could be diagnostic for either
19, 129–160.
chemically remagnetized limestones (~80 mm A−1) or those bearing
Blakemore, R.P., 1975. Magnetotactic bacteria, Science, 190,
bacterial magnetite (≤35 mm A−1), whereas stable SD and larger
377–379.
grains have≤8 mm A−1 and SP grains have ~50 mm A−1. We found
Borradaile, G.J., 1991. Remanent magnetism and ductile deformation the ratio to be less diagnostic in our study, generally indicating
in an experimentally deformed magnetite-bearing limestone, Phys. behaviour that could be compatible with any small SD grains
Earth planet. Inter., 67, 362–373. of bacterial, volcanic or detrital origin. The Lefkara Formation
Borradaile, G.J., 1992. Experimental deformation of two-component (Cyprus-1) had the deepest depositional environment and the Nicosia
IRM in magnetite-bearing limestones: a model for the behavior of Formation (Cyprus-3) had the shallowest.
NRM during natural deformation, Phys. Earth planet. Inter., 70, 64–77.
distinguish between the two possibilities because magnetotactic
Borradaile, G.J., 1994. Magnetic remanence in the Chalk of eastern
bacteria produce magnetite in a restricted size range (Moskowitz
England: an unusually resistant VRM?, Geol. Mag., 131, 593–608.
et al. 1989). Iron-reducing bacteria produce a wider range Borradaile, G.J., 1999. Viscous remanent magnetization of high of grain sizes, including much SP material and some large thermal stability in limestones, in Paleomagnetism and Diagenesis in PSD grains. Moreover, the concatenation of SD magnetite Sediments, eds Tarling, D.H. & Turner, P., Geol. Soc. L ond., Spec. grains in magnetotactic bacteria causes interactions that make Publ., 151, 27–42.
magnetization more difficult than demagnetization (Cisowski Borradaile, G.J. & Brann, M., 1997. Remagnetization dating of Roman and Mediaeval masonry, J. archeol. Sci., 24, 813–824.
1981). However, this test may not always be decisive because
Borradaile, G.J., Chow, N. & Werner, T., 1993. Magnetic hysteresis
fragile magnetosome should disrupt during compaction or
of limestones: Facies control?, Phys. Earth planet. Inter., 76,
diagenesis, and especially in the case of tectonic deformation.
241–252.
In near-shore, shallower depositional environments, coarser
Chang, S.-B.R. & Kirschvink, J.L., 1989. Magnetofossils, the
magnetite should be more prevalent, for example imported with
magnetization of sediments, and the evolution of magnetite
clastic clay minerals. This would explain the more common
biomineralization, Ann. Rev. Earth planet. Sci., 17, 169–195.
PSD response in this depositional environment. As well as
Channell, J.E.T. & McCabe, C., 1994. Comparison of magnetic
changing proportions of biological versus physically derived hysteresis parameters of unremagnetized and remagnetized lime-magnetite in the different environments, one might expect several stones, J. geophys Res., 99, 4613–4623.
biological sources, for example different bacterial species, and Churnet, H.G., Misra, K.C. & Walker, K.R., 1982. Deposition and chiton teeth. Of the 557 limestone samples studied, the PSD dolomitization of Upper Knox carbonate sediments, Copper Ridge response is almost universal, with MD behaviour detected in district, East Tennessee, Geol. Soc. Am. Bull., 93, 76–86.
only three samples from England-1, six samples from England-3, Cisowski, S., 1981. Interacting vs. non-interacting single-domain behaviour in natural and synthetic samples, Phys. Earth planet.
three samples from England-5 and one sample from Israel,
Inter., 26, 77–83.
and a complete absence of SD magnetite with the exception
Day, R., Fuller, M.D. & Schmidt, V.A., 1977. Hysteresis properties of
of one sample from Jackson’s remagnetized suite.
titanomagnetites: grain size and compositional dependence, Phys.
Palaeomagnetists need criteria by which to identify
remag-Earth planet. Inter., 13, 260–267.
netized rocks which are unsuitable for palaeomagnetic studies
Dunlop, D.J. & O¨ zdemir, O¨ ., 1997. Rock Magnetism: Fundamentals
(Jackson 1990; Jackson et al. 1992; McCabe & Channell 1994;
and Frontiers, Cambridge Studies in Magnetism. Cambridge University
Channell & McCabe 1994). The remagnetized limestones that
Press, Cambridge.
we studied and reviewed are characterized by regression surfaces Earp, J.P., Magraw, D., Poole, E.G., L., D.H. & Whiteman, A.J., 1961. that are as steep as those for pelagic chalks, but displaced Geology of the country around Clitheroe and Nelson, Mem. geol. upwards above the conventional SD-PSD-MD sequence Surv. England, 9.
with high Mr/Ms intercepts (Figs 10c to e). Thus, we can be Frankel, R.B., Blakemore, R.P., Torres de Araujo, F.F.,
optimistic that remagnetized limestones can be identified and Esquivel, D.M.S. & Danon, J., 1981. Magnetotactic bacteria at the geomagnetic equator, Science, 212, 1269–1270.
rejected on the basis of simple hysteresis measurements.
at INIST-CNRS on May 3, 2016
http://gji.oxfordjournals.org/
Freeman, R., 1986. Magnetic mineralogy of pelagic limestones, Lagroix, F. & Borradaile, G.J., 2000. Tectonics of the circum-Troodos sedimentary cover of Cyprus, from magnetic and structural Geophys. J. R. astr. Soc., 85, 433–452.
Gass, I.G., 1960. The geology and mineral resources of the Dhali Area, observations, J. struct. Geol., in press.
Lowenstam, H.A., 1962. Magnetite in denticle capping in recent chitons Mem. Geol. Surv. Cyprus, 4.
Gass, I.G. & Cockbain, A.F., 1961. Notes on the occurrence of Gypsum (Polycophora), Geol. Soc. Am. Bull., 73, 435–438.
Lowrie, W. & Heller, F., 1982. Magnetic properties of marine lime-in Cyprus, Overseas Geol. Mlime-iner. Resour., 8, 279–287.
Henshaw, P.C. & Merrill, R.T., 1980. Magnetic and chemical changes stones, Rev. Geophys. Space Phys., 20, 171–192.
Lu, G., McCabe, C., Hanor, J.S. & Ferrell, R.E., 1991. A genetic in marine sediments, Rev. Geophys. Space Phys., 18, 483–504.
Henson, F.R.S., Browne, R.V. & McGinty, J., 1949. A synopsis of the link between remagnetization and potassic metasomatism in the
Devonian Onondaga Formation, Northern Appalachian Basin, stratigraphy and geological history of Cyprus, Q. J. geol. Soc. L ond.,
105, 1–41. Geophys Res. L ett., 18, 2047–2050.
McCabe, C. & Channell, J.E.T., 1994. Late Paleozoic remagnetization Jackson, M., 1990. Diagenetic sources of stable remanence in
remagnetized Paleozoic cratonic carbonates: a rock magnetic study, in limestones of the Craven Basin (northern England) and the
rock magnetic fingerprint of remagnetized sedimentary carbonates, J. geophys. Res., 95, 2753–2761.
Jackson, M., 1999. Measure for Measure: The beauty of magnetic J. geophys. Res., 99, 4603–4612.
McCabe, C., Van der Voo, R. & Ballard, M.M., 1984. Late Paleozoic units, IRM Quarterly, 9, 1–2.
Jackson, M. & Sun, W.-W., 1992. The rock magnetic fingerprint of remagnetization of the Trenton Limestone, Geophys. Res. L ett.,
11, 979–982. chemical remagnetization in midcontinental Paleozoic carbonates,
Geophys. Res. L ett., 19, 781–784. Mackereth, F.J.H., 1971. On the variation in direction of the horizontal
component of remanent magnetization in lake sediments, Earth Jackson, M., Rochette, P., Fillion, G., Banerjee, S. & Marvin, J.,
1993. Rock magnetism of remagnetized Paleozoic carbonates: Low- planet. Sci. L ett., 12, 332–338.
Maher, L., Borradaile, G.J., Stewart, J.D. & O’Connor, M., 2000. temperature behavior and susceptibility characteristics, J. geophys.
Res., 98 (B4), 6217–6225. Primary or secondary insertion of the Romanesque Frieze at Lincoln
Cathedral, England? Magnetic considerations, Archeometry, in press. Jeans, C.V., 1973. The Market Weighton Structure: tectonics,
sedi-mentation and diagenesis during the Cretaceous, Proc. Yorkshire Mantis, M., 1970. Upper Cretaceous-Tertiary Foraminiferal Zones in
Cyprus, Epithris, 3, 227–241. geol. Soc., 39, 409–444.
Kay, M., 1968. Ordovician formations in northwestern New York, Moskowitz, B.M., Frankel, R.B., Bazylinski, D.A., Jannasch, H.W. &
Lovley, D.R., 1989. A comparison of magnetite particles produced Naturaliste Canadien, 95, 1373–1378.
Kirschvink, J.L., 1982. Paleomagnetic evidence for fossil biogenic anaerobically by magnetotactic and dissimilatory iron-reducing
bacteria, Geophys. Res. L ett., 16, 665–668. magnetite in western Crete, Earth planet. Sci. L ett., 59, 388–392.
Kirschvink, J.L. & Lowenstam, H.A., 1979. Mineralization and Moskowitz, B.M., Frankel, R.B., Flanders, P.J., Blakemore, R.P. &
Schwartz, B.B., 1988. Magnetic properties of magnetotactic bacteria, magnetization of chiton teeth: Palaeomagnetic, sedimentologic, and
biologic implications of organic magnetite, Earth planet. Sci. L ett., J. magn. Mater., 73, 273–288.
Oliver, W.A., 1960. Coral faunas in the Onondaga limestone of New 44, 193–204.
Kirschvink, J.L., Maine, A.T. & Vali, H., 1997. Paleomagnetic evidence York, US Geol. Surv. Prof. Pap., 100-B, 172–174.
Wasilewski, P.J., 1973. Magnetic hysteresis in natural materials, Earth of a low-temperature origin of carbonate in the Martian meteorite
ALH 84001, Science, 275, 1629–1633. planet. Sci. L ett., 20, 67–72.
at INIST-CNRS on May 3, 2016
http://gji.oxfordjournals.org/