HAL Id: insu-02182962
https://hal-insu.archives-ouvertes.fr/insu-02182962
Submitted on 13 Jan 2021
HAL is a multi-disciplinary open access
archive for the deposit and dissemination of
sci-entific research documents, whether they are
pub-lished or not. The documents may come from
teaching and research institutions in France or
abroad, or from public or private research centers.
L’archive ouverte pluridisciplinaire HAL, est
destinée au dépôt et à la diffusion de documents
scientifiques de niveau recherche, publiés ou non,
émanant des établissements d’enseignement et de
recherche français ou étrangers, des laboratoires
publics ou privés.
wildfires
Erik Lutsch, Kimberly Strong, Dylan B. A. Jones, Ivan Ortega, James
Hannigan, Enrico Dammers, Mark W. Shephard, Eleanor Morris, Killian
Murphy, Mathew J. Evans, et al.
To cite this version:
Erik Lutsch, Kimberly Strong, Dylan B. A. Jones, Ivan Ortega, James Hannigan, et al.. Unprecedented
atmospheric ammonia concentrations detected in the high Arctic from the 2017 Canadian wildfires.
Journal of Geophysical Research: Atmospheres, American Geophysical Union, 2019, 124 (14),
pp.8178-8202. �10.1029/2019JD030419�. �insu-02182962�
Canadian Wildfires
Erik Lutsch1 , Kimberly Strong1 , Dylan B. A. Jones1 , Ivan Ortega2 ,
James W. Hannigan2 , Enrico Dammers3, Mark W. Shephard3 , Eleanor Morris4,
Killian Murphy4, Mathew J. Evans4 , Mark Parrington5 , Simon Whitburn6,
Martin Van Damme6 , Lieven Clarisse6 , Pierre-Francois Coheur6 , Cathy Clerbaux6,7 ,
Betty Croft8 , Randall V. Martin8 , Jeffrey R. Pierce9 , and Jenny A. Fisher10
1Department of Physics, University of Toronto, Toronto, Ontario, Canada,2National Center for Atmospheric Research, Boulder, CO, USA,3Air Quality Division, Environment and Climate Change Canada, Toronto, Ontario, Canada, 4Wolfson Atmospheric Chemistry Laboratories, Department of Chemistry, University of York, York, UK,5European Center for Medium-Range Weather Forecasts (ECMWF), Reading, UK,6Université libre de Bruxelles (ULB), Atmospheric Spectroscopy, Service de Chimie Quantique et Photophysique, Brussels, Belgium,7LATMOS/IPSL, Sorbonne Université, UVSQ, CNRS, Paris, France,8Department of Physics and Atmospheric Science, Dalhousie University, Halifax, Nova Scotia, Canada,9Department of Atmospheric Science, Colorado State University, Fort Collins, CO, USA,10Centre for Atmospheric Chemistry, University of Wollongong, Wollongong, New South Wales, Australia
Abstract
From 17–22 August 2017 simultaneous enhancements of ammonia (NH3), carbon monoxide (CO), hydrogen cyanide (HCN), and ethane (C2H6) were detected from ground-based solar absorption Fourier transform infrared (FTIR) spectroscopic measurements at two high-Arctic sites: Eureka (80.05◦N, 86.42◦W) Nunavut, Canada, and Thule (76.53◦N, 68.74◦W), Greenland. These enhancements were attributed to wildfires in British Columbia and the Northwest Territories of Canada using FLEXPART back-trajectories and fire locations from Moderate Resolution Imaging Spectroradiometer (MODIS) and found to be the greatest observed enhancements in more than a decade of measurements at Eureka (2006–2017) and Thule (1999–2017). Observations of gas-phase NH3from these wildfires illustrate that boreal wildfires may be a considerable episodic source of NH3in the summertime high Arctic.Comparisons of GEOS-Chem model simulations using the Global Fire Assimilation System (GFASv1.2) biomass burning emissions to FTIR measurements and Infrared Atmospheric Sounding Interferometer (IASI) measurements showed that the transport of wildfire emissions to the Arctic was underestimated in GEOS-Chem. However, GEOS-Chem simulations showed that these wildfires contributed to surface layer NH3and NH+4enhancements of 0.01–0.11 ppbv and 0.05–1.07 ppbv, respectively, over the Canadian Archipelago from 15–23 August 2017.
1. Introduction
Ammonia (NH3) is an important form of reactive nitrogen, it and its particulate form ammonium (NH+4) are the main forms of reactive nitrogen in the atmosphere. NH3is a precursor to the formation of partic-ulate matter, which has a negative impact on air quality (Erisman et al., 2011; Pope et al., 2009). In high concentrations, NH3is toxic to biodiversity (Aneja et al., 2001; Asman et al., 1998; Galloway et al., 2003) and contributes to the acidification of soil and water bodies, which can lead to the eutrophication of ecosystems (Bobbink et al., 1998, 2010). The Arctic is free of the common anthropogenic sources of NH3, such as agri-culture practices (Bouwman et al., 1997; Dentener & Crutzen, 1994; Schlesinger & Hartley, 1992), and the short lifetime of NH3, typically less than 1 day (Lefer et al., 1999) was thought to limit the long-range trans-port of gas-phase NH3from the lower latitudes. Biomass burning has been identified as a major source of NH3(Bouwman et al., 2002), with boreal wildfires, in particular, found to contribute to NH+4 in the Arctic (Fisher et al., 2011). Detection of boreal wildfire NH3emissions transported to the high Arctic was identi-fied using ground-based Fourier transform infrared (FTIR) measurements in Eureka (80.05◦N, 86.42◦W), Nunavut, by Lutsch et al. (2016). Solar absorption FTIR measurements were used to retrieve total column abundances of NH3and were the first long-term measurements of NH3in the high Arctic (2006–2017). In
Key Points:
• The 2017 Canadian wildfires resulted in the largest observed NH3total column enhancements in the high Arctic from 1999–2017
• GEOS-Chem surface layer NH3 was enhanced by 0.01–0.11 ppbv (14–550%) in the Canadian high Arctic from 15–23 August 2017 due to wildfires
• Wildfires may be an important episodic source of NH3in the summertime high Arctic in addition to the persistent seabird colony source
Correspondence to:
E. Lutsch,
elutsch@physics.utoronto.ca
Citation:
Lutsch, E., Strong, K., Jones, D. B. A., Ortega, I., Hannigan, J. W., Dammers, E. et al. (2019).
Unprecedented atmospheric ammonia concentrations detected in the high Arctic from the 2017 Canadian wildfires. Journal of Geophysical
Research: Atmospheres, 124. https:// doi.org/10.1029/2019JD030419
Received 2 FEB 2019 Accepted 15 JUN 2019
Accepted article online 8 JUL 2019
©2019. American Geophysical Union. All Rights Reserved.
July and August 2014, simultaneous enhancements of NH3and the long-lived biomass burning tracers car-bon monoxide (CO), hydrogen cyanide (HCN), and ethane (C2H6) were detected and attributed to wildfires in the Great Slave Lake (61.67◦N, 114.00◦W) region of the Northwest Territories. Enhancements of these species in 2014 were also detected using ground-based FTIR measurements in Toronto (43.66◦N, 79.40◦W), Ontario (Lutsch et al., 2016). Accounting for loss of NH3during transport to each site, Lutsch et al. (2016) estimated a gas-phase NH3lifetime in the smoke plume of ≈2 days, which would allow for long-range transport of gas-phase NH3. However, since FTIR measurements of this kind sample the smoke plume at a distance from the fire source, the lifetime may be considerably shorter near the fire source due to the rapid gas-aerosol partitioning (Paulot et al., 2017). It is also possible that the lifetime of NH3may be prolonged by injection of wildfire emissions into the free troposphere, mitigating depositional and chemical losses; how-ever, the physical and chemical mechanisms leading to the long-range transport of gas-phase NH3within a smoke plume remain uncertain.
In the high Arctic, in situ shipborne measurements of NH3were performed by Wentworth et al. (2016) as part of the 2014 NETCARE (Network on Climate and Aerosols; Abbatt et al., 2019) Campaign in the Cana-dian Archipelago during July and August 2014. These measurements indicated enhancements of surface layer NH3in the Lancaster Sound region (74◦N, 84◦W), which were attributed in part to the 2014 North-west Territories wildfires. At higher latitudes near Alert (82.50◦N, 62.35◦W), Nunavut, surface layer NH3 was attributed to local seabird colony and tundra sources. Surface layer NH3concentrations were found to range from 40 to 870 pptv during the 2014 NETCARE Campaign, with greatest concentrations occurring near Lancaster Sound. It has been concluded from several studies that seabird guano is a persistent source of NH3in the high Arctic summer (Blackall et al., 2007; Croft et al., 2016; Riddick et al., 2012; Wentworth et al., 2016). Emissions of NH3from seabird colonies have been associated with neutralization of aerosols (Wentworth et al., 2016) and the production of cloud condensation nuclei, which may contribute to a neg-ative radineg-ative forcing of 1–2 W/m2in regions of high seabird colony NH
3emissions (Croft et al., 2016). As was suggested by Lutsch et al. (2016), it is likely that boreal wildfires may be a considerable episodic source of NH3to the high Arctic, in addition to the persistent seabird colony source during the Arctic warm sea-son. Currently, the influence of wildfire NH3emissions on the Arctic remains unknown due to the scarcity of observations and episodic nature of wildfire events. Furthermore, the relative influence of wildfire and seabird colony NH3has not been evaluated on a long-term time scale.
Global satellite observations of NH3have been routinely made by several thermal infrared instruments since 2002: Atmospheric Infrared Sounder (AIRS; Warner et al., 2016; starting in 2002), the Tropospheric Emission Spectrometer (TES; Shephard et al., 2011, 2015; starting in 2004), Infrared Atmospheric Sounding Interfer-ometer (IASI; Van Damme et al., 2015; starting in 2006), and Cross-track Infrared Sounder (CrIS; Shephard & Cady-Pereira, 2015; starting in 2011). These instruments have been used in a number of studies to quan-tify NH3emissions from boreal wildfire sources. Emission ratios of NH3were derived from TES observations for the 2007 Alaskan wildfires (Alvarado et al., 2011) and the 2010 Russian wildfires (R'Honi et al., 2013). CrIS has been utilized for studies of wildfires in Northern Canada (Adams et al., 2019; Kharol et al., 2018; Whaley et al., 2018); and the IASI instrument has been used to investigate emissions from the 2008 Siberian wildfires (Coheur et al., 2009), the 2016 Fort McMurray wildfires in Alberta, Canada (Adams et al., 2019), and Alaskan wildfires from 2009–2013 (Paulot et al., 2017). IASI observations have also been utilized in sev-eral studies of tropical biomass burning (Whitburn et al., 2015, 2016, 2017) in addition to global emission studies (Van Damme et al., 2018). Observations of NH3in the Arctic from these satellite instruments remain sparse due to the low concentrations of NH3, in addition to the low thermal contrast and high cloud cover of the Arctic region.
The use of ground-based FTIR instruments in the Arctic is advantageous as these instruments provide suf-ficient sensitivity to the free troposphere where transported wildfire emissions are most abundant (Petetin et al., 2018), in addition to having a lower detection limit than satellite observations (Dammers et al., 2016). The study of Lutsch et al. (2016) utilized the FTIR NH3 retrieval method of Dammers et al. (2015) to retrieve NH3total columns at Eureka, Nunavut. The use of FTIR measurements also allows for simulta-neous measurements of the long-lived biomass burning tracers carbon monoxide (CO), hydrogen cyanide (HCN), and ethane (C2H6), along with a multitude of other biomass burning species (Paton-Walsh et al., 2005; Paton-Walsh et al., 2010; Vigouroux et al., 2012; Viatte et al., 2013, 2015; Zhao, 2002). Measurements of CO, HCN, and C2H6in addition to NH3provides insight into the origin, transport, and aging of the smoke plume. The utilization of ground-based FTIR measurement sites in the Arctic provides a long-term time
series of NH3and other trace gases where measurements from other platforms are lacking sensitivity or are nonexistent.
The transport of wildfire emissions of NH3to the Arctic has not been thoroughly investigated in global chemical transport models, while in general, accurate modeling of the Arctic atmosphere remains difficult. Both Wentworth et al. (2016) and Croft et al. (2016) used the GEOS-Chem chemical transport model (CTM) to investigate the influence of seabird colony NH3in the Canadian Arctic. Wildfire emissions of NH3were included in these studies but were not explicitly examined, although Wentworth et al. (2016) noted that in the GEOS-Chem model, NH3from the 2014 Northwest Territories wildfires contributed significantly to sur-face layer NH3in the low Arctic. Kharol et al. (2018) examined the deposition of NH3at northern latitudes with CrIS observations and the GEM-MACH (Global Environmental Multi-scale-Modelling Air quality and Chemistry) model and found NH3deposition fluxes 2 to 3 times greater in the presence of wildfires. Depo-sition of NH3in the Arctic was not examined in this study. Due to the scarcity of NH3measurements in high-latitude regions and the episodic nature of wildfire events, more effort is needed to evaluate model performance in order to infer the influence of wildfire NH3in the Arctic from model results.
In this paper, we examine two separate wildfire events in British Columbia (BC) and the Northwest Territo-ries (NWT) of Canada in August 2017. We aim to quantify the influence of transported NH3from these events in the Arctic with the use of FTIR measurements at two high-Arctic sites: Eureka, Nunavut, and Thule, Greenland. The simultaneous influence of the BC and NWT wildfires resulted in the greatest observed enhancements of NH3in the decade-long time series at both Eureka (2006–2017) and Thule (1999–2017). The exceptional magnitude of these enhancements was due to the intensity of both the BC and NWT wild-fires, which resulted in volcano-like injection of smoke throughout the troposphere and lower stratosphere (Khaykin et al., 2018; Peterson et al., 2018). The record-setting magnitude of the 2017 BC wildfires, with over 1.2 × 10⁶ha burned (BC Wildfire Service, 2017), was the result of persistent warm temperatures and increased wildfire risk made substantially greater by anthropogenic climate change (Kirchmeier-Young et al., 2018). Given the extreme magnitude of this event, these wildfires present an opportunity to investi-gate the influence of wildfire NH3emissions on the Canadian high Arctic. The exceptional magnitude of transported NH3emissions from the 2017 BC and NWT wildfires may serve as a harbinger of future events as wildfire frequency and intensity are expected to increase in the future (Boulanger et al., 2014; Flannigan et al., 2009; Wotton et al., 2010, 2017).
The following sections in this paper are structured as follows. The ground-based FTIR instruments, GEOS-Chem model, and IASI observations used in this study are first described in section 2. The FTIR time series of NH3, CO, HCN, and C2H6are presented and discussed in section 3.1. Source attribution of the detected enhancements at Eureka and Thule are then examined with the use of the FLEXPART Langrangian transport model in section 3.2, while in section 3.3, enhancement ratios of NH3, HCN, and C2H6are cal-culated for fire-affected FTIR measurements at Eureka and Thule. These enhancement ratios give further insight into the wildfire source influence at each site. To interpret the FTIR measurements, the GEOS-Chem CTM is compared to FTIR and IASI measurements in sections 3.4 and 3.5, respectively, for NH3and CO. Lastly, the contribution of the transported wildfire emissions to surface and total column NH3and NH+
4in the Canadian high Arctic is evaluated in the GEOS-Chem model for the fire-affected period of 15–23 August 2017 and compared to the contribution from local seabird colony NH3sources.
2. Methods
2.1. FTIR Sites and Instruments
Trace gas profiles and integrated column amounts are retrieved from solar-absorption spectra obtained by two FTIR spectrometers: a Bruker IFS 125HR at the Polar Environment Atmospheric Research Labo-ratory (PEARL) in Eureka (80.05◦N, 86.42◦W), Nunavut, and a Bruker IFS 125HR at the Thule Air Base (TAB) in Thule (76.53◦N, 68.74◦W), Greenland. Detailed descriptions of the Eureka and Thule FTIR instru-ments are given by Batchelor et al. (2009) and Hannigan et al. (2009), respectively. Measureinstru-ments from both instruments contribute to the Network for Detection of Atmospheric Composition Change (NDACC; www.ndacc.org). Measurements are made in the mid-infrared at a resolution of 0.0035 cm−1using a KBr beam splitter with a spectral coverage of 700–5,000 cm−1, with both InSb (1,850–10,000 cm−1) and HgCdTe (600–6,000 cm−1) detectors and a series of optical filters. For both instruments, spectra are recorded contin-uously during clear-sky daylight hours by alternating between optical filters while a heliostat system tracks the Sun.
2.2. FTIR Retrievals
Solar-absorption spectra were processed using the SFIT4 retrieval algorithm (https://wiki.ucar.edu/display/ sfit4/) based on the optimal estimation method (Rodgers & Connor, 2003). Retrievals of CO, HCN, and C2H6at Eureka and Thule are performed following NDACC Infrared Working Group (IRWG) recommen-dations as described in Viatte et al. (2013, 2014, 2015) and Lutsch et al. (2016) and references therein. For both sites, retrievals of NH3were performed following the procedure of Lutsch et al. (2016) based on the method of Dammers et al. (2015). The SFIT4 forward model is a line-by-line radiative transfer model which uses temperature and pressure profiles from the National Centers for Environmental Prediction (NCEP) and spectroscopic parameters from HITRAN 2008 (Rothman et al., 2009). For each site, 40-year average (1980–2020) profiles from the Whole-Atmosphere Community Climate Model (WACCM V4; Eyring et al., 2007) were used as the a priori profiles for CO, HCN, and C2H6, while a priori profiles for NH3were derived from balloon-based measurements (Toon et al., 1999) taken near Fairbanks (64.84◦N, 147.72◦W), Alaska following Dammers et al. (2015).
For all retrievals, a full error analysis was performed following Rodgers and Connor (2003). The retrieval uncertainties include forward model parameter error and measurement noise error. Adding these in quadra-ture, average uncertainties for the retrieved total columns of CO, HCN, C2H6, and NH3are 5.4%, 4.6%, 4.2%, and 30.2%, respectively, for Eureka and 2.6%, 6.9%, 1.6%, and 12.5%, respectively, for Thule. The average degrees of freedom for signal (DOFS) for CO, HCN, C2H6, and NH3are 2.0, 2.4, 1.7, and 1.0, respectively, for Eureka and 3.0, 3.5, 1.7, and 1.1, respectively, for Thule. For CO, HCN, and C2H6, the total column-averaging kernels show peak values in the upper troposphere at both sites, whereas the total column-averaging ker-nels of NH3peak near the surface and decrease upward to 5 km. The shape of the total column-averaging kernel profiles is due to the vertical distribution of the species, which follows a similar structure to the a pri-ori profile. The minimum retrieved total columns of NH3are on the order of ∼1014molec/cm2in clear-sky conditions, which corresponds to NH3surface concentration of ∼0.1–0.3 ppbv. The surface concentration is estimated as the retrieved volume mixing ratio of the lowest level in the FTIR retrieval grid. The ambient concentrations of CO, HCN, and C2H6exceed the detection limits of the FTIR instrument under normal clear-sky conditions.
2.3. IASI Observations
We use CO and NH3total column abundances retrieved from observations by the IASI instrument on board the Metop-A satellite. The satellite has a polar Sun-synchronous orbit providing twice daily global coverage at 9:30 local time and 21:30 local time overpasses. The instrument has a scan swath width of approximately 2,200 km and observations have a circular footprint of ≈12 km in diameter at nadir (Clerbaux et al., 2009). We used the most recent CO and NH3data products (http://iasi.aeris-data.fr/). For CO, the FORLI-CO product (Hurtmans et al., 2012) was used, which has been validated against ground-based FTIR measure-ments and found to show good agreement with no significant bias (Kerzenmacher et al., 2012). For NH3, we use the latest ANNI-NH3-v2.1 product (Van Damme et al., 2017). The current ANNI-NH3-v2.1 version has not yet been compared to FTIR measurements, although the previous version, v1 (Whitburn et al., 2016), was validated using ground-based FTIR observations by Dammers et al. (2016) and Dammers et al. (2017). IASI has been found to underestimate NH3total columns by an average of ∼32% in comparison to FTIR observations. Greater underestimation (>50%) was observed for FTIR sites with low NH3total columns (< 5×10¹⁵molec/cm2), and IASI showed better agreement (∼22%) for FTIR sites with greater local NH
3total columns. The underestimation of IASI is the result of the dependence of the retrieval on the NH3 concentra-tion and the thermal contrast at the surface. For instance, Van Damme et al. (2015) and Van Damme et al. (2014) estimated a detection limit of 9.68 × 10¹⁵molec/cm2for a thermal contrast of 20 K, while a thermal contrast of 10 K corresponds to a detection limit of 1.69 × 10¹⁶molec/cm2. An approximate 3 ppbv surface layer NH3concentration was estimated as an average detection limit of IASI, although in an NH3plume with well-mixed concentrations in a thick boundary layer, the detection limit could be as low as 1 ppbv at the surface with sufficient thermal contrast (Clarisse et al., 2010).
2.4. GEOS-Chem Chemical Transport Model
The GEOS-Chem CTM (www.geos-chem.org), version v11.01, was used at a horizontal resolution of 2◦×2.5◦ with 47 vertical hybrid levels from the surface to 0.01 hPa in altitude. The model is driven with assimi-lated meteorological fields from the Goddard Earth Observing System version 5.11.0 (GEOS-FP) from the NASA Global Model and Assimilation Office (GMAO). For each simulation, an 8-month model spin-up was performed from 1 January to 1 August 2017. Transport and chemical operator time steps of 10 and
20 min, respectively, were chosen to minimize simulation errors (Philip et al., 2016). Global anthropogenic emissions are provided by the Emissions for Database for Global Atmospheric Research (EDGARv4.3.1; Janssens-Maenhout et al., 2013) emissions inventory. Global anthropogenic and natural NH3emissions are provided by Bouwman et al. (1997). Biomass burning emissions from the Global Fire Assimilation System (GFASv1.2 Kaiser et al., 2012) are used. GFAS provides global emissions for open fires on a 0.1◦×0.1◦grid at 3-hourly resolution, which are derived from assimilation of fire radiative power (FRP) observations of the Moderate Resolution Imaging Spectroradiometer (MODIS) on the Aqua and Terra satellites. The use of the GFAS emission inventory was chosen based on the availability of emissions for the 2017 period compared to the Global Fire Emission Database (GFEDv4), and the better representation of boreal North American emissions in comparison to the Fire Inventory from NCAR (FINNv1.0; Shi et al., 2015). Seabird colony NH3 emissions based on Riddick et al. (2012) were also included to investigate the contribution of seabird colony NH3emissions in the Arctic. Emissions were considered for seabird colonies located north of 50◦N following Wentworth et al. (2016) and Croft et al. (2016).
Surface emissions in GEOS-Chem v11.01, including biomass burning emissions, are released within the boundary layer, and boundary layer mixing is implemented using the nonlocal mixing scheme of Holtslag and Boville (1993). Simulated aerosol species include sulfate-nitrate-ammonium (Park, 2004; Park et al., 2006), with the sulfate-nitrate-ammonium chemistry based on the ISORROPIA II thermodynamic model (Fountoukis & Nenes, 2007), which partitions ammonia and nitric acid between the gas and aerosol phases. Dry deposition in GEOS-Chem is implemented following a standard resistance in series scheme (Wesely, 1989), with surface resistances for sulfate, nitrate, and ammonium aerosols as described by Zhang et al. (2001). Wet removal takes place in large-scale clouds and convective updrafts (Liu et al., 2001).
3. Results & Discussion
3.1. FTIR Time Series
The time series of CO, HCN, C2H6, and NH3total columns for Eureka and Thule are shown in Figure 1. For CO and C2H6, similar seasonal cycles, with a maximum in February and March and a minimum in July and August are observed as a result of the common anthropogenic source of these species from fossil fuel com-bustion and their main sink due to reaction with the hydroxyl radical (OH; Stein & Rudolph, 2007; Xiao et al., 2008). During the polar night, OH formation ceases and transport of pollutants from midlatitude regions (Klonecki, 2003; Stohl, 2006; Shindell et al., 2008) allows CO and C2H6to accumulate in the Arctic atmo-sphere. Decreasing total columns are observed throughout the spring and summer as a result of increased loss due to the production of OH during the sunlit season. Average lifetimes of CO and C2H6are ≈2 months (Singh & Zimmerman, 1992) and 3 months (Xiao et al., 2008), respectively, making them suitable tracers of long-range transport.
The seasonal cycles of HCN and NH3are opposite in phase to those of CO and C2H6as result of their different sources. The primary source of HCN is biomass burning, but plant and fungal emissions also represent considerable sources (Li et al., 2003). Due to its long atmospheric lifetime of ∼2–4 months (Li et al., 2000), HCN tends to accumulate in the atmosphere. Its main loss is a result of dry deposition to the ocean (Li et al., 2003) and reaction with OH and O1(D) (Cicerone & Zellner, 1983). For NH
3, the main source in the Arctic is from the hydrolysis of migratory seabird colony guano (Blackall et al., 2007; Riddick et al., 2012; Wentworth et al., 2016), while wildfires may present a considerable episodic source (Lutsch et al., 2016). As a result, the seasonal cycle of NH3shows a summer maximum at both sites, due to the presence of migratory seabirds and the influence of tundra and wildfire NH3emissions. However, the relative contributions of these sources have not yet been quantified on a multiyear time scale.
For the long-lived species CO, HCN, and C2H6, the seasonal amplitudes are similar between Eureka and Thule as these species are well mixed in the troposphere. For NH3, the mean total columns in the peak sum-mer months are over a factor of 2 greater at Thule than Eureka. Due to the short lifetime of gas-phase NH3, on the order of a few hours to a day, the transport of NH3surface emissions to the free troposphere is lim-ited (Adams et al., 2019). The Eureka FTIR is located at an altitude of 610 m a.s.l. (above sea level), whereas the Thule instrument is at 210 m a.s.l., and consequently the Thule measurements are more sensitive to the influence of surface emissions. Additionally, large seabird colonies have been identified on the western coast of Greenland (Circumpolar seabird data portal, 2018) and would likely contribute to the greater NH3 total columns at Thule.
Figure 1. Total column time series of CO, HCN, C2H6, and NH3for Eureka (left, 2006–2017) and Thule (right,
1999–2017). The colored points indicate measurements taken in 2017, while all other years are shown in gray. The black line indicates a third-order polynomial fit to all measurements.
For CO, HCN, and C2H6, enhanced total columns are periodically observed in May to September at Eureka and Thule, corresponding to the boreal wildfire season (Macias Fauria & Johnson, 2008). While enhance-ments of CO, HCN, and C2H6due to wildfire emissions are observed annually (Viatte et al., 2015), the only clear case of NH3wildfire emissions in the past was observed in July to August 2014 from the NWT wild-fires (Lutsch et al., 2016). However, this does not take into account possible missed events due to instrument downtime or nonclear sky conditions preventing measurements. For all species, the 2017 Canadian wild-fires in BC and NWT resulted in the greatest observed enhancements in the entire time series at both sites,
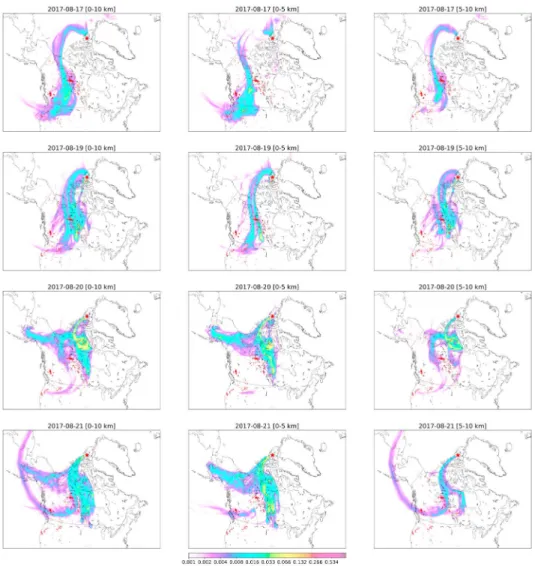
Figure 2. Typical FLEXPART sensitivity for Eureka on measurement days 17 and 19–21 August 2017. The red areas
indicate MODIS burned areas for 7 days prior to the time of measurement, and the location of the Eureka FTIR site is indicated by the red star. The vertical region (left column: 0–10 km, middle column: 0–5 km, and right column: 5–10 km) indicates the vertical range of released particles. FLEXPART = FLEXible PARTicle; MODIS = Moderate Resolution Imaging Spectroradiometer; FTIR = Fourier transform infrared.
which were on the order of 2–5 times their ambient concentrations. The source attributions for the observed enhancements due to wildfire emissions for the 2017 events are discussed in the following section.
3.2. Source Attributions
The FLEXPART (FLEXible PARTicle; Stohl et al., 2005) Lagrangian transport model is used to diagnose the sensitivity of FTIR measurements to source regions. Enhancements in the measured FTIR total columns are first identified by CO total columns that are a standard deviation of 1𝜎 greater than the monthly mean taken over all years of measurements at each site. The identified CO enhancements then define the period of fire-affected measurements. The days of fire-affected measurements are 17 and 19–21 August for Eureka and 19–22 August for Thule. It should be noted that nonclear sky conditions prevented measurements on 18 August at Eureka and for several days after 21 and 22 August for Eureka and Thule, respectively. For each day of fire-affected measurements, FLEXPART simulations are initialized for every hour of measurements. The FLEXPART model was run backward in time for 7 days, driven by meteorological data from the NCEP Climate Forecast System (CFS V2) 6-hr product (Saha et al., 2011). For each FLEXPART simulation, an ensemble of 1,000 air tracer particles was released over a 1-hr period from the surface to an altitude of 10 km. This vertical region was chosen in order to capture the likely altitude of the plume and the range where the CO total column measurement sensitivity is the greatest (total column averaging kernels at both sites show values near 1).
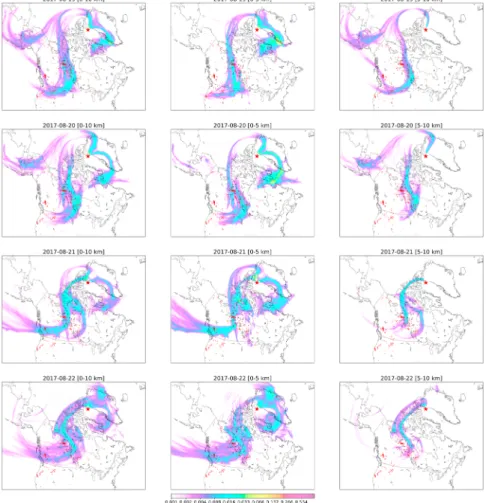
Figure 3. Same as Figure 2 but for Thule.
The sensitivity of the measurements to various source regions, or the so-called potential emission sensi-tivity (PES, in units of seconds), is proportional to the residence time of the air tracer particles. For each FLEXPART simulation, the sensitivity is considered for the following three cases:
(a) Residence time at the surface for all particles released in the tropospheric column (0–10 km); (b) Residence time at the surface for particles released in the lower-tropospheric column (0–5 km); (c) Residence time at the 5-km altitude surface for particles released in the upper-tropospheric column
(5–10 km).
For (a), all particles released from the 0- to 10-km altitude range are considered and the residence time at the surface is given, therefore, representing the tropospheric column sensitivity to surface emissions. For (b), the residence time at the surface of particles released in the lower troposphere (0–5 km) is considered and rep-resents the lower-tropospheric column sensitivity to near-surface emissions. For (c), only particles released in the upper troposphere are considered (5–10 km) and the residence time at the 5-km altitude surface is therefore indicative of upper-tropospheric sensitivity to emissions injected into the upper troposphere. In all three cases, the residence time is reported at the lowest level of the altitude range considered.
The FLEXPART sensitivities are shown in Figures 2 and 3 for Eureka and Thule, respectively. The MODIS Burned Area Product Collection 6 (Giglio et al., 2018) provides the locations of burned areas during the 7-day period of the FLEXPART simulation. It is seen in Figures 2 and 3 that sensitivity to fire-affected regions is observed for all days of fire-affected FTIR measurements at both sites; however, the lower and upper tropospheric sensitivity differ between measurement days as discussed below.
For Eureka on 17 August, the first day of fire-affected measurements, the FLEXPART PES for 0–10 km shows greatest sensitivity to the wildfires in the NWT, a number of smaller fires in the northwestern United States, and little sensitivity to the BC wildfires. A similar spatial distribution of the sensitivity is observed for the
Figure 4. The enhancement ratios of HCN, C2H6, and NH3at (left column) Eureka and (right column) Thule. The
gray points indicate all years of measurements. The colored points are measurements taken during the 2017 wildfire event where the colorbar represents the time of the measurement. The dashed black line is the linear regression to the colored points. The number of measurements (N), linear equation and correlation coefficient (r) are also shown.
0- to 5-km PES, although with no sensitivity to the NWT wildfires. For the 5- to 10-km PES, the sensitivity is primarily to the NWT wildfires, with no sensitivity to the other fire source regions. The difference in sensitivity between the 0- to 5- and 5- to 10-km PES implies that enhancements originating from the BC wildfires are due to near-surface emissions, and those from the NWT wildfires are due to upper tropospheric injection of emissions. On 19 August a similar spatial distribution is seen for the FLEXPART PES with some sensitivity observed to the BC wildfires and an eastward shift of the 0- to 5-km PES to the NWT fires. The FLEXPART PES on 17 and 19 August suggests that the main contribution to the enhanced total columns of
all species measured at Eureka is emissions from the NWT wildfires, with upper tropospheric injection of emissions being predominant on 17 August and near-surface emissions on 19 August. For 20 and 21 August at Eureka, the FLEXPART PES is similar for the 0- to 10-km range, indicating sensitivity to both the BC and NWT wildfires on those two days. The main sensitivity to the BC wildfires is observed for the 5- to 10-km PES with some sensitivity observed for the to 5-km PES. For the NWT wildfires, the sensitivities for the 0-to and 0-to 10-km PES are similar. On 20 and 21 August, the greater sensitivity 0-to BC wildfires for the 5-to 10-km PES suggests that the enhancements observed at Eureka on these days are the likely result of the upper tropospheric injection of emissions from the BC wildfires.
For Thule, the FLEXPART PES of Figure 3 shows similar spatial patterns between the four fire-affected mea-surement days from 19–22 August. On 19 August, sensitivity to both the BC and NWT wildfires is observed, with the main contribution from the NWT fires occurring in the 0- to 5-km range and the main contribution from the BC wildfires occurring in the 5- to 10-km range. For 20 August, the NWT wildfires are the pri-mary contributors to the measured total column enhancements for both the 0- to 5- and 5- to 10-km-altitude ranges. For 21 and 22 August, the spatial distribution of the FLEXPART PES is dominated by the 0- to 5-km range, indicating sensitivity to surface emissions from both the BC and NWT wildfires.
3.3. Trace Gas Correlations
Since the FTIR measurements are made at a distance from the fire source, the composition of the smoke plume is subject to physical and chemical processing. Therefore, we present the enhancement ratio of each species with respect to CO (Lefer et al., 1994) rather than the emission ratio (Akagi et al., 2011; Andreae & Merlet, 2001). The enhancement ratio is related to the emission ratio, which quantifies emissions near the source without the influence of plume aging. Since measurements are made downwind of the fire source, we did not account for background concentrations in the calculation of the enhancement ratio, or the so-called excess mixing ratio, since ambient concentrations of all species are likely to vary greatly over large spa-tial scales. The varying background conditions and influence of mixing may therefore cause uncertainty in interpreting the excess enhancement ratio (Yokelson et al., 2013).
To calculate the enhancement ratio for each species, enhanced CO measurements are identified by a stan-dard deviation of 1𝜎 from the monthly mean of all measurements, including enhancements, taken over all years, as described in section 3.2. The identified CO enhancements are then paired with the nearest mea-surement of the target species, HCN, C2H6, and NH3recorded within 1 hr, with each CO measurement only used once for each species. A 1-hr window was chosen in order to maximize the number of pairs for each species while being sufficiently short to minimize the effects of plume aging. In most cases, the differ-ences in measurement times between each species and the paired CO measurement were within 20 min. The enhancement ratio (in units of molec cm−2/molec cm−2) is then defined as the slope of the linear cor-relation of the target species relative to CO. The unified least squares procedure of York et al. (2004), which accounts for errors in both the ordinal and abscissa coordinates was used to determine a linear regression for the fire-affected measurements. The results of the linear regression are shown in Figure 4 and tabulated in Table 1.
For the case of a smoke plume originating from a single source, it is expected that a strong linear correlation would be found for the enhancement ratio, even over several days of measurements. This is particularly true for the long-lived species HCN and C2H6, as the lifetimes of these species are much greater than the plume travel times, which are generally on the order of several days. A strong linear correlation was observed for the enhancement ratios of HCN and C2H6at Eureka for the 2014 NWT fires (Lutsch et al., 2016) and sim-ilarly for the 2010 Russian fires (Viatte et al., 2013), with correlation coefficients (r) generally greater than 0.7 and in many cases greater than 0.85 for the enhancement ratios of HCN and C2H6taken over one week or more of measurements. For the fire-affected measurements detected at Thule in August 2017, the linear correlations are generally weaker with correlation coefficients of 0.66 and 0.64 for HCN and C2H6, respec-tively, taken over four days of fire-affected measurements. For Eureka, stronger correlations are observed, with correlation coefficients of 0.96 and 0.83 for HCN and C2H6, respectively. The strong correlations at Eureka are the result of measurements predominately being recorded over one day for HCN and 2 days for C2H6, therefore minimizing the influence of the variability of emissions and transport between days. For the enhancement ratios of NH3, the Eureka data show a much weaker linear correlation than Thule, with correlation coefficients of 0.08 and 0.68, respectively.
Table 1
Enhancement Ratios (molec cm−2/molec cm−2) for HCN, C
2H6, and NH3with Respect to CO for Each Day of
Fire-Affected Measurements at Eureka and Thule
HCN C2H6 NH3
Site Date N r EnhR N r EnhR N r EnhR
Eureka 2017-8-17 2 — — 3 — — 3 — — 2017-8-19 10 0.95 0.0036 (0.0005) 12 0.99 0.0113 (0.0011) 11 −0.56 −0.0033 (0.0004) 2017-8-20 2 — — 15 0.85 0.0059 (0.0009) 16 0.46 0.0018 (0.0004) 2017-8-21 0 — — 3 — — 9 −0.25 −0.0021 (0.0019) All 14 0.96 0.0038 (0.0004) 33 0.83 0.0130 (0.0011) 39 0.08 0.0033 (0.0003) Thule 2017-8-19 5 0.80 0.0147 (0.0147) 6 0.95 0.0133 (0.0253) 7 0.75 0.0164 (0.0069) 2017-8-20 8 0.89 0.0122 (0.0054) 14 0.54 0.0084 (0.0100) 9 0.81 0.0048 (0.0012) 2017-8-21 8 0.92 0.0041 (0.0019) 12 0.46 0.0033 (0.0054) 8 0.86 0.0050 (0.0009) 2017-8-22 8 0.82 0.0137 (0.0063) 13 0.64 0.0051 (0.0109) 8 0.49 0.0080 (0.0047) All 29 0.66 0.0143 (0.0022) 45 0.64 0.0060 (0.0035) 32 0.68 0.0111 (0.0014)
Note. Enhancement ratios were only calculated for days with five or more measurements for the species of interest. For each enhancement ratio calculated, the number of measurements (N) and the linear correlation coefficient (r) are also shown. The uncertainty on the calculated enhancement ratios are indicated by the value in parentheses, given by the standard error of the slope of the linear regression. Dates are formatted as year-month-day.
To examine the influence of the variability of the source sensitivities presented in section 3.2 on the mea-sured concentration of each species, the enhancement ratio of each species was calculated for each day of fire-affected measurements. The results are summarized in Table 1. The enhancement ratio for each species was calculated only if the number of measurements paired with CO for that day was greater than or equal to 5. For Eureka, on 17 August, nonclear sky conditions limited the number of measurements, and there-fore no enhancement ratios were calculated. On 19 August, the strongest linear correlations are found for HCN and C2H6at Eureka, with correlation coefficients of 0.95 and 0.99, and a negative correlation for the NH3enhancement ratio with a correlation coefficient of −0.56. A negative correlation has no physical inter-pretation but is due to the large variability of NH3as a result of transformation to its particulate phase or loss by deposition. Enhancement ratios of 0.0036 ± 0.0005 and 0.0113 ± 0.0011 for HCN and C2H6, respec-tively, were found to be in agreement with the enhancement ratios for the 2014 NWT wildfires of 0.0037 ± 0.0005 for HCN and 0.0126 ± 0.0005 for C2H6reported by Lutsch et al. (2016). The agreement is consistent with the FLEXPART PES of Figure 2 on 19 August, which shows sensitivity to wildfires in a nearby region to those identified by Lutsch et al. (2016), suggesting that a similar vegetation type was burned. The forest type for both the 2014 and 2017 NWT fires were classified as the Taiga Shield (Natural Resources Canada, 2013), consisting mainly of spruce trees, mosses, and lichens (Beaudoin et al., 2014). In contrast, the 2017 BC wildfires corresponded to the Montane Cordillera forest type, which primarily consists of Douglas fir and Ponderosa pine (Ireland & Petropoulos, 2015). On 20 August, measurements of HCN were limited at Eureka and no HCN enhancement ratio could be determined. A strong linear correlation was found for the C2H6enhancement ratio (r = 0.85) and a moderate linear correlation was found for NH3(r = 0.46). For 21 August, no enhancement ratios were found for HCN or C2H6, and the absence of a positive correlation was found for NH3with a poor correlation (r = −0.25).
The HCN enhancement ratios at Thule show strong linear correlations on individual measurement days, with correlation coefficients exceeding 0.80. The enhancement ratios of HCN at Thule are greater than at Eureka, likely due to the greater sensitivity to the BC wildfires (as shown in Figure 3) as compared to Eureka (shown in Figure 2). Additionally, for Thule, the sensitivities of both the BC and NWT wildfires tend to correspond to near surface emissions, commonly associated with smoldering combustion, which tends to have greater HCN emissions, while emissions of C2H6tend to have less dependence on burning phase as it is produced in both smoldering and flaming combustion processes (Burling et al., 2010; Burling et al., 2011). For Thule, lower correlation coefficients of C2H6enhancement ratios in comparison to those for HCN could also indicate that smoldering combustion was the dominant source of the smoke plume. However, the plume is likely a combination of both smoldering and flaming components that cannot be distinguished by ground-based measurements of this kind.
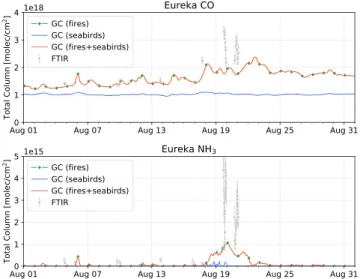
Figure 5. Smoothed GEOS-Chem CO (top) and NH3(bottom) total column
time series for the month of August 2017. The three GOES-Chem simulation scenarios are shown: fire emission only (green), seabird colony NH3emissions only (blue), and fire and seabird emissions (red). FTIR measurements are shown in gray along with their associated measurement uncertainties represented by the error bars. GC = GEOS-Chem; FTIR = Fourier transform infrared.
For Thule, the enhancement ratios of NH3illustrate positive linear cor-relations on all days; however, the enhancement ratios are quite variable between measurement days, with the greatest values (0.0164 ± 0.0069) measured on 19 August and a minimum (0.0048 ± 0.0012) on 20 August. The variability of NH3enhancement ratios at Thule is partly due to the differences in emission sensitivity between days, as shown in Figure 3, as is the variability of the enhancement ratios for longer-lived HCN and C2H6. In addition, it was shown here that the enhancement ratios of HCN and NH3at Thule were on average greater than those at Eureka. For the days of fire-affected measurements at both sites, Eureka was more pre-dominantly influenced by emissions from the NWT wildfires, whereas for Thule, greater sensitivity was observed to the BC wildfires. It has been found that for wildfires in the northern Rocky Mountains of the United States, a region of similar vegetation type to BC, the modified combus-tion efficiency (MCE) of these fires was substantially lower than for other coniferous dominated forest types (Urbanski, 2013). Lower MCE implies incomplete smoldering combustion (Ward & Hardy, 1991), resulting in greater emissions of reduced nitrogen compounds such as HCN and NH3 (Burling et al., 2011). The MCE of a fire is dependent on the vegetation type, fuel load, moisture, and meteorology, and therefore can be highly variable. Pyrolysis temperature has also been found to have a strong influ-ence on the emissions of HCN and NH3, with greater emissions of HCN and NH3for high-temperature and low-temperature pyrolysis, respec-tively (Sekimoto et al., 2018). It should be noted that Sekimoto et al. (2018) also found that low-temperature and high-temperature pyrolysis may not exactly correspond to smoldering and flaming combustion, respectively, while the pyrolysis-temperature emission profiles are similar between fuel types. The fuel types studied were representative of Western United States ecosystems consisting mainly of pine and fir species. However, the combination of larger HCN and NH3enhancements at Thule in com-parison to Eureka and the greater surface sensitivity of Thule measurements to the BC wildfires suggests that smoldering phase emissions from these fires were the dominant contribution to the measured enhance-ments at Thule. For Eureka, the comparison of the enhancement ratios in Table 1 and the FLEXPART sensitivities shown in Figure 3 suggest that the NWT wildfires were the main contribution for enhanced total columns of all species at Eureka for 17 and 19 August, and a combination of both the BC and NWT wildfires for 20 and 21 August.
3.4. GEOS-Chem Comparison to FTIR Measurements
Due to the scarcity of NH3measurements at the low concentrations often observed in the high Arctic, it is difficult to investigate the large-scale influence of wildfire NH3. The use of a chemical transport model allows for transported emissions of NH3to the Arctic to be simulated and therefore provides estimates of both surface and total column NH3concentrations in high Arctic regions. The FTIR measurements provide a means of evaluating model performance in the high Arctic. As a result of its long lifetime, atmospheric CO acts a tracer of wildfire emissions and is relatively unaffected by chemical aging during transport over several days. It therefore serves as a diagnostic of model transport and emissions. In contrast, NH3is short-lived and is strongly influenced by model chemistry and removal processes.
Comparisons of GEOS-Chem modeled CO and NH3 total columns were performed as follows. The GEOS-Chem partial column profiles were smoothed by the FTIR total column averaging kernel following Rodgers and Connor (2003). Smoothing removes biases due to the a priori profile and limited vertical sen-sitivity of the FTIR measurement and therefore allows the model total column to be treated as if it were measured using the ground-based FTIR instrument. For each GEOS-Chem model output time step, the pro-file was interpolated onto the FTIR vertical grid and smoothed by the mean FTIR total column averaging kernel taken over all years for the respective species and site. The smoothed GEOS-Chem total columns for CO and NH3at Eureka and Thule are shown in Figures 5 and 6, respectively, for the following three simulation scenarios:
1. Fire emissions only;
2. Seabird colony NH3emissions only; 3. Fire and seabird colony NH3emissions.
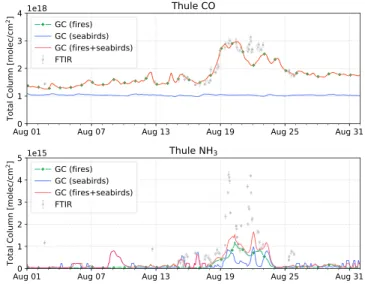
Figure 6. Same as Figure 5 but for Thule.
Scenario (1) allows for the contributions of wildfire emissions of NH3 to the Arctic to be examined, whereas scenario (2) is representative of background concentrations of NH3in the Arctic due to the persistent influence of local seabird colony NH3emissions during the warm sea-son. The inclusion of both seabird colony and fire emissions of scenario (3) represents the real-world case. It should be noted that inclusion of seabird colony NH3emissions in the model has little influence on CO, as seen in Figures 5 and 6. Gas-phase NH3concentrations do not neces-sarily respond linearly to additional NH3emissions. This nonlinearity is because NH3partitioning to particulate NH+4is sensitive to the amount of available sulfuric and nitric acid. The overall increase in CO in scenarios (1) and (3) in comparison to the seabird-only case of scenario (2) illus-trates the influence of accumulation of CO in the atmosphere from global biomass burning sources.
In Figure 5, there is some indication that GEOS-Chem captures the influence of the wildfire emissions during the period of enhanced FTIR measurements from 17–21 August, although the model is underestimat-ing the magnitude of the enhancements. For Thule, as shown in Figure 6, wildfire enhancements of CO observed in the FTIR measurements are well captured by the model. As discussed in section 3.2, Thule was predominantly influenced by the smoke plume originating from the BC wildfires, whereas these wildfires had a lesser influence at Eureka. As will be shown in the following sections, the GFAS emissions appear to underestimate the magnitude of the NWT plume in comparison to IASI measurements, resulting in the underestimation of modeled CO emissions at Eureka. In contrast, the plume originating from the BC wildfires shows better agreement between the model and IASI CO measurements.
The GEOS-Chem NH3simulation shows an underestimation in all three cases in comparison to the FTIR measurements at both sites. For Eureka, as shown in Figure 5, there is little influence of seabird colony NH3 emissions and therefore, GEOS-Chem NH3at Eureka is attributed to transported wildfire emissions. For Thule, as shown in Figure 6, the inclusion of both seabird colony NH3and fire emissions most accurately represents the FTIR measurements. It is also seen in Figure 6 that the influence of seabird colony and wildfire NH3appear to occur simultaneously; this is a result of the wind direction, transporting both seabird colony and wildfire emissions from north of Thule.
It has been found that the bidirectional exchange of NH3may extend the spatial influence of NH3emission sources (Whaley et al., 2018; Zhu et al., 2015), but it was not included in the model simulations here. How-ever, the locations of the seabird colonies are primarily in coastal regions, while the Arctic Ocean has been found to be a net sink of NH3(Wentworth et al., 2016). Therefore, transport of NH3from the larger seabird colonies of the Greenland coast to the Canadian Archipelago by bidirectional exchange processes would be limited. The influence of bidirectional exchange could likely be of greater importance for wildfire NH3. The deposition of wildfire NH3would increase the nitrogen pool at the surface, which may be released at later times, thereby prolonging the influence of wildfire NH3. Tundra emissions may also be a considerable source of NH3in the Arctic that was not considered here. Croft et al. (2019) reported an upper estimate of tundra NH3emissions, which was approximately 1.5 times the contribution from seabird colony sources in the Canadian Archipelago. Tundra NH3emissions are highly uncertain, but inclusion of these emissions in model simulations would likely increase background NH3concentrations as found by Croft et al. (2019). The general underestimation of both CO and NH3at Eureka and Thule, and the inability of the model to capture the magnitude of the enhancements, is possibly a result of underestimation of modeled emissions and the assumption of boundary layer emissions in GEOS-Chem that may not be realistic in many cases as wildfire emissions are often injected into the free troposphere (Turquety et al., 2007; Val Martin et al., 2010). Once injected into the free troposphere, transport patterns are likely to differ from the surface. Additionally, the loss processes may differ in the free troposphere, particularly for the short-lived NH3, which is subject to loss by wet and dry deposition and chemical loss. Injection of NH3into the free troposphere could favor the production of NH+
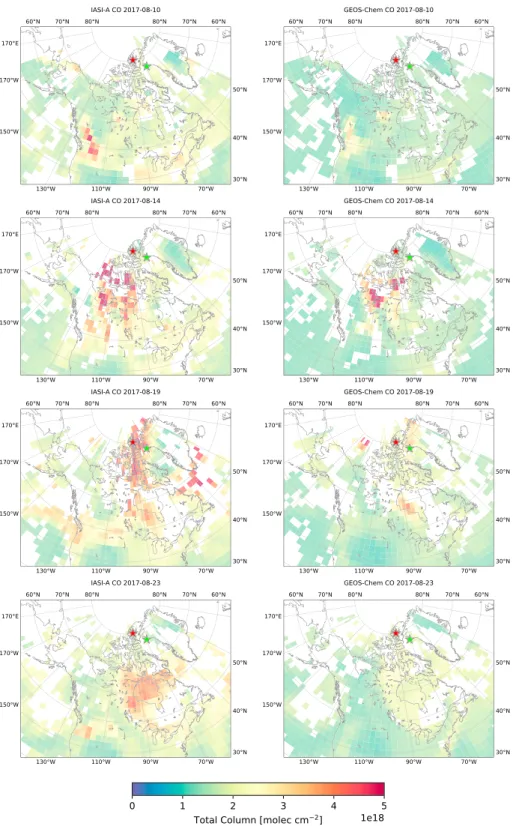
Figure 7. (left column) IASI CO measurements gridded onto the 2◦×2.5◦GEOS-Chem grid and daily averaged. (right column) GEOS-Chem CO total columns interpolated to match IASI overpass time and daily averaged. Locations of the FTIR sites Eureka and Thule are shown by the red and green stars, respectively. IASI = Infrared Atmospheric Sounding Interferometer; FTIR = Fourier transform infrared.
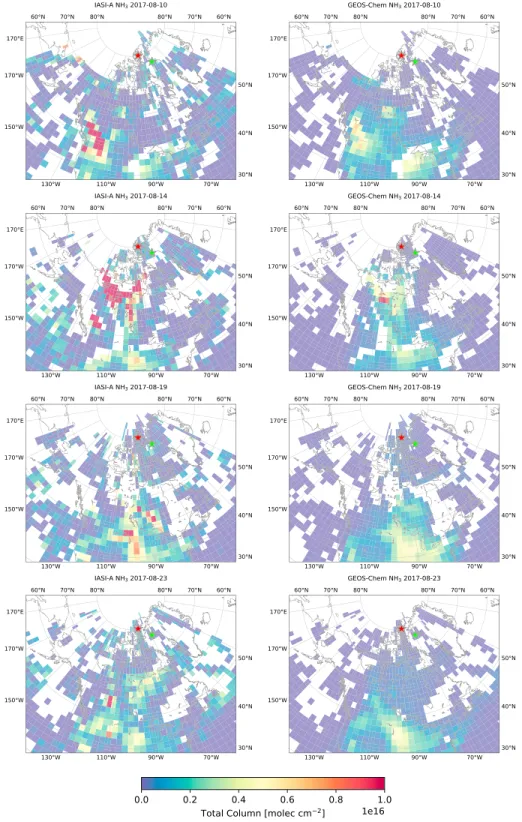
Figure 8. Same as Figure 7 but for NH3.
acid (HNO3), could also promote the production of ammonium nitrate (NH4HNO3). Loss of NH3by dry and wet deposition may also be limited due to the reduced turbulent diffusion and drier conditions of the free troposphere. Global models also tend to suffer from numerical diffusion errors (Eastham & Jacob, 2017; Rastigejev et al., 2010) as a result of the coarse vertical and horizontal resolution. Underestimation of plume transport due to numerical diffusion is, however, likely to be of minor importance in comparison to the lack of realistic wildfire emission injection heights.
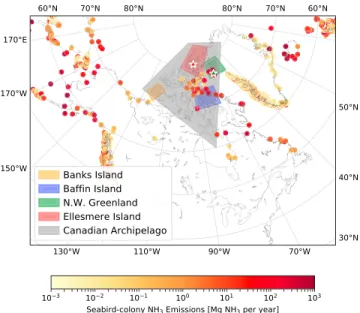
Figure 9. Locations chosen to evaluate spatially averaged GEOS-Chem NH3and NH+4surface concentrations and total
columns for the fire-affected period from 15–23 August 2017. Seabird colony NH3emissions in GEOS-Chem are also shown.
3.5. GEOS-Chem Comparison to IASI Measurements
To investigate the influence of possible transport and emissions errors in the GEOS-Chem model, a qual-itative comparison of GEOS-Chem CO and NH3from the fire-only scenario to measurements from IASI was performed over the entire domain of Canada and Greenland, from 40◦N, 180◦W to 86◦N, 15◦E. For comparison of the GEOS-Chem model to IASI observations, the following method was applied. For each day, the GEOS-Chem model output was interpolated to the overpass time and locations of each individual IASI observation, and IASI observations were subsequently gridded to the GEOS-Chem horizontal grid. The interpolated GEOS-Chem total columns and gridded IASI total columns were then daily averaged over the entire spatial domain. The results are shown in Figures 7 and 8 for CO and NH3, respectively, for selected days during the simulation period.
The results are shown for four days from 10 August 2017, corresponding to the initial start of the fire plume to 23 August 2017, when measurements at Eureka and Thule both return to ambient levels. On 10 August, the initial plume is observed to have originated in BC in the lower left of the domain of Figure 7. From the comparison of IASI to GEOS-Chem CO in Figure 7, it is seen that the spatial distribution of the fire source is well represented by the model using the GFAS emission inventory, although the model tends to underestimate the CO concentration within the plume. The second main wildfire source, located south of Great Slave Lake in the NWT, is also observed in both IASI and GEOS-Chem where good agreement is found between the two. On subsequent days, transport of both plumes poleward is observed. The general shape of the fire plume from the BC wildfires is well represented in GEOS-Chem, but is lower in magnitude than IASI. The NWT wildfires appear to be underestimated by the model in comparison to IASI on 14 August. Due to the influence of the BC wildfire plume, it is difficult to distinguish the individual contribution of the BC and NWT wildfires on the observed CO plume. Due to the vertical sensitivity of IASA, which tends to peak in the middle to upper troposphere (George et al., 2009; Hurtmans et al., 2012; Kerzenmacher et al., 2012), near-surface CO from the NWT wildfires may be underestimated by IASI observations on 14 August, while the transport of the plume from the BC wildfires becomes more visible as the plume is advected vertically. However, it is found that the CO plume originating from the NWT is generally of lower concentration in the model than IASI. This observation is consistent with the FLEXPART sensitivity analysis in section 3.2 and the comparisons of GEOS-Chem to the FTIR measurements in section 3.4. In section 3.2, it was shown that measurements at Eureka were more strongly influenced by the NWT wildfires than Thule, while a low bias in GEOS-Chem CO at Eureka, in comparison to the FTIR measurements, was shown in Figure 5, which is consistent with an underestimation of emissions from the NWT wildfires.
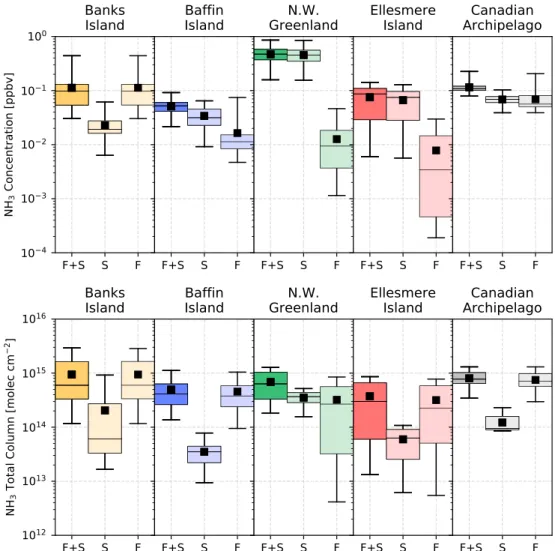
Figure 10. Box-and-whiskers plots of GEOS-Chem spatially averaged surface layer concentrations (top) and total
columns (bottom) of NH3from 15–23 August 2017 for the fire and seabird emissions (F+S), seabird-only (S), and
fire-only (F) simulations. The box indicates the quartile values of the data and the whiskers represent the range of the data. The black horizontal line indicates the median value and the black square is the mean of all data.
From 10 to 14 August in Figure 7, in both the IASI observations and model, the smoke plume originating in BC is transported poleward across central Canada and passes over the NWT wildfires. The combined plume is then transported north into the Canadian Arctic. On 17 August, the plume reaches Eureka, which is consistent with the FTIR enhancements. Transport of the plume toward Thule is also observed during this time, arriving at Thule on 19 August. From 20 August onward, the plume passes both Eureka and Thule before the CO total columns at both sites return to ambient levels on 24 August.
The emissions and transport of GEOS-Chem NH3show similar spatial and temporal variability to that of CO, as illustrated in Figure 8. While the transport of the NH3plume as observed by IASI is well repre-sented in GEOS-Chem, the modeled NH3total columns are low in comparison to IASI. Within the plume, the GEOS-Chem NH3may be a factor of 2 lower than IASI. On 10 August, GEOS-Chem modeled NH3total columns are are substantially less influenced by the BC wildfires. On subsequent days, the NH3plume dis-sipates rapidly, resulting in decreased total columns as the plume is transported poleward. On 14 August, the loss of NH3is particularly evident as the plume originating from the BC wildfires has reached the NWT wildfire source. As was observed in the IASI CO observations shown in Figure 7, the plume originating in BC is indistinguishable from the NWT wildfire source region. For NH3, IASI shows similar results with high values in the regions exceeding 5 × 10¹⁶molec/cm2. GEOS-Chem NH
3does not exhibit these high values within the plume although the NWT wildfire source can clearly be distinguished from the plume in the
Figure 11. Same as Figure 10 but for NH+4.
model. On following days, the modeled NH3plume dissipates as it is transported poleward, resulting in the underestimation of GEOS-Chem in comparison to the FTIR measurements, as was shown in section 3.4.
3.6. GEOS-Chem NH3and NH+4 in the Arctic
In this section, GEOS-Chem is used to estimate the influence of wildfire NH3on surface layer and total col-umn concentrations in the Canadian Arctic. As was shown in sections 3.4 and 3.5, the model underestimates the transport of wildfire NH3in comparison to FTIR and IASI measurements. As such, we would expect modeled wildfire NH3in the Arctic to also have a low bias. We also consider the influence of NH+
4. The sum of NH3and NH+4 is defined as total ammonia (NHx≡ NH3+NH+4) and is an important contribution to reactive nitrogen. After emission, NH3will partition rapidly to an equilibrium state with NH+4. The relative amounts of NH3and NH+4are dependent on the availability of reactants and temperature. For wildfire emis-sions, it has been found that a large fraction (up to 30%) of emitted NH3is converted to NH+4 within 1.4 hr (Yokelson et al., 2009). Due to the longer lifetime of NH+
4, from several days to weeks, this would enable long-range transport and therefore NH+
4could be an important contributor to reactive nitrogen in the Arctic (Karlsson et al., 2013).
To examine the surface influence of wildfire NH3and NH+4in the Arctic, the following five regions of interest were chosen: Banks Island, Baffin Island, Northwestern Greenland, Ellesmere Island, and the Canadian Archipelago (shown in Figure 9). These regions represent locations within the high Arctic, both with and without seabird colonies. Banks Island does not contain any considerable seabird colonies and is closest in proximity to the wildfire source regions. Ellesmere Island includes the Eureka FTIR site and is free of any considerable seabird colonies. While some seabird colonies are present in the Baffin Island region, it is also
Table 2
GEOS-Chem NH3and NH+
4Surface Concentrations and Total Columns in the Regions Defined in Figure 9 Temporally
Averaged From 15–23 August 2017
NH3 NH+
4
Fires+Seabirds Seabirds Fires Fires+Seabirds Seabirds Fires Surface concentration (ppbv) Banks Island 0.11 (0.08) 0.02 (0.01) 0.11 (0.08) 1.07 (1.37) 0.07 (0.03) 1.07 (1.37) Baffin Island 0.05 (0.01) 0.03 (0.01) 0.02 (0.01) 0.08 (0.05) 0.05 (0.02) 0.07 (0.05) Northwestern Greenland 0.47 (0.16) 0.45 (0.15) 0.01 (0.01) 0.08 (0.05) 0.03 (0.01) 0.06 (0.05) Ellesmere Island 0.07 (0.04) 0.07 (0.04) 0.01 (0.01) 0.06 (0.04) 0.02 (0.01) 0.05 (0.04) Canadian Archipelago 0.12 (0.03) 0.07 (0.01) 0.07 (0.03) 0.43 (0.45) 0.05 (0.00) 0.42 (0.45) Total column (1015molec /cm2)
Banks Island 0.94 (0.78) 0.20 (0.28) 0.94 (0.79) 25.44 (43.68) 1.32 (0.86) 25.44 (43.67) Baffin Island 0.49 (0.28) 0.03 (0.02) 0.45 (0.27) 2.95 (1.48) 0.71 (0.10) 2.93 (1.48) Northwestern Greenland 0.69 (0.37) 0.35 (0.10) 0.32 (0.29) 2.68 (1.63) 0.59 (0.12) 2.65 (1.64) Ellesmere Island 0.37 (0.30) 0.06 (0.03) 0.32 (0.28) 2.93 (1.43) 0.65 (0.17) 2.92 (1.43) Canadian Archipelago 0.80 (0.24) 0.12 (0.05) 0.75 (0.25) 7.12 (6.07) 0.85 (0.11) 7.11 (6.07)
Note. The values in parentheses indicate the standard deviation of the mean. Results are shown for the three GEOS-Chem simulations: fire and seabird NH3emissions, fire-only, and seabird-only emissions.
strongly influenced by seabird colony NH3emissions from Greenland. The Northwestern Greenland region was chosen to include the location of the Thule FTIR site and the seabird colonies of the northwestern coast of Greenland and therefore represents the extreme case of high seabird colony NH3emissions. Lastly, the Canadian Archipelago region is representative of the majority of the Canadian high Arctic and includes all of the aforementioned regions. For each of these five regions, the GEOS-Chem grid boxes that lie within the defined boundaries illustrated in Figure 9 are spatially averaged for each 2-hourly GEOS-Chem output timestep from 15–23 August 2017, which corresponds to the period of fire-affected FTIR measurements at Eureka and Thule. We consider the following three GEOS-Chem simulation scenarios: (1) fire emissions only, (2) seabird colony NH3emissions, (3) fire and seabird colony NH3emissions. The results are shown in Figures 10 and 11 and are tabulated in Table 2.
As shown in Figure 10 and Table 2, it is found that the greatest NH3surface concentrations occur in north-western Greenland with a mean value of 0.47 ppbv in the GEOS-Chem simulation with fire and seabird colony NH3emissions. From the seabird-only simulation, it is evident that the seabird colony NH3emissions are the dominant contribution in this region, with a mean surface layer contribution of 0.45 ppbv. Ellesmere Island is also strongly influenced by seabird colony NH3emissions, with a mean surface concentration of 0.07 ppbv with a standard deviation of 0.04 ppbv from the seabird-only simulation and 0.01 ppbv with a stan-dard deviation of 0.01 ppbv from the fire-only simulation. Baffin Island shows nearly equal contributions from the seabird colony (0.02 ppbv) and wildfires (0.03 ppbv). Banks Island is predominantly influenced by wildfire emissions, with a mean surface concentration from the fire-only simulation of 0.11 ppbv. These results are consistent with the loss of NH3in the plume by deposition in the low-latitude regions (Banks Island and Baffin Island), with decreasing surface layer influence in the high-latitude regions (Northwest-ern Greenland and Ellesmere Island). For the period of fire-affected measurements from 15–23 August, wildfire and seabird colony NH3had equal contributions 0.07 ppbv to surface layer NH3over the Canadian Archipelago. However, in all regions, total column concentrations of NH3were predominantly due to wild-fire NH3emissions, with the exception of Northwestern Greenland. In this region, the seabird colony and wildfire NH3emissions had nearly equivalent contributions of 0.35 and 0.32 × 10¹⁵molec/cm2, respectively. The surface layer concentrations of NH+
4show somewhat similar results to those for NH3, with greater influ-ence of wildfire NH+
4for the lower-latitude regions, as seen in Figure 11 and Table 2. In all regions, wildfire emissions are the dominate source of NH+
4, with mean surface layer concentrations ranging from 1.07 ppbv for Banks Island and to 0.05 ppbv at Ellesmere Island. Over the Canadian Archipelago, a mean concentration of 0.42 ppbv was found, with large variation (standard deviation of 0.45 ppbv) due to the spatial and tempo-ral variability of the plume during the fire-affected period. As was the case for NH3, total column amounts
of NH+
4 are greatly enhanced due to the transport of wildfire emissions, with a mean wildfire contribution of 7.11 × 10¹⁵molec/cm2in the Canadian Archipelago for the fire-only simulation.
It can therefore be concluded that the 2017 Canadian wildfires events had a significant influence on surface layer NH3and NH+4. It should be noted that although these enhancements occurred over a short period of time, from 15–23 August, the enhanced surface layer concentrations of NH3were comparable to the persistent contribution of seabird colony NH3. For NH+4, the influence of wildfire emissions greatly enhanced both surface layer and total column concentrations in all regions. As was discussed in sections 3.4 and 3.5, GEOS-Chem was shown to underestimate the transport of wildfire NH3and CO in comparison to FTIR and IASI observations. It is therefore likely that the modeled influence of transported wildfire emissions on Arctic NH3and NH+
4presented here is a low estimate.
The influence of wildfires on the reactive nitrogen budget of the high Arctic remains unknown. It has been shown that the Arctic has been undergoing an increase in the areal extent of vegetated land as a result of warming in the Arctic (Keenan & Riley, 2018; Myneni et al., 1997; Zhu et al., 2016) and increased commu-nity plant height has also been observed as a result of this warming (Bjorkman et al., 2018). Plant growth in the Arctic is strongly limited by nutrient availability (Schimel & Bennett, 2004), therefore the wildfire con-tribution to nitrogen deposition in the form of NHxcould potentially facilitate an increase in plant growth, especially if extreme wildfire events such as these become more frequent. The effects on nitrogen deposi-tion in the Canadian high Arctic are still uncertain, although it has been noted that high Arctic tundra has a high capacity for nitrogen pollution retention, resulting in a major source of eutrophication (Choudhary et al., 2016), which could have a negative impact on biodiversity.
4. Conclusions
The 2017 BC and NWT wildfires resulted in the greatest observed enhancements of total column NH3, CO, HCN, and C2H6in the decade-long time series of FTIR measurements at Eureka, Nunavut, and Thule, Greenland. The magnitude of the these enhancements was on the order of 2–5 times the ambient levels of these species at each site. The observed NH3enhancements provide evidence for the importance of wild-fires as an episodic source of NH3in the summertime Arctic, supporting the results of Lutsch et al. (2016). Enhancement ratios of NH3, HCN, and C2H6were calculated with respect to CO at both sites. It was found that variations in these enhancement ratios were due to the influence of multiple fire plumes and variations in the burning phases of the fire events. Evidence for this was provided by FLEXPART sensitivities which showed the influence of the BC and NWT plumes, with the influence of each fire source varying between measurement days at both sites. Eureka FTIR measurements were found to be most sensitive to the NWT wildfires, and Thule FTIR measurements were most sensitive to the BC wildfires, based on the FLEXPART sensitivity analysis.
The GEOS-Chem CTM was used to simulate the transport of wildfire emissions to the Arctic. Through com-parisons of GEOS-Chem NH3and CO to FTIR measurements at Eureka and Thule, and to observations from IASI, it was shown that the model underestimates the transport of wildfire emissions to the Arctic for the observations examined here. The underestimation of modeled NH3and CO in comparison to Eureka FTIR measurements suggests an underestimation of emissions from the NWT fire source. This is consistent with the model comparisons to IASI measurements, which suggested an underestimation of emissions from the NWT wildfires in the model. At Thule, GEOS-Chem showed good agreement to the FTIR measurements for CO, but underestimated the wildfire NH3contribution. The reason for the underestimation of GEOS-Chem CO and NH3in comparison to FTIR and IASI measurements remains unclear and is likely the result of sev-eral factor including the underestimation of emissions, plume height, chemistry, and transport errors in the model. These aspects of the model should be investigated in future studies. Increased temporal and spatial sampling of NH3and NH+
4by in situ, ground-based and satellite instruments is recommended to better eval-uate model performance and infer wildfire impacts on NH3in the Arctic. Tundra NH3emissions should be examined in these studies. Furthermore, the use of satellite observations, such as the studies of Kharol et al. (2018) and Adams et al. (2019), should also be the focus of future work in order to quantify boreal wildfire NH3emissions and transport to the Arctic.
Simulated transport of wildfire emissions in GEOS-Chem was found to be a significant contributor to reac-tive nitrogen in the form of NH3and NH+4 in the high Arctic for the fire-affected period of 15–23 August 2017. GEOS-Chem surface layer NH3and NH+4 was shown to be greatly enhanced during the fire-affected