HAL Id: hal-00304103
https://hal.archives-ouvertes.fr/hal-00304103
Submitted on 16 Apr 2008HAL is a multi-disciplinary open access
archive for the deposit and dissemination of sci-entific research documents, whether they are pub-lished or not. The documents may come from teaching and research institutions in France or abroad, or from public or private research centers.
L’archive ouverte pluridisciplinaire HAL, est destinée au dépôt et à la diffusion de documents scientifiques de niveau recherche, publiés ou non, émanant des établissements d’enseignement et de recherche français ou étrangers, des laboratoires publics ou privés.
The travel-related carbon dioxide emissions of
atmospheric researchers
A. Stohl
To cite this version:
A. Stohl. The travel-related carbon dioxide emissions of atmospheric researchers. Atmospheric Chem-istry and Physics Discussions, European Geosciences Union, 2008, 8 (2), pp.7373-7389. �hal-00304103�
ACPD
8, 7373–7389, 2008 Scientists’ CO2 emissions A. Stohl Title Page Abstract Introduction Conclusions References Tables Figures ◭ ◮ ◭ ◮ Back CloseFull Screen / Esc
Printer-friendly Version Interactive Discussion Atmos. Chem. Phys. Discuss., 8, 7373–7389, 2008
www.atmos-chem-phys-discuss.net/8/7373/2008/ © Author(s) 2008. This work is distributed under the Creative Commons Attribution 3.0 License.
Atmospheric Chemistry and Physics Discussions
The travel-related carbon dioxide
emissions of atmospheric researchers
A. Stohl
Norwegian Institute for Air Research, Kjeller, Norway
Received: 26 March 2008 – Accepted: 30 March 2008 – Published: 16 April 2008 Correspondence to: A. Stohl ([email protected])
ACPD
8, 7373–7389, 2008 Scientists’ CO2 emissions A. Stohl Title Page Abstract Introduction Conclusions References Tables Figures ◭ ◮ ◭ ◮ Back CloseFull Screen / Esc
Printer-friendly Version Interactive Discussion
Abstract
Most atmospheric scientists agree that greenhouse gas emissions have already caused significant changes to the global climate system and that these changes will accelerate in the near future. At the same time, atmospheric scientists who – like other scientists – rely on international collaboration and information exchange travel
5
a lot and, thereby, cause substantial emissions of carbon dioxide (CO2). In this
pa-per, the CO2emissions of the employees working at an atmospheric research institute (the Norwegian Institute for Air Research, NILU) caused by all types of business travel (conference visits, workshops, field campaigns, instrument maintainance, etc.) were calculated for the years 2005–2007. It is estimated that more than 90% of the
emis-10
sions were caused by air travel, 3% by ground travel and 5% by hotel usage. The travel-related annual emissions were between 1.9 and 2.4 t CO2per employee or
be-tween 3.9 and 5.5 t CO2per scientist. For comparison, the total annual per capita CO2
emissions are 4.5 t worldwide, 1.2 t for India, 3.8 t for China, 5.9 t for Sweden and 19.1 t for Norway. The travel-related CO2emissions of a NILU scientist, occurring in 24 days
15
of a year on average, exceed the global average annual per capita emission. Nor-way’s per-capita CO2 emissions are among the highest in the world, mostly because of the emissions from the oil industry. If the emissions per NILU scientist derived in this paper are taken as representative for the average Norwegian researcher, travel by Norwegian scientists would nevertheless account for a substantial 0.2% of Norway’s
20
total CO2 emissions. Since most of the travel-related emissions are due to air travel,
water vapor emissions, ozone production and contrail formation further increase the relative importance of NILU’s travel in terms of radiative forcing.
1 Introduction
The global atmospheric concentration of carbon dioxide (CO2) has increased from a
25
ACPD
8, 7373–7389, 2008 Scientists’ CO2 emissions A. Stohl Title Page Abstract Introduction Conclusions References Tables Figures ◭ ◮ ◭ ◮ Back CloseFull Screen / Esc
Printer-friendly Version Interactive Discussion source of this increased atmospheric concentration results from fossil fuel use, with
land-use change providing another significant but smaller contribution. The enhanced atmospheric CO2 concentrations produced a radiative forcing of 1.66 W m−2 in the
year 2005 (IPCC,2007), which is the largest contribution of all forcing agents to the total radiative forcing. The transport sector is one of the largest sources, contributing
5
about 19% of all CO2emissions according to the EDGAR 3.2 fast track inventory for the
year 2000 (Olivier et al.,2001). Emissions of CO2 by aircraft were 0.51 Gt CO2/year
in 1992, about 2% of total anthropogenic carbon dioxide emissions or about 13% of carbon dioxide emissions from all transportation sources (Penner et al.,1999). Aircraft emissions have been growing at a fast rate and in 2005 have reached about 0.65 Gt
10
CO2/year (Kim et al.,2007).
Most atmospheric scientists are concerned that greenhouse gas emissions have al-ready caused significant changes to the global climate system and that these changes will accelerate in the near future. At the same time, atmospheric scientists – as all other scientists – rely on the international exchange of information and on international
15
collaboration. Often, this requires traveling to conferences, workshops or project meet-ings. Atmospheric researchers also perform field campaigns or maintain monitoring sites in sometimes remote locations. The CO2 emissions from the resulting travel, if
counted on a per-capita basis, are likely to be substantial. However, to my knowledge this has never been properly quantified and published in the open literature.
20
In this paper, I make a first case study by estimating the CO2 emissions caused by
all business trips undertaken by the employees of my institute, the Norwegian Institute for Air Research (NILU), during the years 2005–2007. NILU’s staff has grown from 134 to 160 persons during this period, 60 to 79 of whom were scientists (Table1). Most of NILU’s employees are working in Kjeller (about 20 km outside Oslo) but NILU also has
25
a small office in Tromsø with a staff of about 12 consisting mainly of scientists. I am quantifying the CO2 emissions caused by air travel, ground transportation and hotel
use. I am ignoring all other emissions (e.g., related to food consumption, purchase of goods, use of conference facilities and materials, etc.), assuming that they are either
ACPD
8, 7373–7389, 2008 Scientists’ CO2 emissions A. Stohl Title Page Abstract Introduction Conclusions References Tables Figures ◭ ◮ ◭ ◮ Back CloseFull Screen / Esc
Printer-friendly Version Interactive Discussion negligible or would have occurred also at home. Furthermore, only emissions caused
directly by business trips are calculated; emissions from the daily commute to work, the operation of the institute (e.g., building heating), or occurring in the scientists’ private life, are not accounted for. Finally, I am comparing the business-travel-related CO2
emissions to the total emissions from various countries on a per-capita basis.
5
2 Methods
The basis for this study are files available from NILU’s administration department list-ing all trips undertaken by NILU’s staff durlist-ing the years 2005–2007. The files con-tain the travelers’ names, the reasons for a trip, its duration and destination. The destinations’ geographical coordinates, if unavailable, were determined by
search-10
ing for city and other location names in the Wikipedia on-line encyclopedia (see
http://en.wikipedia.org/wiki/Main Page). Most of the coordinates are not those of an airport but of the traveller’s final destination. Figure1shows all destinations and great circle routes from the home airport, and Table 2lists the number of trips undertaken every year (381–557). It is seen that while European destinations generally dominate,
15
a substantial number of trips were made to destinations outside Europe. Travel within Norway, except for travel between the offices in Kjeller and Tromsø (also an almost 2-hour-long flight), is relatively unimportant. Trips in the institute’s immediate vicinities were ignored completely while for the remaining trips within Norway it was assumed that air travel was used. Errors resulting from these assumptions would impact the
20
annual CO2budget by less than 1%.
From the available information, the total flight distance covered by a trip is calculated to be
D = 2F1F2DGC (1)
where DGC is the great-circle distance between the Oslo (or Tromsø) airport and the
25
ACPD
8, 7373–7389, 2008 Scientists’ CO2 emissions A. Stohl Title Page Abstract Introduction Conclusions References Tables Figures ◭ ◮ ◭ ◮ Back CloseFull Screen / Esc
Printer-friendly Version Interactive Discussion average deviation of actual flight lengths from great circle distance (about 10 percent
according toKim et al.,2007), and F2is an empirical correction factor. The factor F2is applied here because only the final destination of a trip is known but the actual routing may have involved more than one flight which increases the total distance traveled and also reduces the fuel use efficiency as shorter flights have a lower efficiency (see
5
below). We take F2to be 1.0 and 1.2 for DGCless than 800 km and more than 800 km,
respectively, assuming that short distances are always covered by direct flights while long distances often require two or more flights.
The CO2emission per flight kilometer is calculated according to
E = CEU
H L (2)
10
where C is the emission factor for CO2, 3.15 kg CO2/kg jet fuel; EU is the specific
en-ergy usage per available seat kilometer (ASK), taken to be 1.2 MJ/ASK and 2.0 MJ/ASK for flights of more than 1000 km and less than 1000 km, respectively (Babikian et al.,
2002). The higher fuel consumption for the shorter flights is due to the larger fraction of time spent taxiing at airports and in the fuel-intensive ascent phase; H is the lower
15
heating value of kerosine, 43.1 MJ/kg; L is the average passenger load factor, assumed to be 0.75 (Morrell,2007).
Combining equations 1 and 2, the CO2emissions of a trip can be calculated, which are then summed over all trips of a year. Overall, I estimate that annual CO2emissions
calculated with the above procedure are accurate to within about 30%. The largest
20
uncertainties are due to EU varying by about 20–30% between different aircraft types
and depending on flight length (Babikian et al.,2002), the empirical factor F2, and the
passenger load factor, which can be quite different for different airlines. Morrell(2007) give L values between 0.51 and 0.91 for different airlines (the higher values are for a charter company and are not representative for the business travel considered here).
25
The various parameters in equations 1 and 2 were chosen such that the CO2emission
estimates are thought to be conservative – thus, underestimation is more likely than overestimation.
ACPD
8, 7373–7389, 2008 Scientists’ CO2 emissions A. Stohl Title Page Abstract Introduction Conclusions References Tables Figures ◭ ◮ ◭ ◮ Back CloseFull Screen / Esc
Printer-friendly Version Interactive Discussion For every trip undertaken by a NILU employee, I have added 160 km of ground travel,
assuming that about 80 km are required for the return trip between employees’ homes and the airport (for instance, Gardermoen airport is about 50 km outside Oslo), 60 km are required for the return trip between the destination airport and the final destination (assuming this to be a typical distance of an airport from a city center), and 20 km are
5
covered at the destination site. These numbers are thought to be very conservative. I have assumed that 0.03 kg/km gasoline are consumed for ground transportation on average, again a conservative estimate given that taxis or private cars are often used. In total, ground transportation contributed less than 3% to total emissions, such that a more refined procedure was not deemed necessary.
10
CO2 emissions occur also during the stay in a hotel, for instance due to heating or hot water preparation. For Switzerland, the average CO2 emission per visitor night in
a hotel is estimated at 11 kg CO2(Schegg and Amstutz,2004). For New Zealand, the
corresponding estimate is 8 kg CO2 per visitor night (Becken and Patterson, 2006), whereas the German Environmental Protection Agency uses a value of 18 kg CO2
15
(Sch ¨achtele and Hertle,2007). Here, I use an average of these values, 12 kg CO2per
visitor night. A detailed analysis of the travel information for the year 2007 revealed that a NILU employee spent on average 3.4 nights away from home per trip. This number was also used for the other years to calculate the corresponding CO2 emission from
the number of trips undertaken.
20
3 Results
Table2summarizes the distances traveled and corresponding CO2emissions caused
by NILU’s staff. In total, NILU employees traveled between 2.2 and 3 million kilome-ters per year. This corresponds to 15 000–19 000 km per employee. Since most trips, especially the longer ones, were undertaken by scientists, it makes sense to count
25
the emissions per scientist and use this as the main yardstick for later comparisons. The average NILU scientist traveled 30 000–43 000 kilometers, roughly once around
ACPD
8, 7373–7389, 2008 Scientists’ CO2 emissions A. Stohl Title Page Abstract Introduction Conclusions References Tables Figures ◭ ◮ ◭ ◮ Back CloseFull Screen / Esc
Printer-friendly Version Interactive Discussion the Earth, every year. The resulting CO2emissions ranged from 269–368 t/year, which
corresponds to 1.8–2.3 t CO2 per employee or 3.7–5.2 t CO2per scientist. More than
97% of these emissions were caused by air transportation, less than 3% by ground transportation. Hotel usage (Table3) adds another 5% and, thus, is a relatively minor contributor to the CO2emissions.
5
The total travel-related CO2 emissions (i.e., sum of transportation emissions and
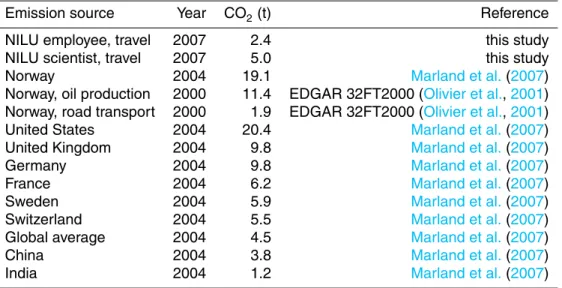
emissions from hotel usage) for 2005-2007 are listed in Table 4 and the per-capita emissions for the year 2007 are compared with total national per-capita emissions in various countries in Table5. The per-capita emissions (2.4 and 5.0 t CO2per employee
and per scientist, respectively) appear relatively small compared to the Norwegian
av-10
erage per-capita emission (19.1 t CO2). However, Norway’s per-capita CO2emissions are among the highest in the world, which is due mainly to oil production which ac-counts for almost 60% of the national emissions. Such a comparison is, thus, mislead-ing. NILU’s travel-related per-scientists emissions are much higher than the Norwegian emissions from road transport. NILU’s per-scientist emission are higher than the total
15
per-capita emissions in many Asian countries, including China, and they also exceed the global average per-capita CO2emissions. They are furthermore comparable to the total per-capita emissions in some highly industrialized nations, for instance in France, Sweden or Switzerland. Given that these emissions occur in just 24 days of the year (the average time a NILU scientist spent abroad), this result is quite remarkable.
20
In this study I have made emission estimates only for CO2 and more than 90% of
these emissions resulted from aircraft use. However, aircraft impact climate not only through their CO2emissions. They emit nitrogen oxides which produce ozone, a par-ticularly effective greenhouse gas at cruising altitudes (Fabian and K ¨archer, 1997). Aircraft also emit water vapor, which at these high altitudes also adds a small
posi-25
tive radiative forcing. Furthermore, aircraft produce contrails and possibly also lead to enhanced cirrus cloud cover, both causing a positive radiative forcing (Marquart et
al.,2003). The radiative forcing due to these effects is more uncertain than the radia-tive forcing from CO2 but in total may effectively more than double the CO2 radiative
ACPD
8, 7373–7389, 2008 Scientists’ CO2 emissions A. Stohl Title Page Abstract Introduction Conclusions References Tables Figures ◭ ◮ ◭ ◮ Back CloseFull Screen / Esc
Printer-friendly Version Interactive Discussion forcing (Penner et al., 1999). Consequently, the per-capita climate impact of NILU’s
business trips is relatively larger than the per-capita CO2 emissions alone would
sug-gest. In other words, if radiative forcing values instead of CO2emissions would have
been compared, the relative importance of NILU’s travel would increase.
An important question remaining from this study is how representative the travel
be-5
havior of NILU’s scientists is for the whole (atmospheric) science community. There are several factors which may produce larger travel activity of a NILU scientist compared to other scientists. Most importantly, Norway is on the northern end of Europe such that almost all trips by NILU scientists involve relatively long distances. Furthermore, a substantial fraction of NILU’s revenue comes from projects sponsored by the European
10
Union, the United Nations and other international sources. NILU also maintains small branch offices in various countries (e.g., United Arab Emirates, Poland) and operates monitoring stations both in the Arctic and in Antarctica which need to be visited regu-larly. Finally, NILU employees also travel occasionally between the Kjeller and Tromsø offices. However, there are also factors that discourage NILU scientists from traveling,
15
for instance the fact that few intercontinental flights are departing from Oslo, such that nearly always multiple flights are needed to reach a destination on another continents. This is even worse for scientists working in Tromsø who must travel to Oslo first, be-fore embarking on an international flight. The long duration of such trips is a strong incentive for reducing the number of trips.
20
A larger number of studies such as this one will be needed to fully evaluate the climate impact of scientists. Atmospheric researchers, most of whom are concerned about the climate impact of anthropogenic activities, may actually travel less than other scientists, making a more complete assessment all the more important. Still, it is clear from this study that travel-related CO2emissions by scientists are substantial and need
25
to be taken into account. Awaiting a more complete assessment and assuming in the meantime that the per-capita emissions of the NILU scientists are typical at least for researchers in Norway, the total CO2emissions caused by the travel of all Norwegian
ACPD
8, 7373–7389, 2008 Scientists’ CO2 emissions A. Stohl Title Page Abstract Introduction Conclusions References Tables Figures ◭ ◮ ◭ ◮ Back CloseFull Screen / Esc
Printer-friendly Version Interactive Discussion in research and development activities in Norway in the year 2005. As this number
includes part-time personnel, the number of person years spent in research and devel-opment, 30500, may be a more appropriate scaling factor. Assuming that Norwegian researchers emit 5 t CO2per person year on travel, the total number for Norway would
be 152.5 kt CO2, which is almost 0.2% of Norway’s CO2emissions.
5
4 Conclusions
In this paper, the CO2emissions of the employees working at an atmospheric research
institute (NILU) caused by all types of business travel (conference visits, workshops, field campaigns, instrument maintainance, etc.) were calculated for the years 2005-2007. More than 90% of the emissions were caused by air travel, 3% by ground travel
10
and about 5% by hotel usage. The travel-related annual emissions were between 1.9 and 2.4 t CO2 per employee or between 3.9 and 5.5 t CO2 per scientist. For
compari-son, the total annual per capita CO2emissions are 4.5 t worldwide, 1.2 t for India, 3.8 t
for China, 5.9 t for Sweden and 19.1 t for Norway. Norway’s per capita CO2 emissions are among the highest in the world, due to large emissions from the oil industry, and
15
are probably not suitable for comparison. However, compared to the total per capita emissions of other nations, NILU’s CO2emissions from business travel are quite high, given that the emissions occur during only 24 days of the year. On a per-scientist basis, they even exceed the global average per capita emission. Assuming that the per capita emissions derived in this study are typical at least for Norwegian researchers, travel by
20
the Norwegian research and development personnel would account for almost 0.2% of the national total CO2 emissions. The importance of the travel-related emissions
increases further when considering that most of these emissions are due to air travel, whose total radiative forcing effect (including high-altitude ozone formation, water va-por emissions and contrail formation) may be more than twice the radiative forcing due
25
to the CO2emissions alone.
ACPD
8, 7373–7389, 2008 Scientists’ CO2 emissions A. Stohl Title Page Abstract Introduction Conclusions References Tables Figures ◭ ◮ ◭ ◮ Back CloseFull Screen / Esc
Printer-friendly Version Interactive Discussion current travel behaviour. Also funding agencies should re-evaluate their funding
cri-teria. Currently, international collaboration is highly encouraged both by national as well as international funding bodies. Consequently, research proposals involving a lot of travel tend to be more successful than proposals with less travel, even though the scientific benefit from the enhanced travel may not always be clear. While continued
5
support for international collaboration is desirable, avoiding unnecessary travel should also be encouraged in order to reduce the climate impact of scientific research.
Acknowledgements. I appreciate the support of NILU’s directors, G. Jordfald and P. Berg and
the department director K. Tørseth, for this research, and for their approval to publish these data. I thank NILU’s administrative personnel, particularly E. Braathen, for their help in
compil-10
ing travel statistics.
References
Babikian, R., Luchachko, S. P., and Waitz, I. A.: The historical fuel efficiency characteristics of regional aircraft from technological, operational and cost perspectives, J. Air Transport Management, 8, 389–400, 2002. 7377
15
Becken, S. and Patterson, M.: Measuring National Carbon Dioxide Emissions from Tourism as a Key Step Towards Achieving Sustainable Tourism, J. Sustainable Tourism, 14, 323–338, doi:10.2167/jost547.0, 2006.7378
Fabian, P. and K ¨archer, B.: The impact of aviation upon the atmosphere, Phys. Chem. Earth, 22, 503–598, 1997.7379
20
IPCC (Intergovernmental Panel on Climate Change): Climate Change 2007: The Physical Science Basis. Contribution of Working Group I to the Fourth Assessment Report of the Intergovernmental Panel on Climate Change, edited by Solomon, S., Qin, D., Manning, M., Chen, Z., Marquis, M., Averyt, K. B., Tignor, M., and Miller H. L., ISBN 978 0521 88009-1, Cambridge University Press, Cambridge, United Kingdom and New York, NY, USA, pp 996,
25
2007. 7374,7375
Kim, B. Y., Fleming, G. G, Lee, J. J., Waitz, I. A., Clarke, J.-P., et al.: System for assessing Aviation’s Global Emissions (SAGE), Part 1: Model description and inventory results, Trans-portation Research D, 12, 325–346, 2007. 7375,7377
ACPD
8, 7373–7389, 2008 Scientists’ CO2 emissions A. Stohl Title Page Abstract Introduction Conclusions References Tables Figures ◭ ◮ ◭ ◮ Back CloseFull Screen / Esc
Printer-friendly Version Interactive Discussion Marland, G., Boden, T. A., and Andres, R. J.: Global, Regional, and National Fossil Fuel CO2
Emissions. In Trends: A Compendium of Data on Global Change. Carbon Dioxide Informa-tion Analysis Center, Oak Ridge NaInforma-tional Laboratory, U.S. Department of Energy, Oak Ridge, Tenn., U.S.A., 2007.7388
Marquart, S., Ponater, M., Mager, F., and Sausen, R.: Future development of contrail cover,
5
optical depth, and radiative forcing: Impacts of increasing air traffic and climate change, J. Climate, 16, 2890–2904, 2003. 7379
Morrell, P.: An evaluation of possible EU air transport emissions trading scheme allocation methods, Energy Policy, 35, 5562–5570, 2007. 7377
Olivier, J. G. J. and Berdowski, J. J. M.: Global emissions sources and sinks, In: Berdowski,
10
J., Guicherit, R. and Heij, B. J. (eds.) “The Climate System”, pp. 33–78. A. A. Balkema Publishers/Swets & Zeitlinger Publishers, Lisse, The Netherlands. ISBN 90 5809 255 0. 7375,7388
Penner, J. E., Lister, D. H., Griggs D. J., Dokken, D. J., and McFarland, M. (eds.): Aviation and the Global Atmosphere, Cambridge University Press, UK., pp 373, 1999.7375,7380
15
RCN (The Research Council of Norway): Report on Science & Technology Indicators for Nor-way 2007, ISBN 978-82-12-02506-6, The Research Council of NorNor-way, pp 80, 2008. 7380 Sch ¨achtele, K., and Hertle, H.: Die CO2 Bilanz des B ¨urgers – Recherche f ¨ur ein
internet-basiertes Tool zur Erstellung pers ¨onlicher CO2Bilanzen, Endbericht im Auftrag des Umwelt-bundesamtes, F ¨orderkennzeichen 206 42 110, available fromhttp://www.umweltdaten.de/
20
publikationen/fpdf-l/3327.pdf, Institut f ¨ur Energie- und Umweltforschung Heidelberg GmbH, Heidelberg, 2007. 7378
Schegg, R. and Amstutz, M.: Energiekennzahlen f ¨ur die Schweizer Hotellerie - ein Forschungsprojekt des Bundesamtes f ¨ur Energie, available from www.hotelpower.ch/ver francaise/pdf/hotelpower energiekennzahlen.pdf, 2004.7378
ACPD
8, 7373–7389, 2008 Scientists’ CO2 emissions A. Stohl Title Page Abstract Introduction Conclusions References Tables Figures ◭ ◮ ◭ ◮ Back CloseFull Screen / Esc
Printer-friendly Version Interactive Discussion
Table 1. Number of persons employed at NILU in total and for scientists only in the years 2005,
2006 and 2007. For 2005, employees working in the Tromsø office are not counted because of incomplete travel information.
Year Personnel Scientists
2005 134 60
2006 152 73
ACPD
8, 7373–7389, 2008 Scientists’ CO2 emissions A. Stohl Title Page Abstract Introduction Conclusions References Tables Figures ◭ ◮ ◭ ◮ Back CloseFull Screen / Esc
Printer-friendly Version Interactive Discussion
Table 2. Number of business trips undertaken by NILU personnel, total distance traveled (million km), and distance traveled per employee (1000 km) and per scientist (1000 km), as well as related CO2emissions from transportation by NILU personnel in total (t CO2), per employee (t CO2) and per scientist (t CO2) for the years 2005, 2006 and 2007. Trips from Tromsø were accounted for only in 2006 and 2007.
Year Trips Travel distance Distance per employee Distance per scientist CO2 CO2per employee CO2per scientist
[million km] [1000 km] [1000 km] [t CO2] [t CO2] [t CO2]
2005 403 2.6 19.4 43.2 311 2.3 5.2
2006 381 2.2 14.6 30.5 269 1.8 3.7
ACPD
8, 7373–7389, 2008 Scientists’ CO2 emissions A. Stohl Title Page Abstract Introduction Conclusions References Tables Figures ◭ ◮ ◭ ◮ Back CloseFull Screen / Esc
Printer-friendly Version Interactive Discussion
Table 3. Annual CO2emissions from hotel usage by NILU personnel in 2005, 2006 and 2007, expressed as annual totals (t CO2) as well as annual totals per employee (t CO2) and per employed scientist (t CO2).
Year CO2 CO2/employee CO2/scientist
2005 16 0.12 0.27
2006 16 0.10 0.21
ACPD
8, 7373–7389, 2008 Scientists’ CO2 emissions A. Stohl Title Page Abstract Introduction Conclusions References Tables Figures ◭ ◮ ◭ ◮ Back CloseFull Screen / Esc
Printer-friendly Version Interactive Discussion
Table 4. Total annual travel-related CO2 emissions by NILU personnel in 2005, 2006 and 2007, expressed as annual totals (t CO2) as well as annual totals per employee (t CO2) and per employed scientist (t CO2).
Year CO2 CO2/employee CO2/scientist
2005 327 2.4 5.5
2006 285 1.9 3.9
ACPD
8, 7373–7389, 2008 Scientists’ CO2 emissions A. Stohl Title Page Abstract Introduction Conclusions References Tables Figures ◭ ◮ ◭ ◮ Back CloseFull Screen / Esc
Printer-friendly Version Interactive Discussion
Table 5. Comparison of the NILU travel-related CO2emissions for 2007 with annual per-capita total CO2emissions for various countries.
Emission source Year CO2(t) Reference
NILU employee, travel 2007 2.4 this study
NILU scientist, travel 2007 5.0 this study
Norway 2004 19.1 Marland et al.(2007)
Norway, oil production 2000 11.4 EDGAR 32FT2000 (Olivier et al.,2001) Norway, road transport 2000 1.9 EDGAR 32FT2000 (Olivier et al.,2001)
United States 2004 20.4 Marland et al.(2007)
United Kingdom 2004 9.8 Marland et al.(2007)
Germany 2004 9.8 Marland et al.(2007)
France 2004 6.2 Marland et al.(2007)
Sweden 2004 5.9 Marland et al.(2007)
Switzerland 2004 5.5 Marland et al.(2007)
Global average 2004 4.5 Marland et al.(2007)
China 2004 3.8 Marland et al.(2007)
ACPD
8, 7373–7389, 2008 Scientists’ CO2 emissions A. Stohl Title Page Abstract Introduction Conclusions References Tables Figures ◭ ◮ ◭ ◮ Back CloseFull Screen / Esc
Printer-friendly Version Interactive Discussion
Fig. 1. Summary of all trips undertaken by NILU staff during 2005–2007. The blue lines are
great circle routes from the home airport to the destination; the red circles mark the destination locations, with the circles’ area being proportional to the number of trips undertaken.