HAL Id: hal-00302994
https://hal.archives-ouvertes.fr/hal-00302994
Submitted on 6 May 2008
HAL is a multi-disciplinary open access
archive for the deposit and dissemination of
sci-entific research documents, whether they are
pub-lished or not. The documents may come from
teaching and research institutions in France or
abroad, or from public or private research centers.
L’archive ouverte pluridisciplinaire HAL, est
destinée au dépôt et à la diffusion de documents
scientifiques de niveau recherche, publiés ou non,
émanant des établissements d’enseignement et de
recherche français ou étrangers, des laboratoires
publics ou privés.
Tsallis and Levy statistics in the preparation of an
earthquake
Y. F. Contoyiannis, K. Eftaxias
To cite this version:
Y. F. Contoyiannis, K. Eftaxias. Tsallis and Levy statistics in the preparation of an earthquake.
Nonlinear Processes in Geophysics, European Geosciences Union (EGU), 2008, 15 (3), pp.379-388.
�hal-00302994�
Nonlin. Processes Geophys., 15, 379–388, 2008 www.nonlin-processes-geophys.net/15/379/2008/ © Author(s) 2008. This work is distributed under the Creative Commons Attribution 3.0 License.
Nonlinear Processes
in Geophysics
Tsallis and Levy statistics in the preparation of an earthquake
Y. F. Contoyiannis1and K. Eftaxias2
1Department of Physics and Chemistry, Techological Education Institute (TEI) of Chalkis, Greece 2Department of Physics, University of Athens, 15771 Athens, Greece
Received: 21 December 2007 – Revised: 19 March 2008 – Accepted: 3 April 2008 – Published: 6 May 2008
Abstract. Precursory fracture induced electromagnetic (EM)
emissions, rooted in opening cracks and ranging from MHz to kHz, with the MHz appearing earlier, are produced and de-tected both at laboratory and geophysical scale. Recently, we have proposed the following two epochs/stages model of EQ generation: (i) The final kHz part is triggered by the fracture of high strength and large asperities that are distributed along the activated fault and sustain the system. (ii) The initial MHz part is thought to be due to the fracture of highly hetero-geneous system that surrounds the family of asperities. Inter-estingly, the MHz EM time-series can be described in anal-ogy with a thermal second order phase transition. Herein we focus on the MHz pre-seismic activity, and especially on the naturally arising question: what is the physical mechanism that organizes the heterogeneous system in its critical state? Combining ideas of Levy and Tsallis statistics and critical-ity with features hidden in the precursory MHz time-series we argue that a Levy walk type mechanism can organize the heterogeneous system to criticality. Based on a numerically produced truncated Levy walk, we propose a way to estimate in the stage of critical fluctuations: (i) the associated Levy index-a, which describes quantitatively the underlying Levy dynamics, and (ii) the range of values where the nonexte-sitive Tsallis index q is restricted. We also show that the kHz EM activity could not be described by a truncated Levy mechanism. This result further indicates an abrupt sweep of the population of asperities that sustain the system.
1 Introduction
Earthquakes (EQs) are large-scale fracture phenomena in the Earth’s heterogeneous crust. Despite the large amount of experimental data and the considerable effort that has been undertaken by the material scientists, many questions about
Correspondence to: K. Eftaxias
fracture processes remain standing. Especially, many aspects of EQ generation still escape our full understudying.
Fracture induced physical fields allow a real-time monitor-ing of damage evolution in materials durmonitor-ing mechanical load-ing. Electromagnetic (EM) emissions in a wide frequency spectrum ranging from kHz to MHz are produced by opening cracks, which can be considered as the so-called precursors of general fracture. These precursors are detectable both at a laboratory and a geophysical scale. It is by now recognized that the pre-fracture kHz-MHz EM time series contain valu-able information about the fracture EQ preparation process (Kapiris et al., 2004; Karamanos et al., 2005, 2006). Be-ing non-destructive, monitorBe-ing techniques based on these fracture-induced fields are a basis for a fundamental under-standing of fracture mechanism and for development consec-utive models of rock/focal area behavior.
Our main observational tool is the monitoring of the frac-ture which occurs in the focal area before the final break-up by recording their kHz-MHz EM emissions. Clear kHz-to-MHz EM anomalies have been detected over periods rang-ing from a few days to a few hours prior to recent destructive EQs in Greece. We emphasize that the MHz radiation ap-pears earlier than the kHz (Contoyiannis et al., 2005). This situation is in harmony with laboratory results.
An important challenge in this field of research is to dis-tinguish characteristic epochs in the evolution of precursory EM activity and identify them with the equivalent last stages in the EQ preparation process. In a recent work (Contoyian-nis et al., 2005), we approach the preparation of EQs in terms of critical phase transitions. Based on this analysis we have proposed the following two epochs/stages model of EQ gen-eration (i) The final kHz part is triggered by the fracture of high strength, large, and rather homogeneous asperities that are distributed along the activated fault sustaining the system. (ii) The initial MHz part is thought to be due to the fracture of highly heterogeneous system that surrounds the family of as-perities. Importantly, the MHz epoch is described in analogy with a thermal continuous phase transition. A fractal spectral analysis by means of Hurst exponent shows that this activity
has anti-persistent properties, i.e., if the EM fluctuations in-crease in a period, they are likely to continue decreasing in the interval immediately following and vice versa. An an-tipersistent behavior (Contoyiannis et al., 2005; Karamanos et al., 2006) implies a set of fluctuations tending to induce a stability within the system, i.e., a nonlinear negative feed-back in the underlying fracto-EM mechanism, which “kicks” the opening cracks away from extremes. The observed an-tipersistency, which is rooted in the heterogeneity of the sys-tem, enables the fracture in highly heterogeneous systems to be described via an analogy with thermal continuous phase transitions. On the contrary, the abrupt emergence of strong impulsive kHz EM emission indicates a nonequilibrium pro-cess without any footprint of an equilibrium second order phase transition. Moreover, this time series shows persistent behavior, i.e., if the amplitude of EM fluctuations increases in a time interval, it is likely to continue increasing in the interval immediately following. The persistency, which may reflect the narrow distribution of strength in the backbone of asperities, implies a nonlinear positive feedback in the un-derlying fracto-EM mechanism. The existence of a positive feedback justifies the absent any signature of a second order transition. In fracture mechanics, the democratic fiber bundle model (DFBM) exhibits an interesting transition as a func-tion of the amplitude of the disorder. There exists a tricriti-cal transition from a Griffith-type abrupt rupture, i.e., “first-order” regime, where rupture occurs without significant pre-cursors, to a progressive damage, i.e., “second-order” regime as the disorder increases. We argue that the observed features in the precursory EM emissions are in agreement with this scheme.
The above mentioned proposal, due to its crucial char-acter, needs further justification. Recently, based on “scale invariance” and “universality” concepts we have supported the hypothesis that the kHz EM activity is originated during the fracture of asperities (Contoyiannis et al., 2005). In this work, we focus on the first epoch/stage of the EQ nucleation process, namely, on the fracture of the heterogeneous com-ponent of the focal area. A question naturally arises refers to the physical mechanism that organizes a heterogeneous system in its critical state. We attempt to established the hy-pothesis that a Levy walk type fracture mechanism could be a candidate relevant critical mechanism. Physicists working in statistical physics started to suggest in the mid-eighties that rupture of sufficiently heterogeneous media would ex-hibits universal properties, in a way maybe similar to critical transitions (Sornette et al., 2004). However, the fracture pro-cess, especially when energies are high enough, leads to the emergence of long-range correlations between all parts of the area being fractured. This situation violates the Boltzmann-Gibbs statistics, the bridge to the equilibrium thermodynam-ics. Then, the use of a nonadditive statistics, such as the Tsallis statistics, seems to be adequate. Importantly, the Levy statistics has been quantitatively connected with the nonad-ditive Tsallis statistics. Herein, based on this connection, we
try to extract more information possibly hidden in the MHz EM time series about the mechanism that organizes the crit-ical stage of fracture.
This paper is organized as following: In Sect. 2 we briefly present the foundations of the recently introduced method of critical fluctuations (MCF). Based on this method, we inves-tigate the preseismic EM time series in terms of criticality. In Sect. 3 we refer to a connection between the Levy statis-tics and Tsallis statisstatis-tics, as it has been presented in litera-ture. In Sect. 4 a relation between characteristic indexes of the MCF and the Levy statistics is deduced. In Sect. 5, based on a Monte-Carlo algorithm, we produce a two-dimensional Levy walk portrait. We investigate whether for an appro-priate set of the associated parameters the Levy walk would exhibit critical signatures in the associated time series. In Sect. 6 we present the application of the MCF on the pre-seismic MHz EM time series associated with the Athens EQ. In Sect. 7, a proposed scenario seems to justify that a Levy walk type fracture mechanism can organize the criticality in the heterogeneous environment. In Sect. 8, an estimation of Tsallis q-index associated with the fracture in heterogeneous environment is accomplished. Finally, in Sect. 9, we present the conclusions of this work.
2 The method of critical fluctuations
In Contoyiannis and Diakonos (2000) we investigated how a thermal system at its critical point can be described in terms of dynamical systems. We found that the critical fluctuations of the order parameter φ obey to a dynamical law which is described by the following intermittent map
φn+1=φn+uφzn+ǫn (1) where ǫnis a shift parameter.
All the parameters of this map have a clear physical con-tent. So, the exponent z is connected with the isothermal critical exponent δ as z=δ+1. Each physical system has its characteristic “noise”, which is expressed through the shift parameter ǫn. The critical state is characterized by the unsta-ble fixed point. For example, for a magnetic phase transition the unstable fixed point has the value zero (mean magnetiza-tion). Importantly, the statistical properties of distribution of laminar lengths, namely the distribution of stay times, in the neighbourhood of the unstable fixed point associated with the critical state, are similar for various systems. This evidence leads to the same exponent z, because the intermittent dy-namics is controlled by the nonlinear term of Eq. (1).
In Contoyiannis et al. (2002, 2004, 2005) we have de-veloped the Method of Critical Fluctuations (MCF), which can reveal crucial information about the critical state. The MCF is described through the statistical distribution of lami-nar lengths l for the map (1) (Schuster, 1989):
Y. F. Contoyiannis and K. Eftaxias: Tsallis and Levy statistics 381
where the exponent pl is connected with the exponent z as
pl=z−1z . Therefore the exponent pl is connected with the isothermal exponent as:
pl =1 + 1
δ (3)
Due to the universal character of critical phenomena the exponent pl can refer to systems beyond the thermal ones which appear similar dynamical fluctuations (Contoyiannis et al., 2002). The appearance of such fluctuations could be a signal of an underlying critical state. The MCF is directly applied to time-series or to segments of time series which appear a cumulative type stationary behaviour.
The main aim of MCF is to estimate the exponent pl. The distribution of the laminar lengths, is fitted in the frame of the MCF by the function:
R(s) ∼ s−p2e−p3s (4)
We focus on the exponents p2and p3. If the exponent p3is
zero, then, the exponent p2is equal to the exponent pl. Prac-tically, as the exponent p3approaches to zero, then, the
ex-ponent p2approaches to pl, while, the laminar lengths tend to follow a power-law type distribution. We note that Eq. (3) suggests that the exponent pl (or p2) should be greater than
1.
In summary, the condition of criticality has been found as
p2>1 and p3≈0 (Contoyiannis et al., 2002, 2004, 2005). We
stress that when the exponent p2is smaller than one, then,
independently of the p3-value, the system is not at a
criti-cal state. Generally, the exponents p2, p3have a competitive
character, namely, when the exponent p2 decreases the
as-sociated exponent p3increase. In this way, we can identify
the deviation from the critical state. To be more concrete, as the exponent p2(p2<1) is close to 1 and simultaneously
the exponent p3is close to zero, then, the system is at a
sub-critical state. As the system removes from the sub-critical state, then, the exponent p2decreases while simultaneously the
ex-ponent p3increases reinforcing, in this way, the exponential
character of the laminar lengths distribution. A situation like this indicates that the dynamics of the system becomes rather chaotic than deterministic (Pingel and al., 1999; Diakonos and al., 1999). From all the above mentioned findings we conclude that the research of criticality in natural systems could be quantitatively accomplished by estimating the val-ues of only two parameters, namely the exponents p2and p3.
Up to now, we have applied the MCF on numerical experi-ments of thermal systems (Ising models) (Contoyiannis et al., 2002), on electromagnetic pre-seismic signals (Contoyiannis et al., 2005), and on electrocardiac signals from biological tissues (Contoyiannis et al., 2004).
3 Levy and Tsallis statistics
The Levy Statistics is applied to physical systems which de-velop stable processes with main characteristic the infinite
variance. The characteristic function of this statistics has the form (Alemany and Zanette, 1994):
G(k) = exp(−c|k|a)
where 0<a<2. This characteristic function is the Fourier transform of the jump probability p(x). The previous func-tion behaves for large |x| as (Alemany and Zanette, 1994):
p(x) ∼ |x|−(1+a) (5)
The random walk process, which has the above jump prob-ability, is known as “Levy flights”.
A jump needs a time interval of duration τ , which is proportional to its length |x|. Such as time intervals have the character of “waiting time” between successive flights. Therefore, the corresponding probability density for these time intervals is written as:
9(τ ) ∼ τ−(1+a) (6)
The Levy statistics has been successfully used in various dynamical systems that involve long-range spatio-temporal correlations, like anomalous diffusion phenomena, fluid tur-bulence, financial markets and many others.
Now, we briefly refer to the foundations of Tsallis en-tropy. In nature, long-range spatial interactions or long-range memory effects may give rise to very interesting behaviors. Among them, one of the most intriguing arises in systems that are nonextensive (nonadditive). These systems share a very subtle property: they violate the Boltzmann-Gibbs (B-G) statistics, the bridge to the equilibrium thermodynamics. Inspired by multifractals concepts, Tsallis (1988) has pro-posed a generalization of the BG statistical mechanics. He introduced an entropic expression characterized by an index
q which lead to a nonextensive statistics,
Sq=k 1 q − 1 1 − W X i=1 pqi ! , (7)
where pi are the probabilities associated with the micro-scopic configurations, W is their total number, q is a real number, and k is Boltzmann’s constant. The value of q is a measure of the nonextensivity of the system: q=1 corre-sponds to the standard, extensive, B-G statistics. Indeed, us-ing pi(q−1)=e(q−1) ln(pi)∼1+(q −1) ln(p
i) in the limit q→1, we recover the usual B-G entropy
S1= −k
W
X
i=1
piln(pi). (8)
More precisely, the entropic index q characterizes the de-gree of nonextensivity reflected in the following pseudo-additivity rule:
Sq(A + B) = Sq(A) + Sq(B) + (1 − q)Sq(A)Sq(B) (9) where A and B are two independent systems in the sense that the probabilities of A+B factorize into those of A and
B. The values q>1, q=1, or q<1, correspond to sub-extensivity, extensivity or super-sub-extensivity, respectively.
Tsallis notes that there are at least 20 entropy functions in the literature, and he compares several in detail. Importantly, the Tsallis entropy is extensive, stable, and concave.
Recently, interesting questions and investigations aim-ing to the quantitative description of critical phenomena through such a nonextensive statistics have been accom-plished (Baldovin and Robledo., 2002; Robledo, 2004). On the other hand, a connection between Tsallis statistics and Levy statistics has been introduced (Alemany and Zanette, 1994). Therefore, it is reasonable to attempt a connection between the criticality and the Levy statistics through the Tsallis statistics. A basic scope of this work is to try such a connection.
In Alemany and Zanette (1994), the authors, based on a proper use of Tsallis entropy
Sq[p(x)] = − 1 −R∞
∞ p(x) qdx
(1 − q) (10)
have connected the entropic nonextensive index q with the Levy index a through the relation q=3+a1+a. On the other hand, the authors in Buiatti et al. (1999) suggest that for a dynam-ical system, which is described through an intermittent map of the form:
yn+1=yn+wynm ; w > 0, m > 1 (11) the associated entropic index q and the Levy index a are con-nected with the relation
q = 2 + a
1 + a (12)
Notice, in Buiatti et al. (1999) the authors distinguish be-tween: (i) a probabilistic character of Levy processes, which leads to the results presented in Alemany and Zanette (1994) and (ii) a dynamical character of Levy processes described by the map (11), which leads to the relation (12).
The stay times in the laminar region of map (11) are the waiting times between successive exits from the laminar re-gion. The term “waiting time” has been used with a more general character, for example, as the time intervals between earthquakes (Scafetta and West, 2005).
4 Relation between critical fluctuations exponent p2
and Levy index a
As it is mentioned, in a recent work (Robledo, 2004) the au-thor has proposed a connection between the Tsallis statistics and critical phenomena. They concluded that the Tsallis in-dex q and the isothermal critical exponent δ are connected via the relation:
q = (2δ + 1)
(δ + 1) (13)
We recall that the dynamics of critical fluctuations is de-scribed by the map (1), which has the same form as the map (11) (except the shift parameter). Thus, we can use the re-lation (12) between q and a. So, a rere-lationship between the critical exponent pl (or p2) and Levy index a is possible.
Indeed, from Eqs. (12), (13) and (3) we take that:
p2=1 + a (14)
In the case of the exact Levy Statistics and for systems in their thermodynamical limit the statistical second moment diverges. But the real systems have finite sizes. So, the de-scription is given through the “truncated Levy walk” which has been introduced by Stanley and Mantega (Mantegna and Stanley, 1994) as a crossover between Levy and Gaussian statistics. Koponen (1995), taking account the cut-off in great scales, introduced an exponential decay in distribution of ex-act Levy walk. In this approach, the distribution (6) is written as:
9(τ ) ∼ τ−µe−λτ (15)
The cut-off parameter is denoted by the parameter λ>0. In Eq. (15) the exponent µ=1+a has been introduced. From the restriction 0<a<2 one takes the limits of exponent µ:
1 < µ < 3 (16)
The condition (16) is in agreement with that of criticality
p2>1.
The mechanism of Levy walk appears in many processes in nature. However, they do not assume the existence of an underlying critical state. A question naturally arises is, un-der what conditions a Levy walk can describe a critical state. First, we will investigate this question through a numerical experiment.
5 Levy walk and criticality in terms of a numerical ex-periment
Spatial patterns of truncated Levy random walks can be pro-duced by numerical simulations. We apply such an algorithm (Antoniou et al., 2001) which produces a random Levy walk in a two dimensions space with a controlled truncation. This algorithm provides that the components x of the walk is given by: x=b(1−gχ )−1/µ. Similar relation can been written for
the y-components. In this Monte-Carlo formula, b is a co-efficient, χ is a random number in the interval (0, 1), µ is the corresponding Levy exponent and g is a parameter which determines how much truncated is the Levy walk. For g→1 the walk is possible to approach the ideal Levy walk. An interesting question is whether the Levy dynamics rooted in this algorithm could be in harmony with a critical state.
Using various g-values, keeping the other parameters b, µ constant, i.e., b=0.1 and µ=1.3, we found that for the value
Y. F. Contoyiannis and K. Eftaxias: Tsallis and Levy statistics 383
Fig. 1. A x-time-series produced by a numerical simulation
asso-ciated with a truncated Levy flight random walk including 100 000 steps. The time refers to the algorithmic time (1 step/1 unit). The stationary segment, where the analysis of criticality is accom-plished, is restricted between the two vertical lines ranging from 36 500 point up to 52 000 point.
which has the following properties: (i) An excellent qual-ity of cumulative stationarqual-ity, which is a necessary condition for the application of the MCF (Contoyiannis et al., 2005). In Fig. 2 this stationarity in terms of the mean values and standard deviations is presented. (ii) In Fig. 3 the distribu-tion of laminar lengths is shown. The corresponding analy-sis by means of the MCF (details of this method see later) reveals that the fitting by the function (4) has the best qual-ity (r2=0.988), and simultaneously, the p3-exponent has the
more close to zero value. To be more concrete, the associated exponents are p2=1.4, p3=0.003. This pair of values
im-plies an underlying critical state. We note that the p2-value
is close enough to the corresponding Levy exponent µ=1.30, as it was expected by Eq. (14). Finally, Fig. 4 demonstrates a two-dimensional portrait including a few steps.
Importantly, if we move from the above mentioned char-acteristic g-value, g=0.885, keeping the other parameters constant, we find that there is not any segment in x-time-series satisfying the above mentioned properties. As an ex-ample, Fig. 5 shows the distribution of the laminar lengths for g=0.7. It is clear that the data can not be fitted by a power-law, and thus, any estimation of p2, p3is impossible.
We emphasize one more that the reported agreement be-tween criticality and Levy statistics is observed in time win-dows having cumulative stationary behavior. Inversely now, this agreement permits us to accomplish a quantitative esti-mation of the Levy index µ (or a) when the corresponding exponent of criticality p2has been estimated.
Fig. 2. The temporal evolution of cumulative mean value, as well
as, that of the standard deviation, for increasing number of points, starting from an initial set of 6000 points. The plots refer to x-time-series from a two dimensional Levy walk produced by a numerical simulation.
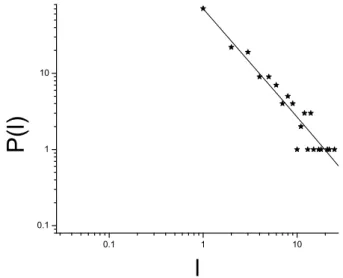
Fig. 3. The distribution of the laminar lengths from analysis in
terms of criticality for the stationary segment of time series shown in Fig. 2. The solid line represents the fit of data by the fitting func-tion (Eq. 4).
6 Criticality in MHZ EM pre-seismic emission
We have paid attention to the fact that such stationary win-dows, which also demonstrate critical fluctuations, have been found in the pre-seismic MHz EM emission associated with the Athens EQ (see Fig. 6, Contoyiannis et al., 2005). We recall, ample experimental evidence bridges this EM signal with the fracture of the strongly heterogeneous medium that surrounds the family of strong and large asperities in the fo-cal area, as well as that this EM activity can be described in
-20 -10 0 10 20 30 40 50 60 70 -30 -20 -10 0 10 20 30 Y X 0.1 1 10 1 10 100 P ( l ) l 0 50000 100000 150000 200000 250000 300000 900 1000 1100 1200 1300 1400 1500 II I ( m V ) time(sec)
Fig. 4. A two-dimensions portrait including 30 000 steps, produced
from a numerical simulated two components truncated Levy flight random walk with quite small cut-off (almost 6 in arbitary units).
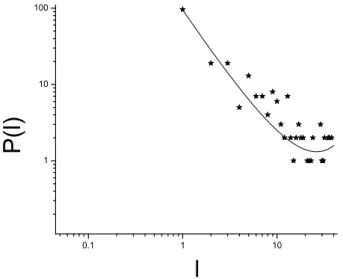
Fig. 5. The distribution of the laminar lengths, for the segment
between 36 500 point and 52 000 points, from analysis in terms of criticality for g=0.7, b=0.1, µ=1.3. It is obvious the destruction of criticality as we are removing from g=0.885, keeping b and µ constants.
analogy with a thermal second order phase transition (Con-toyiannis et al., 2005). Herein, we attempt to establish the hypothesis that the critical stage of fracture process in het-erogeneous media can follow a Levy mechanism, and thus, a quantitative description of this dynamics, through the esti-mation of the Levy index-a, it is possible.
We focus on the two candidate precursory EM bursts of long duration I, II included in the pre-seismic EM MHz time series (see Fig. 6). Their long duration permits a valuable statistical analysis. First, we present the application of the MCF in the burst II including 65 000 points. We search in this
-20 -10 0 10 20 30 40 50 60 70 -30 -20 -10 0 10 20 30 Y X 0.1 1 10 1 10 100 P ( l ) l 0 50000 100000 150000 200000 250000 300000 900 1000 1100 1200 1300 1400 1500 II I ψ ( m V ) time(sec)
Fig. 6. The MHz EM time series recorded prior to the Athens EQ.
The burst I has 52 000 points and the burst II has 65 000 points. The data have been recorded with sampling rate of one sample/s.
burst for a segment which shows an excellent cumulative sta-tionary, as that observed in the case of the above mentioned numerical experiment. Indeed, we found such a stationary window with a length of 15 000 s (see Fig. 7). The distribu-tion S(ψ ) of the associated EM fluctuadistribu-tions ψ is shown in Fig. 8. Now, we investigate the possible existence of critical fluctuations that obey the MCF.
The laminar lengths are described by the lengths of the sub-sequences in the EM time series that are resulted from successive ψ-values obeying the condition ψo≤ψ ≤ψl, where ψo, ψl are the beginning and the end of the lami-nar region, correspondingly. The beginning of the plateau (ψo≈955) is the beginning of the laminar region (see Fig. 8). The end of the laminar region corresponds to the ψ-value which leads to the best approach of exponent p3 to zero
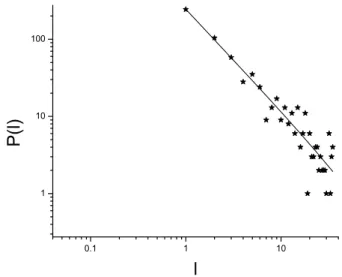
(Contoyiannis et al., 2002). In this way, using various ex-its, we find ψl=965. In Fig. 9 the distribution of the laminar lengths, as well as, the fitting of the data by function (4) are shown. We found that p2=1.30 and p3=0.0077.
Conse-quently, the conditions that imply the existence of an under-lying criticality are satisfied. For completeness, we briefly present relevant results from the EM burst I, as these have been reported in Contoyiannis et al. (2005). The window of critical fluctuations has length 20 000 s (Fig. 8 in Contoyian-nis et al., 2005) and the stationary condition is satisfied very well (Fig. 7 in Contoyiannis et al., 2005). The laminar distri-bution is shown in Fig. 9 (in Contoyiannis et al., 2005), while the exponents have the values p2=1.31 and p3=0.0054. It
is very important to observe the similarity in the value of the critical exponent p2, namely, p2≈1.3 for the two cases
studied. We recall that in terms of Levy statistics the distri-bution of laminar lengths is read as the distridistri-bution of wait-ing times which is characterized by the exponent a=p2−1
Y. F. Contoyiannis and K. Eftaxias: Tsallis and Levy statistics 385
Fig. 7. The plots refer to a stationary window (15 000 points)
in-cluding in the EM Burst II (see Fig. 6). The figure shows temporal evolution of cumulative mean value, as well as, that of the standard deviation, for increasing number of points, starting from an initial set of 6000 points.
the second EM burst correspondingly “reflect” a Levy type walk organization of cracking network with the same expo-nent µ=1+a≈1.30.
7 A possible scenario: the organization of critical state in pre-fracture process through a Levy walk mecha-nism
In analogy to the previously presented numerical experiment we propose a possible scenario that justifies the appearance of a Levy type mechanism in the fracture of a heterogeneous system. We consider that an “fracto-EM event” is emerged when the ψ-values exceed the laminar region. The time in-terval, during which the ψ-values are continually outside of the laminar region, denotes the duration (life-time) of the as-sociated EM pulse event. Responsible for this EM emission is the cracking in a local section of the heterogeneous focal area. Failure nucleation begins to occur at a region where the resistance to rupture growth has the minimum value. The fracture continuous in the same weak region until a much stronger region is encountered in its neighbourhood. When this happens, crack growth stops. Then, in the level of EM emission, the ψ-values come back in the laminar region. The stresses are redistributed while the applied stress in the focal area increases, thus a new population of cracks nucleates in the weaker of the unbroken regions. The required time for the initiation of the new fracture is the waiting time. The growth of new population of cracks also stops when it encounters another stronger region, and so on. We stress that the an-tipersistent behavior of the EM time-series (Contoyiannis et al., 2005), supports such a scenario. In Fig. 10, the associ-ated walk in focal area, according to the above mentioned
ψ
ψ
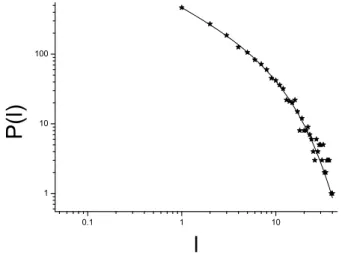
Fig. 8. The distribution S(ψ ) of ψ -values for the stationary
win-dow including in the burst II. We observe the existence of a plateau which is restricted from ψ ≈955 up to ψ ≈962.
Fig. 9. The distribution of the laminar lengths, as it is produced by
the analysis in terms of criticality for the stationary window includ-ing in the burst II. The fittinclud-ing function (Eq. 4) is plotted with the solid line.
scenario is presented. In this figure the broken regions, as well as, the arrows representing the successive steps of the fracture in the heterogeneous environment are shown.
8 An estimation of Tsallis index q for the case of frac-ture process in heterogeneous environment
Now we focus on the description in terms of Tsallis Statistics. From Eqs. (12) and (14) we take that:
q = 1 + 1 p2
(17)
Fig. 10. A two dimensional Levy type walk according to the
sce-nario for the fracture in a heterogenous environment (see text). The inset figure shows the EM emission which is emerged during the cracking of a local section.
As it is said, the existence of an underlying criticality im-poses that p2>1. Thus, as it results from Eq. (17), the upper
limit from the q-index is q<2. Now, we refer to the lower limit of q-parameter that is rooted in a critical state. The fracture of a heterogeneous material is characterized by anti-persistency. As it is mentioned, this implies a set of fluc-tuations tending to induce a stability to the system, namely, a negative non-linear feedback mechanism that “kicks” the cracking rate away from extremes. This physical picture jus-tifies the description of fracture in heterogeneous systems in terms of a second order phase transition in equilibrium. Quantitatively, the range 0<H <0.5, where H is the Hurst exponent, describes the anti-persistency.
In Contoyiannis et al. (2005) we have introduced a rela-tion between Hurst exponent and p2-exponent, which
pre-dicts that the upper limit, 0.5, of the first exponent leads to the upper limit 1.5 for the second one, and thus to the lower limit 1.66 for the q-parameter as it results from Eq. (17). Therefore, we suggest that the q-index rooted in a station-ary time window included critical fluctuations is restricted in the region 1.66<q<2. In the concrete MHz EM time series associated with the Athens EQ we have found that the critical exponent is p2=1.30. Therefore, as it results from Eq. (17)
q=1.77. We see that the estimated q-value obeys the
previ-ous q restriction.
As it is expected, the estimated values q>1 represent a subextensive system: the interactions and information tran-sition across the activated region of the crust have been veri-fied. Notice, the estimation for the nonextensive parameters is in full agreement with the upper limit q<2 obtained from several independent studies involving the Tsallis nonexten-sive framework (Vilar et al., 2007).
As it was mentioned, the strong impulsive kHz EM fluctu-ations emerged at the tail of the precursory EM activity have been correlated with the fracture of strong and large asperi-ties distributed along the activated fault sustaining the system (Contoyiannis et al., 2005). The analysis reveals that there is
Fig. 11. A typical example of the distribution of the laminar lengths
according to the analysis in terms of criticality in the a segment of kHz EM times series recording prior the Athens EQ. The fitting function (Eq. 4) is plotted by the solid line. The associated
ex-ponents p2, p3indicate a transition which can not be described in
terms of a second order phase transition.
not any window where the conditions of criticality in terms of MCF are valid. A typical example for such an analysis in the pre-seismic kHz EM time series is shown in Fig. 11. The associated exponents are p2=0.68 and p3=0.1, verifying the
absence of any signature of an equilibrium phase transition. The physical feature hidden in the estimated exponents p2,
p3 is the existence of a strong cut of the large lengths in
the associated Levy walk. Importantly, this segment of EM emission shows persistency (0.5<H <1) (Contoyiannis et al., 2005), which is consistent with a strong cut of length of con-secutive steps of walk, and finally, with a abrupt “sweep” in the population of asperities.
9 Discussion/conclusions
EQs are large-scale fracture phenomena in the Earth’s het-erogeneous crust. Despite the large amount of experimental data and the considerable effort that has been undertaken by the material scientists, many questions about fracture pro-cesses remain standing. Especially, many aspects of EQ gen-eration still escape our full understanding. Fracture induced physical EM fields, rooted in the opening cracks, allow a real-time monitoring of damage evolution in materials dur-ing mechanical loaddur-ing from the laboratory up to the geo-physical scale. Clear kHz-to-MHz EM anomalies have been detected over periods ranging from a few days to a few hours prior to recent destructive EQs in Greece, with the MHz radi-ation appearing earlier than the kHz. Recent results indicate that these EM time-series contain information characteristic of an ensuing seismic event. A challenge in this field of re-search is to distinguish characteristic epochs in the evolution
Y. F. Contoyiannis and K. Eftaxias: Tsallis and Levy statistics 387
of the precursory EM activity associated with the Athens EQ and identify them with the equivalent last stages in the EQ preparation process. In this direction, our model of the focal area consists of (i) a backbone of strong and large entities distributed along the activated fault and (ii) a strongly het-erogeneous medium that surrounds the family of strong en-tities that prevent the free slip. Based on this model, we re-cently proposed the following two stages model (Contoyian-nis et al., 2005): The first epoch, which includes the initially emerged MHz EM activity, originates during cracking in the highly heterogeneous material that surrounds the backbone of large and strong entities. This emission could be described in analogy with a thermal continuous phase transition. The second epoch includes the kHz EM radiation that emerges in the tail of the precursory EM activity and ceases approx-imately nine hours before the Athens EQ. This activity in-dicates an underlying nonequilibrium process without any footprint of an equilibrium thermal phase transition. We have suggested that this radiation is due to the fracture of the back-bone that sustains the system (Contoyiannis et al., 2005). Ob-viously, the above mentioned crucial proposal needs further documentation.
In this work we focus on the first epoch/stage. We investi-gate a possible mechanism which can describe the observed critical state of fracture process in the heterogeneous regime of the focal area. We have shown that a Levy walk type mechanism could be a relevant candidate mode. Based on the analysis of a numerically produced truncated Levy walk, we propose a way to estimate in the stage of critical fracto-EM fluctuations: (i) the associated Levy index-a, which quantita-tively describes the underlying Levy dynamics; (ii) the range of values where the non-extensive Tsallis index q associated with critical fluctuations is restricted; (iii) the concrete q-value in the windows of precursory critical EM fluctuations. Based on a proposed relation between the Tsallis index q and the exponent of criticality p2we find that the q-index
asso-ciated with the fracture in heterogeneous media is restricted in region 1.66<q<2. As it is expected, the estimated val-ues q>1 represent a subextensive system: the interactions and information transition across the activated region have been verified. Importantly, the estimation for this nonexten-sive parameter is in full agreement with the limit q<2 ob-tained from several independent studies involving the Tsallis nonextensive framework.
Intuitively, the proposed Levy walk mechanism could be the result of a feedback “dialogue” between the stresses and heterogeneity. Recently, we have introduced a self-organized model, which can describe the fracture process (Contoyian-nis and Diakonos, 2006). We are going in a future work to specify this model in order to better understand the afore-mentioned dialogue.
A vital problem in material science and in geophysics is the identification of precursors of macroscopic defects or shocks. In physics, the degree to which we can predict a phenomenon is often measured by how well we understand
it. As it is said, despite the large amount of experimental data and the considerable effort that has been undertaken by the material scientists, many questions about the fracture remain standing. This fact is reflected in the disappointing progress on short-term EQ prediction. An improved understanding of the EM precursors, especially its physical basis, has a direct implications for the EQ generation processes and EQ predic-tion research. The physics of EQs has been demonstrated to be a very complicated matter, and the road seems to be long and hard. A difficulty stems from the lack of large and re-liable database: most studies in this area have been limited by a lack of enough experimental results to conduct a statis-tically significant analysis of the phenomena and obtain firm results. Another difficulty stems from the lack of collabora-tive efforts. We focus on these two difficulties.
It would be desirable to have the possibility to analyze more preseismic EM emissions. However, the collection of a volume of appropriate EM data for statistical purposes re-quires some decades of years at least. Indeed, due to their absorption these signals are associated with surface EQs of magnitude 6 or larger that occur on land or closed to coastline (Karamanos et al., 2006). However, such EQs occur rarely in Greece, so that a statistical evaluation stemming from the EM data is practically impossible (Karamanos et al., 2006). This fact obliges us to attempt a multidisciplinary evalua-tion of seismogenic origin of the detected candidate precur-sory EM emissions. Recently, a strong EQ with magnitude 6.9 occurred on 14 February (10:09:22.5 UTC) in southern Greece (36.570◦N, 21.750◦E) (http://www.emsc-csem.org). Precursory critical fluctuations by means of MCF have been found in the recordings of the electric antenna finely tuned at 41 MHz. These critical fluctuations lasted approximately 36 h and ceased at about 4 days before the EQ. The distribu-tion of the laminar lengths (see Fig. 12) is fitted by the func-tion (4), while the quality of fitting is excellent. The associ-ated critical exponents are p2=1.32 and p3=0.0072. These
values reveal a critical organization through a Levy mecha-nism with exponent µ=1.32 and Tsallis index q=1.76. Im-portantly, these results are in full agreement with the previ-ously presented ones associated with the Athens EQ. We note that a very clear KHz EM anomaly has also been detected prior to this recently occured EQ. The distribution of the lam-inar lengths in stationary segments of the detected anomaly is similar to that shown in Fig. 11, namely, it is characterized by an exponent p2<1 and an exponent p3no close to zero.
These value indicate a transition which can not be described in terms of a second order phase transition. The above men-tioned findings support the proposed two stage-model sce-nario of the EQ nucleation in terms of precursory MHz-kHz EM emissions (Contoyiannis et al., 2005).
In this field of research the reproducibility of the results is also desirable: the results based on kHz-MHz EM data should be verified by independent experiments. This requirement is well-satisfied in the case of the Athens EQ. Indeed, the kHz EM activity associated with the preparation
Fig. 12. A significant EQ with magnitude 6.9 occured in southern
Greece on 14 February, 2008. Critical EM fluctuations have been recorded by the antenna finely tuned at 41 MHz prior to this EQ (see text). The figure shows the distribution of the laminar lengths, as it produced by the analysis in terms of criticality, for the station-ary window of critical fluctuations of duration approximately 36 h. The fitting function (Eq. 4) is plotted by the solid line. The
associ-ated critical exponents are p2=1.32 and p3=0.0072. Importantly,
the distribution of the laminar lengths of the critical fluctuations
de-tected prior to the Athens EQ is characterized by the same p2, p3
exponents, namely, p2=1.30 and p3=0.0077.
of the Athens EQ is consistent with other precursors that are imposed by data from other disciplines such as: (i) seismology in terms of cumulative Benioff “strain”, (ii) infrared remote sensing, (iii) synthetic aperture radars interferometry, and (iv) ultra low-frequency seismic electric signals (SES) (Karamanos et al., 2006). Notice, these measurements could indicate the possible position of the epicenter and the magnitude of the impending EQ, while the analysis of MHz-KHz EM emissions particularly point to way of estimating the time to global failure. The case of the Athens EQ suggests that through integrated search for the EQ precursors and of related physical mechanisms, we hope to lay foundation for EQ generation and thus to achieve a better short-term earthquake predictions.
Edited by: A. Tsonis Reviewed by: A. Chmel
References
Alemany, P. and Zanette, D.: Fractal random walks from a varia-tional formalism for Tsallis entropies, Phys. Rev. E, 49, R956– R958, 1994.
Antoniou, N., Contoyiannis, Y., Diakonos, F., Karanikas, A., and Ktorides, C.: Pion production from a critical QCD phase, Nucl. Phys. A, 693, 799–824, 2001.
Baldovin, F. and Robledo, A.: Sensitivity to initial conditions at bi-furcations in one-dimensional nonlinear maps: Rigorous nonex-tensive solutions, Europhys. Lett., 60, 518–524, 2002.
Buiatti, M., Grigolini, P., and Montagnini, A.: Dynamic Approach to the Thermodynamics of Superdiffusion, Phys. Rev. Lett., 82, 3383–3387, 1999.
Contoyiannis, Y. and Diakonos, F.: Criticality and imtermittency in the order parameter space, Phys. Lett. A, 268, 286–292, 2000. Contoyiannis, Y., Diakonos, F., and Malakis, A.: Intermittent
dy-namics of critical fluctuations, Phys. Rev. Lett., 89, 035701/1–4, 2002.
Contoyiannis, Y., Kapiris, P., and Eftaxias, K.: Monitoring of a pre-seismic phase from its electromagnetic precursors, Phys. Rev. E, 71, 066123/1–14, 2005.
Contoyiannis, Y., Diakonos, F., Papaefthimiou, G., and Theophi-lidis, G.: Criticality in the relaxation phase of the spontaneous contracting atria isolated from the heart of the frog (Rana ridi-bunda), Phys. Rev. Lett., 93, 098101/1–4, 2004.
Contoyiannis, Y. and Diakonos, F.: Abrupt transition in a sandpile model, Phys. Rev. E, 73, 031303/1–5, 2006.
Diakonos, F., Pingel, D., and Schmelcher, P.: A stochastic approach to the construction of full-chaotic maps with prescribed statistical properties, Phys. Lett. A, 264, 162–170, 1999.
Kapiris, P., Eftaxias, K., and Chelidze, T.: The electromagnetic signature of prefecture criticality in heterogeneous media, Phys. Rev. Lett., 92, 065702/1–4, 2004.
Karamanos, K., Dakopoulos, D., Aloupis, K., Peratzakis, A., Athanasopoulou, L., Nikolopoulos, S., Kapiris, P., and Eftax-ias, K.: Study of pre-seismic electromagnetic signals in terms of complexity, Phys. Rev. E, 74, 016104/1–21, 2006.
Karamanos, K., Peratzakis, A., Kapiris, P., Nikolopoulos, S., Kopanas, J., and Eftaxias, K.: Extracting pre-seismic electro-magnetic signatures in terms of symbolic dynamics, Nonlin. Pro-cesses Geophys., 12, 835–848, 2005,
http://www.nonlin-processes-geophys.net/12/835/2005/. Koponen, I.: Analytic approach to the problem of convergence of
truncated Levy flights towards the Gaussian stochastic process, Phys. Rev. E, 52, 1197–1199, 1995.
Mantegna, R. and Stanley, H.: Stochastic Process with Ultraslow Convergence to a Gaussian: The Truncated Levy Flights, Phys. Rev. Lett., 73, 2946–2949, 1994.
Pingel, D., Schmelcher, P., and Diakonos, F.: Theory and examples to the inverse Frobenious-Perron problem for complete chaotic maps, Chaos, 9, 357–366, 1999.
Robledo, A.: Critical fluctuations, Intermittent dynamics and Tsal-lis statistics, Physica A, 344, 631–636, 2004.
Scafetta, N. and West, B.: Multiscaling Comparative Analysis of Time Series and Geophysical Phenomena, Complexity, 10, 51– 56, 2005.
Schuster, H.: Deterministic Chaos. An Introduction, VCH, 1989. Tsallis, C.: Possible generalization of Boltzmann-Gibbs statistics,
J. Stat. Phys., 52 479–487, 1988.
Vilar, C., Franca, G., Silva, R., and Alcaniz, J.: Nonextensivity in geological faults?, Physica A, 377, 285–290, 2007.