HAL Id: hal-00297756
https://hal.archives-ouvertes.fr/hal-00297756
Submitted on 18 Aug 2004HAL is a multi-disciplinary open access
archive for the deposit and dissemination of sci-entific research documents, whether they are pub-lished or not. The documents may come from teaching and research institutions in France or abroad, or from public or private research centers.
L’archive ouverte pluridisciplinaire HAL, est destinée au dépôt et à la diffusion de documents scientifiques de niveau recherche, publiés ou non, émanant des établissements d’enseignement et de recherche français ou étrangers, des laboratoires publics ou privés.
Carbon isotope anomaly in the major plant C1 pool and
its global biogeochemical implications
F. Keppler, R. M. Kalin, D. B. Harper, W. C. Mcroberts, J. T. G. Hamilton
To cite this version:
F. Keppler, R. M. Kalin, D. B. Harper, W. C. Mcroberts, J. T. G. Hamilton. Carbon isotope anomaly in the major plant C1 pool and its global biogeochemical implications. Biogeosciences Discussions, European Geosciences Union, 2004, 1 (1), pp.393-412. �hal-00297756�
BGD
1, 393–412, 2004
Carbon isotope anomaly in the major
plant C1pool F. Keppler et al. Title Page Abstract Introduction Conclusions References Tables Figures J I J I Back Close Full Screen / Esc
Print Version Interactive Discussion © EGU 2004 Biogeosciences Discussions, 1, 393–412, 2004 www.biogeosciences.net/bgd/1/393/ SRef-ID: 1810-6285/bgd/2004-1-393 © European Geosciences Union 2004
Biogeosciences Discussions
Biogeosciences Discussions is the access reviewed discussion forum of Biogeosciences
Carbon isotope anomaly in the major
plant C
1
pool and its global
biogeochemical implications
F. Keppler1, 2, R. M. Kalin2, D. B. Harper1, W. C. McRoberts1, 3, and
J. T. G. Hamilton1, 3
1
School of Agriculture and Food Science, Queen’s University Belfast, Newforge Lane, Belfast BT9 5PX, United Kingdom
2
Environmental Engineering Research Centres, Queen’s University Belfast, Belfast BT9 5AG, United Kingdom
3
Department of Agriculture and Rural Development for Northern Ireland, Newforge Lane, Belfast BT9 5PX, United Kingdom
Received: 26 July 2004 – Accepted: 10 August 2004 – Published: 18 August 2004 Correspondence to: F. Keppler ([email protected])
BGD
1, 393–412, 2004
Carbon isotope anomaly in the major
plant C1pool F. Keppler et al. Title Page Abstract Introduction Conclusions References Tables Figures J I J I Back Close Full Screen / Esc
Print Version Interactive Discussion
© EGU 2004 Abstract
We report that the most abundant C1units of terrestrial plants, the methoxyl groups of pectin and lignin, have a unique carbon isotope signature exceptionally depleted in13C. Plant-derived C1volatile organic compounds (VOCs) are also anomalously depleted in
13
C compared with Cn+1 VOCs. The results confirm that the plant methoxyl pool is
5
the predominant source of biospheric C1compounds of plant origin such as methanol, chloromethane and bromomethane. Furthermore this pool, comprising ca. 2.5% of carbon in plant biomass, represents an important substrate for methanogenesis and could be a significant source of isotopically light methane entering the atmosphere. Our findings have significant implications for the use of carbon isotope ratios in elucidation
10
of global carbon cycling. Moreover methoxyl groups could act as markers for biological activity in organic matter of terrestrial and extraterrestrial origin.
1. Introduction
Stable isotope analysis has become a powerful tool for environmental scientists, plant biologists, ecologists and geochemists studying global elemental cycles or past climatic
15
conditions (e.g. Ehleringer et al., 2002; Yakir, 2002; Hayes, 2001; Griffiths, 1998; Lajtha and Michener, 1994). Thus plant species have been photosynthetically characterised as Calvin cycle (C3), Slack-Hatch cycle (C4) and Crassulacean acid metabolism (CAM) categories using carbon isotope signatures(Griffiths, 1998; O’Leary, 1981). Moreover variations in the carbon isotope composition (δ13C values) of compounds, produced
20
and destroyed in the global carbon cycle, are often used to investigate biogeochemi-cal cycles and global source-sink relationships, as well as the underlying mechanisms (e.g. Cerling et al., 1997; Sherwood Lollar et al., 2002; Michaelis et al., 2002). Sta-ble isotope techniques are increasingly applied to the study of atmospheric budgets of volatile organic compounds (VOCs). Many C1 VOCs, such as methanol (CH3OH),
25
BGD
1, 393–412, 2004
Carbon isotope anomaly in the major
plant C1pool F. Keppler et al. Title Page Abstract Introduction Conclusions References Tables Figures J I J I Back Close Full Screen / Esc
Print Version Interactive Discussion
© EGU 2004
(CH3CN) and methane (CH4), play an important role in atmospheric chemistry and possibly climate change (see, for example, Heikes et al., 2002; Montzka et al., 2003; O’Dowd et al., 2002 ; Sanhueza et al., 2004; Wuebbles and Hayhoe, 2002). Numer-ous investigations into the atmospheric budget of such C1compounds, some employ-ing stable isotope techniques (Goldstein, 2003; Bill et al., 2004; Harper et al., 2003;
5
Thompson et al., 2002; Whiticar, 1999; Kalin et al., 2001) have been reported but many questions regarding their origin and fate remain unresolved.
Most CH3OH released from plants is derived from the ubiquitous plant component pectin by both enzymic and abiotic processes (Fall and Benson, 1996, Warneke et al., 1999; Galbally and Kirstine, 2002). Pectin which normally comprises between 7 and
10
35% of cell wall material in leaves is composed of galacturonic acid monomer units. Between 50 and 90% of the carboxyl groups of the latter are methyl esterified and provide the methyl pool for the reaction. We have also identified pectin as the source of CH3Cl and other monohalomethanes produced abiotically by senescent and dead leaf material (Hamilton et al., 2003). However, little consideration has been given to
15
the stable isotope signature of the methoxyl pool of pectin, or indeed that of another important plant component lignin, and the impact these might have on the δ13C values of C1compounds in the biosphere.
2. Materials and methods
Stable carbon isotope measurements: Carbon isotopic ratios of VOCs were
mea-20
sured by compound specific isotope analysis (GC-MS-IRMS) using a Thermo Finnigan Delta+ isotope ratio mass spectrometer interfaced with a Finnigan DSQ gas chromato-graph trace mass spectrometer. Bulk δ13C signatures of dried plant samples were determined using a Eurovector elemental analyzer coupled to a Micromass PRISM III isotope ratio mass spectrometer. Internal precision of δ13C was ±0.2 (‰).
Val-25
ues of δ13C (‰) relative to that for the Vienna-PDB are defined by the equation δ13C (‰)=(Rsample/Rstandard−1)×1000‰with R=13C/12C. The isotope difference (∆) between
BGD
1, 393–412, 2004
Carbon isotope anomaly in the major
plant C1pool F. Keppler et al. Title Page Abstract Introduction Conclusions References Tables Figures J I J I Back Close Full Screen / Esc
Print Version Interactive Discussion
© EGU 2004
two pools is defined as∆=δ13Cpool 1−δ13Cpool 2.
Heating experiments: For experiments shown in Fig. 1 freeze-dried milled leaf
biomass (250–1000 mg) was heated in a glass vessel according to the method of Hamilton et al. (2003) except that temperature programming increments were 12.5◦C instead of 25◦C. δ13C values of volatile organic compounds were measured at the
5
end of each temperature increment by GC-MS-IRMS. Results shown in Table 1 are for isothermal heating for 20 min at 225◦C of dried plant biomass.
Incubation experiments with fresh plant tissue: Fresh leaves (15–30 g) were
de-tached from the plant and immediately placed in glass vials (44 ml) and sealed with caps containing a PTFE lined silicona septa. Samples (n=3–6) were incubated in the
10
dark for 18 h at 25◦C and VOCs were measured by GC-MS-IRMS. Table 2 shows the mean values ±SD. Results for C3 plants are also meaned and SD between species given.
Pectin methoxyl groups: Carbon isotope signatures of the pectin methoxyl pool
were assessed by measuring δ13C values of methanol released by alkaline hydrolysis
15
of freeze-dried biomass. Molar NaOH (1 ml) was added to biomass (200 mg) in a 5 ml reaction vial. The vials were sealed with caps containing PTFE lined silicone septa and incubated for 12 h at 50◦C to quantitatively hydrolyse ester methoxyl groups to methanol. Control experiments indicated that no chemical fractionation of carbon isotopes in methanol occurred during the analytical procedure.
20
Lignin methoxyl groups: Carbon isotope signatures of lignin methoxyl groups were
assessed by measuring δ13C values of CH3I released by HI treatment (for 30 min at 100◦C) of the biomass fraction remaining after removal of the pectin methoxyl pool by alkaline hydrolysis. Control experiments with aromatic and aliphatic methyl esters indicated the procedure resulted in quantitative conversion of OCH3 groups to CH3I.
25
No significant chemical fractionation of carbon isotopes in CH3I occurred during the analytical procedure conducted as described.
Sample collection: The origin of the investigated plant tissues is shown below the
BGD
1, 393–412, 2004
Carbon isotope anomaly in the major
plant C1pool F. Keppler et al. Title Page Abstract Introduction Conclusions References Tables Figures J I J I Back Close Full Screen / Esc
Print Version Interactive Discussion
© EGU 2004
3. Results
In this study we have employed compound-specific carbon isotope ratio/mass spec-trometry (GC-MS/IR-MS) to measure the δ13C of two plant C1 pools, ester methoxyl (largely present as pectin), and aromatic ether methoxyl (predominantly present as lignin), and also the δ13C of several VOCs derived from fresh plant material at ambient
5
and elevated temperatures. We initially assessed carbon isotope fractionation on the pectin methyl pool in leaf tissue from ash (Fraxinus excelsior) by measuring δ13C in CH3OH released on alkaline hydrolysis. The δ13C observed for this esterified methyl pool was −77.2‰, a remarkably large13C fractionation (∆∼−45‰) compared with the overall δ13C of leaf biomass of −31.8‰. A biochemical rationale for this striking
deple-10
tion is however possible. Carboxyl groups in pectin are esterified by the enzyme pectin
O-methyltransferase (PMT) using S-adenosylmethionine (SAM) as methyl donor. Work
on purine alkaloids in several plant species (Weilacher et al., 1996) has suggested that the methyl pool in SAM is significantly depleted (δ13C≤−39‰) relative to the carbo-hydrate pool (δ13C=−27‰). Moreover, enzymic transmethylation involving SAM can
15
entail a substantial kinetic isotope effect (KIE); thus the reaction catalysed by catechol
O-methyltransferase displays a large fractionation (ε=90) (Hegazi et al., 1979). A
sim-ilar KIE in the enzymic methylation of pectin by PMT utilising 13C-depleted SAM as the methyl donor could account for the magnitude of the13C depletion observed in the pectin methyl pool.
20
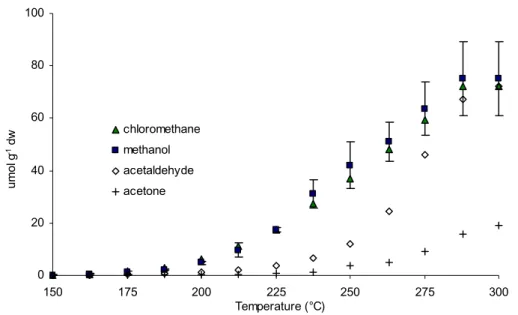
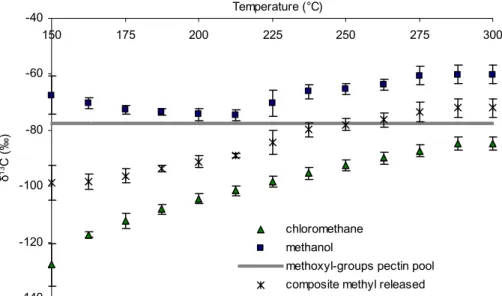
We next investigated the effect of progressive heating of leaf tissue of ash from 150 to 300◦C on the δ13C of volatiles released (Fig. 1). The main VOCs produced were CH3Cl, CH3OH, acetaldehyde and acetone (Fig. 1a). The δ13C values for both CH3Cl and CH3OH (Fig. 1b) were strikingly depleted with respect to biomass (∆ between −30 and −100‰). Emissions of CH3Cl exhibited a δ13C of −128‰at 150◦C (−147‰at
25
40◦C (see supplemental material, Table S1,http://www.copernicus.org/EGU/bg/bgd/1/
393/bgd-1-393-sp1.pdf), 13C fractionations, which, to the best of our knowledge, are the lightest isotopic values ever observed in a terrestrial carbon compound produced
BGD
1, 393–412, 2004
Carbon isotope anomaly in the major
plant C1pool F. Keppler et al. Title Page Abstract Introduction Conclusions References Tables Figures J I J I Back Close Full Screen / Esc
Print Version Interactive Discussion
© EGU 2004
during natural processes. A comparison of the δ13C of the pectin methyl pool with the composite δ13C value calculated on a molar basis for CH3Cl and CH3OH released dur-ing heatdur-ing is displayed in Fig. 1b. This isotopic mass balance clearly shows that when production of CH3Cl and CH3OH had ceased the composite δ13C value for these com-pounds closely corresponded with the δ13C value of the pectin methyl pool showing
5
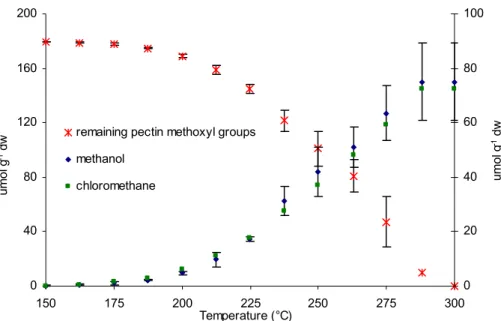
that pectin methoxyl groups are the major source of both CH3Cl and CH3OH. Alka-line hydrolysis of the residual material indicated that the total methoxyl pool had been volatilised by 300◦C (Fig. 1c). Measurements conducted using a model system of pu-rified pectin also confirmed that isotopic mass balance was achieved with respect to CH3Cl, CH3OH and pectin methoxyl during the heating cycle (see supplemental
ma-10
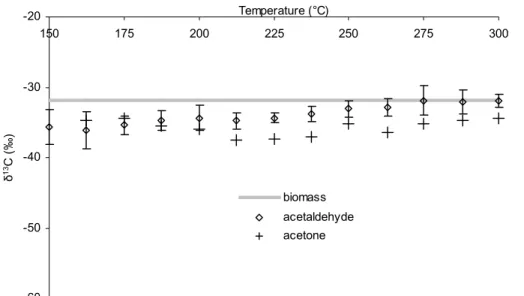
terial, Fig. S1,http://www.copernicus.org/EGU/bg/bgd/1/393/bgd-1-393-sp1.pdf). Fur-thermore it is evident that relative to the pectin methoxyl pool CH3Cl is always highly de-pleted whilst CH3OH normally exhibits slight but significant enrichment. The δ13C val-ues determined for acetaldehyde and acetone at all stages of the heating programme clearly reflected the isotope signature of bulk leaf biomass (Fig. 1d), unequivocally
15
distinguishing their origin from that of the C1 compounds. An explanation for the un-precedented depletion of 13C in CH3Cl released during heating of leaf tissue must await elucidation of the mechanism of the solid state reaction of halide ion with pectin (Hamilton et al., 2003).
To determine whether our findings with ash leaves could be replicated with other
20
species we conducted further studies on leaf tissue from trees, grasses and halo-phytes including plants from C3, C4and CAM plant categories involving heating of dried biomass isothermally at 225◦C (Table 1). For all species examined we observed a large fractionation between the pectin methyl pool and bulk biomass (∆∼−33‰, range −21 to −45‰). In general the isotope signatures for CH3OH reflected those of the pectin
25
methyl pool whilst those of CH3Cl were considerably more depleted in13C (∆∼−30‰). Signatures of C2 VOCs mirrored in general those of bulk biomass. Although the Br−, I− and CN− content of most plant tissues are insufficient to permit measurements on emissions of the corresponding substituted methanes, experiments performed with
pu-BGD
1, 393–412, 2004
Carbon isotope anomaly in the major
plant C1pool F. Keppler et al. Title Page Abstract Introduction Conclusions References Tables Figures J I J I Back Close Full Screen / Esc
Print Version Interactive Discussion
© EGU 2004
rified apple pectin supplemented with the different ions revealed that CH3Br, CH3I and CH3CN released on heating were also highly depleted in13C.
We extended our measurements to VOCs released from freshly collected plant ma-terial at ambient temperatures. Methanol, ethanol, acetaldehyde and acetone were naturally released in sufficient quantities for analytical measurements. The results were
5
similar to those obtained at higher temperatures (Table 2). Thus CH3OH, like the pectin methyl pool, was highly depleted in 13C (∆∼−33‰relative to bulk biomass). Carbon isotope signatures of ethanol and acetone were close to that of bulk biomass whilst ac-etaldehyde showed slight enrichment in13C (∆∼5‰). δ13C values for CH3Cl could not be measured (except for the halophytes) as amounts were below the detection limit of
10
the analytical method. As has been shown previously CH3Cl formation in fresh leaves with a high water content is generally low (Hamilton et al., 2003).
In addition to the pectin methyl pool the other important C1 pool in plant cell walls is represented by aromatic ether methoxyl groups which can comprise up to 18% of lignin. Lignin is a major component of wood (up to 31%) and is also found in smaller
15
quantities in leaves and grasses (∼5%). We therefore measured δ13C values of the lignin methoxyl pool in plant tissue from several species after conversion to CH3I with HI subsequent to removal of the pectin methyl pool by alkaline hydrolysis (Table 3). Depletion in13C of lignin methoxyl groups in wood (∆∼−13‰) relative to bulk biomass was substantial although not as dramatic as that observed for lignin methoxyl groups in
20
leaves (mean of all leaves∆∼−29‰, range −20 to −38‰). These findings explains the widely reported13C depletion of lignin relative to other major plant components (Ben-ner et al., 1987; Schweizer et al., 1999; Fernandez et al., 2003; Hobbie and Wer(Ben-ner, 2004) which has previously been attributed to13C fractionation in aromatic amino acids involved in lignin biosynthesis. Thus assuming a methoxyl content of 15–20% a
deple-25
tion of -13‰in methoxyl carbon readily explains the observed 2–3‰difference between
δ13C of lignin and bulk biomass of wood. Similarly the much larger depletion observed in methoxyl carbon in leaf tissue provides an explanation for the 3–7‰13C depletion of lignin relative to bulk biomass in leaves of both C3 and C4plants. Archaeological and
BGD
1, 393–412, 2004
Carbon isotope anomaly in the major
plant C1pool F. Keppler et al. Title Page Abstract Introduction Conclusions References Tables Figures J I J I Back Close Full Screen / Esc
Print Version Interactive Discussion
© EGU 2004
fossil wood specimens are often used to provide information on palaeoenvironmental and palaeoclimatic conditions in the geological record (van Bergen and Poole, 2002). Hence alterations to wood which involve cleavage of the isotopically light methoxyl groups will be critically important in interpretation of the significance of the isotope signatures of individual wood components.
5
4. Conclusions
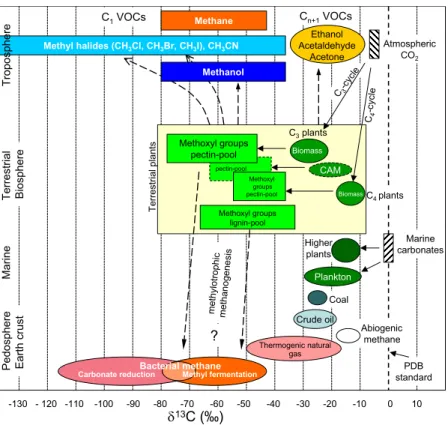
We have summarised our findings on the δ13C values of methoxyl pools in plants and some plant derived C1VOCs in Fig. 2 where they are related to fractionations reported in the literature for bulk biomass of various categories of plant and other terrestrial carbon sources (Whiticar, 1996). The depletion between bulk plant biomass and plant
10
methoxyl pools ranges from −11 to −46‰with the pectin C1 pool generally more de-pleted than the lignin C1 pool. The fractionation associated with the methoxyl pools is retained and even further enhanced during their conversion to C1 VOCs. For bio-genic VOC emissions from living vegetation, the more labile pectin pool rather than the lignin pool is likely to be the major source. However during biomass burning both
15
pectin and lignin C1pools will contribute to C1VOC production. In soils under aerobic conditions demethylation of pectin and lignin, both enzymically (e.g. Fall and Benson, 1996; Ander and Eriksson, 1985) and abiotically (e.g. Dec et al., 2001, Keppler et al., 2000) is very probably an important source of several C1 VOCs. Under anoxic con-ditions C1 compounds from both C1 pools can act as substrates for methylotrophic
20
methanogenic bacteria forming CH4 (Whiticar, 1999; Cicerone and Oremland, 1988). It has been assumed to date that the carbon signature of a substrate for methanogens in a specific environment is broadly similar to that of the bulk organic matter present, provided severe substrate depletion has not occurred (Whiticar, 1999). If, however in the upper horizon of wetlands, peat bogs and rice paddies, methanogens are utilising
25
methanol and other C1substrate from the plant methoxyl pool with δ13C values aver-aging −50‰, the production of CH4 more highly depleted than previously envisaged
BGD
1, 393–412, 2004
Carbon isotope anomaly in the major
plant C1pool F. Keppler et al. Title Page Abstract Introduction Conclusions References Tables Figures J I J I Back Close Full Screen / Esc
Print Version Interactive Discussion
© EGU 2004
might be expected. Indeed δ13C values for CH4derived from the plant methoxyl pool may be of the same order as the lowest observed for CH4 produced by bacterial car-bonate reduction (Whiticar, 1999; Cicerone and Oremland, 1988). Since approximately 2.5% of carbon in plant biomass is methoxyl carbon (Galbally and Kirstine, 2002), any isotopically-based discussion of global carbon cycling must give consideration to this
5
isotopically anomalous C1pool.
Our findings may also have some relevance to the search for ancient life on earth and for extraterrestrial life. The striking depletion of δ13C in methoxyl carbon consequent on the biochemistry of C1 metabolism in plants may well extend to many other or-ganisms which utilise S-adenosylmethionine as a methyl donor in O-methyltransferase
10
reactions and could even serve to distinguish biologically formed methyl esters and ethers from those generated abiotically. Conversely, the exceptional 13C fractiona-tion during abiotic producfractiona-tion of CH3Cl from biomass (which we have reproduced by heating hydrochlorides of methyl esters of amino acids, (see supplemental ma-terial, Fig. S2,http://www.copernicus.org/EGU/bg/bgd/1/393/bgd-1-393-sp1.pdf)
sug-15
gest that caution is necessary in interpreting such fractionation as unequivocal evi-dence of life.
In conclusion the fractionation of carbon isotopes by the principal
O-methyltransferase enzymes in plants appears to be of the same order as that achieved by ribulose biphosphate carboxylase-oxygenase (Rubisco) in photosynthesis. Hitherto
20
it has been assumed that within a given photosynthetic category the carbon isotope sig-nature of specific chemical components and specific intramolecular sites within such components does not differ from the carbon isotope signature of bulk biomass by more than 12‰(Weilacher et al., 1996; Hobbie and Werner, 2004). Our results indicate a
13
C depletion relative to bulk biomass of up to 45‰for methoxyl carbon in plants, the
25
largest carbon isotope fractionation ever observed in the plant kingdom. This isotope anomaly should prove not only an invaluable tool in tracing the path of such C1carbon in the environment but also provide a new insight into the global cycling of many C1 atmospheric trace gases and the biochemical pathways involved.
BGD
1, 393–412, 2004
Carbon isotope anomaly in the major
plant C1pool F. Keppler et al. Title Page Abstract Introduction Conclusions References Tables Figures J I J I Back Close Full Screen / Esc
Print Version Interactive Discussion
© EGU 2004
Acknowledgements. The authors thank W. Michaelis, J. Raven, and T. R ¨ockmann for help-ful advice regarding the manuscript; W. Meier-Augenstein, A. Downey, K. Redeker, E. Tujek, B. Ferguson, T. Kennedy for technical assistance and the European Commission for a Marie Curie-Research Training Grant (MCFI-2002-00022) awarded to F. K. Supported by grants from EPSRC GR/R03099/01, QUB SRIF for Environmental Engineering and Biotechnology, and INI
5
TDP Centre of Excellence.
References
Ander, P. and Eriksson, K.-E.: Methanol formation during lignin degradation by Phanerochaeta chrysosporium, Appl. Microbial. Biotechnol., 21, 96–102, 1985.
Benner, R., Fogel, M. L., Sprague, E. K., and Hodson, R. E.: Depletion of13C lignin and its
10
implications for stable isotope studies, Nature, 329, 708-710 (1987).
Bill, M., Conrad, M. E., and Goldstein, A. H.: Stable carbon isotope composition of atmospheric methyl bromide, Geophys. Res. Lett., 31, L04109, DOI:10.1029/2003GL018639, 2004. Cerling, T. E., Harris, J. M., MacFadden, B. J. et al.: Global vegetation change through the
Miocene/Pliocene boundary, Nature, 389, 153–158, 1997.
15
Cicerone, R. J. and Oremland R. S.: Biogeochemical aspects of atmospheric methane, Global Biogeochem Cycles, 2, 299–327, 1988.
Dec, J., Haider, K., and Bollag, J.-M.: Decarboxylation and demethoxylation of naturally oc-curring phenols during coupling reactions and polymerization, Soil Science, 166, 660–671, 2001.
20
Ehleringer, J. R., Bowling, D. R., Flanagan, L. B. et al.: Stable isotopes and carbon cycle processes in forests and grasslands, Plant. Biol., 4, 181–189, 2002.
Fall, R. and Benson, A. A.: Leaf methanol – the simplest natural product from plants, Trends in Plant Science, 1, 296–301, 1996.
Fernandez, I., Mahieu, N., and Cadisch, G.: Carbon isotopic fractionation during
de-25
composition of plant materials of different quality, Global Biogeochem Cycles, 17, DOI:10.1029/2001GB001834, 2003.
Galbally, I. E. and Kirstine, W.: The production of methanol by flowering plants and the global cycle of methanol, J. Atmos. Chem., 43, 195–229, 2002.
BGD
1, 393–412, 2004
Carbon isotope anomaly in the major
plant C1pool F. Keppler et al. Title Page Abstract Introduction Conclusions References Tables Figures J I J I Back Close Full Screen / Esc
Print Version Interactive Discussion
© EGU 2004
Goldstein, A. H. and Shaw, S. L.: Isotopes of volatile organic compounds: an emerging ap-proach for studying atmospheric budgets and chemistry, Chem. Rev., 103, 5025–5048, 2003. Griffiths, H. (ed.): Stable Isotopes and the Integration of Biological, Ecological and Geochemical
Processes, Bios Scientific Publishers, Oxford, 1998.
Hamilton, J. T. G., McRoberts, W. C., Keppler, F., Kalin, R. M., and Harper, D. B.: Chloride
5
methylation by plant pectin: an efficient environmentally significant process, Science, 301, 206–209, 2003.
Harper, D. B., Hamilton, J. T. G., Ducrocq, V. et al.: The distinctive isotopic signature of plant-derived chloromethane: possible application in constraining the atmospheric chloromethane budget, Chemosphere, 52, 433–436, 2003.
10
Hayes, J. M.: Fractionation of the isotopes of carbon and hydrogen in biosynthetic processes, Rev Mineral Geochem, 43, 225–277, 2001.
Hegazi, M. F., Borchardt, R. T., and Schowen, R. L.: α-Deuterium and carbon-13 isotope effects for methyl transfer catalyzed by catechol O-methyltransferase. SN2-like transition state, J. Am. Chem. Soc., 101, 4359–4364, (1979).
15
Heikes, B. G., Chang, W., Pilson, M. E. Q. et al.: Atmospheric methanol budget and ocean implication, Global Biogeochem Cycles, 16, DOI:10.1029/2002GB001895, 2002.
Hobbie, E. A. and Werner, R.: Intramolecular, compound-specific, and bulk carbon isotope patterns in C3and C4plants: a review and synthesis, New Phytologist, 161, 371–385, 2004. Kalin, R. M., Hamilton, J. T. G., Harper, D. B. et al.: Continuous flow stable isotope methods for
20
sudy of δ13C fractionation during halomethane production and degradation, Rapid Commun Mass Spectrom, 15, 357–363, 2001.
Keppler, F., Eiden, R., Niedan, V., Pracht, J. and Sch ¨oler, H. F.: Halocarbons produced by natural oxidation processes during degradation of organic matter, Nature, 403, 298–301, 2000.
25
Lajtha, K. and Michener, R. B. (eds.): Stable Isotopes in Ecology and Environmental Science, Blackwell Scientific Publications, Oxford, 1994.
Michaelis, W., Seifert, R., Nauhaus, K. et al.: Microbial reefs in the Black Sea fueled by anaer-obic oxidation of methane, Science, 297, 1013–1015, 2002.
Montzka, S. A., Fraser, P. J., Butler, J. H. et al.: “Controlled Substances and Other Source
30
Gases” in WMO Scientific Assessment of Ozone Depletion. Global Ozone Research and Monitoring Project, Report No. 47, World Meterological Organization, Geneva, http://www.
BGD
1, 393–412, 2004
Carbon isotope anomaly in the major
plant C1pool F. Keppler et al. Title Page Abstract Introduction Conclusions References Tables Figures J I J I Back Close Full Screen / Esc
Print Version Interactive Discussion
© EGU 2004
O’Dowd, C. D., Jimenez, J. C. Bahreini, R. et al.: Marine aerosol formation from biogenic iodine emissions, Nature, 417, 632–636, 2002.
O’Leary, M. H.: Carbon isotope fractionations in plants, Phytochemistry, 20, 553–567, 1981. Sanhueza, E., Holzinger, R., Kleiss, B., Donoso, L., and Crutzen, P. J.: New insights in the
global cycle of acetonitrile: release from the ocean and dry deposition in the tropical savanna
5
of Venezuela, Atmos. Chem. Phys. Discuss., 4, 275–280, 2004.
Schweizer, M., Fear, F., and Cadisch, G.: Isotopic (13C) fractionation during plant residue de-composition and its implications for soil organic matter studies, Rapid Commun. Mass Spec-trom., 13, 1284–1290, 1999.
Sherwood Lollar, B., Westgate, T. D., Ward, J. A. et al.: Abiogenic formation of alkanes in the
10
Earth’s crust as a minor source for global hydrocarbon reservoirs, Nature, 416, 522–524, 2002.
Thompson, A. E., Anderson R. S., Rudolph, J., and Huang, L.: Stable carbon isotopes signa-tures of background tropospheric chloromethane and CFC113, Biogeochemistry, 60, 191– 211, 2002.
15
van Bergen, P. F. and Poole, I.: Stable carbon isotopes of wood: a clue to palaeoclimate?, Palaeogeogr. Palaeoclimatol. Palaeoecol., 182, 31–45, 2002.
Warneke, C., Karl, T., Judmaier, H. et al.: Acetone, methanol, and other partially oxidised volatile organic emissions from dead plant matter by abiotical processes: significance for atmospheric HOxchemistry, Global Biogeochem. Cycles, 13, 9–17, 1999.
20
Weilacher, T., Gleixner, G., and Schmidt, H. L.: Carbon isotope pattern in purine alkaloids a key to isotope discriminations in C1compounds, Phytochemistry, 41, 1073–1077, 1996. Whiticar, M. J.: Stable isotope geochemistry of coals, humic kerogens and related natural
gases, Int. J. Coal. Geol., 32, 191–215, 1996.
Whiticar, M. J.: Carbon and hydrogen isotope systematics of bacterial formation and oxidation
25
of methane, Chem. Geol., 161, 291–314, 1999.
Wuebbles, D. J. and Hayhoe, K.: Atmospheric methane and global change, Earth-Science Reviews, 57, 177–210, 2002.
Yakir, D.: Sphere of influence, Nature, 416, 795, 2002.
BGD
1, 393–412, 2004
Carbon isotope anomaly in the major
plant C1pool F. Keppler et al. Title Page Abstract Introduction Conclusions References Tables Figures J I J I Back Close Full Screen / Esc
Print Version Interactive Discussion
© EGU 2004
Table 1. δ13C values1 of biomass, pectin methoxyl groups and VOCs produced upon heating (225◦C) dried biomass.
Plant common name (species) Biomass (B) (δ13 C) Pectin methoxyl (PM) (δ13 C) ∆13 C (PM-B) (δ13 CPM-δ13CB) Methanol (δ13 C) Chloromethane (δ13 C) Acetaldehyde (δ13 C) Acetone (δ13 C) C3-leaf tissue
European ash (Fraxinus excelsior)2 -31.8 ± 0.2 -77.2 ± 0.1 -45.4 -70.4 ± 2.5 -98.4 ± 2.2 -34.0 ± 1.1 -36.2 ± 2.8
Wych Elm (Ulmus glabra)2 -28.4 ± 0.1 -61.7 ± 0.2 -33.3 -61.1 ± 1.8 -85.3 ± 3.1 -31.2 ± 0.7 -33.2 ± 2.1
Hazelnut (Corylus avellana)2
-29.1 ± 0.1 -66.3 ± 0.2 -37.2 -64.0 ± 1.8 -96.0 ± 2.1 -33.2 ± 1.3 34.5 ± 1.9 English oak (Quercus robur)2
-31.4 ± 0.1 -74.4 ± 0.2 -43.0 -75.0 -104.3 -28.9 -31.7 Norway maple (Acer platanoides)2
-27.6 ± 0.2 -61.3 ± 1.0 -35.7 -58.3 -92.4 -27.0 -21.1 Horse chestnut (Aesculus
hippocastanum)2 -31.7 ± 0.2 -66.3 ± 2.0 -34.6 -60.4 -94.9 -29.5 -29.7
Scots pine (Pinus sylvestris)2
-27.6 ± 0.1 -53.7 ± 0.2 -26.1 -49.3 -86.8 -24.9 -30.8 Cocksfoot (Dactylis glomerata)3
-29.3 ± 0.2 -50.7 ± 0.2 -21.4 -52.6 -72.8 -28.1 -34.3 Glasswort (Salicornia spp)4 -28.6 ± 0.1 -53.7 ± 0.2 -25.1 -42.0 -76.3 -27.1 -34.6 Mean of C3 plants -29.5 -62.8 -33.5 -59.2 -89.7 -29.3 -31.8 (SD between C3 plants) (± 1.7) (± 9.2) (± 8.1) (± 10.3) (± 10.3) (± 3.0) (± 4.5) C4-leaf tissue
Maize (Zea mays)4
-11.0 ± 0.1 -40.5 ± 0.6 -29.5 -39.7 -91.3 -11.6 -16.9
CAM-leaf tissue
Saltwort (Batis maritima)4
-25.6 ± 0.4 -63.3 ± 0.4 -37.7 -64.9 -78.3 -22.4 -25.3 Scarlet paintbrush (Crassula
falcata)4 -17.9 ± 0.1 -51.1 ± 0.5 -33.3 -41.1 -81.4 -16.2 -20.8
1
All values in ‰, either mean of two samples or n=3-5 ± SD, for sample preparation and analytical measurements see Methods (25). 2
Leaves were collected at Crossgar, N. Ireland in October 2002. 3Leaves were collected at Crossgar, N. Ireland in July 2003. 4Greenhouse-grown in N. Ireland 2003.
BGD
1, 393–412, 2004
Carbon isotope anomaly in the major
plant C1pool F. Keppler et al. Title Page Abstract Introduction Conclusions References Tables Figures J I J I Back Close Full Screen / Esc
Print Version Interactive Discussion
© EGU 2004
Table 2. δ13C values1of biomass, pectin methoxyl pool and VOCs emitted at 25◦C from fresh plant tissue.
Plant common name (species) Biomass (B)
(δ13C) Pectin methoxyl (PM) (δ13C) ∆13 C (PM-B) (δ13C PM-δ13CB) Methanol (δ13C) Acetaldehyde (δ13C) Ethanol (δ13C) Acetone (δ13C) C3-leaf2
European ash (Fraxinus excelsior) -27.9 ± 0.2 -73.7 ± 1.0 -45.8 -73.5 ± 0.7 -22.7 ± 0.4 -28.5 ± 0.5 -31.3 ± 1.4 Wych elm (Ulmus glabra) -28.7 ± 0.1 -68.9 ± 0.1 -40.2 -82.9 ± 5.9 -25.6 ± 1.9 -30.1 ± 2.0 -26.7 ± 3.1 Hazelnut (Corylus avellana) -33.6 ± 0.2 -64.6 ± 0.4 -31.0 -63.5 ± 2.8 -25.9 ± 2.5 -30.5 ± 1.2 -26.3 ± 2.4 English oak (Quercus robur) -30.8 ± 0.1 -69.2 ± 0.3 -38.4 -76.6 ± 3.9 -23.9 ± 0.5 -29.9 ± 0.3 -28.8 ± 2.9 European beech (Fagus sylvatica) -31.8 ± 0.2 -68.2 ± 1.0 -36.4 -84.2 ± 2.6 -25.8 ± 1.4 -31.3 ± 1.1 -27.5 ± 3.2 Norway maple (Acer platanoides) -33.6 ± 0.1 -63.1 ± 0.6 -29.5 -70.3 ± 0.7 -27.8 ± 1.4 -33.7 ± 0.5 -26.9 ± 1.2 Horse chestnut (Aesculus
hippocastanum) -31.7 ± 0.3 -73.4 ± 0.1 -41.7 -71.0 ± 2.4 -20.8 ± 0.8 -26.9 ± 1.2 -23.6 ± 2.4
Scots pine (Pinus sylvestris) -28.2 ± 0.2 -57.3 ± 0.3 -29.1 -60.2 ± 1.5 -24.3 ± 1.7 -23.9 ± 1.4 -31.6 ± 2.5 Cocksfoot (Dactylis glomerata) -29.3 ± 0.2 -50.7 ±0.2 -21.4 -51.9 ± 0.2 -22.7 ± 1.1 -29.0 ± 1.4 -30.6 ± 1.4 Yorkshire fog (Holcus lanata) -31.3 ± 0.3 -57.1 ± 0.2 -25.8 -65.4 ± 1.3 -27.5 ± 0.9 -31.6 ± 1.0 -26.7 ± 0.5 Glasswort (Salicornia sp)3
-28.6 ± 0.1 -53.7 ± 0.2 -25.1 -50.4 ± 0.9 -26.8 ± 0.7 -28.5 ± 1.5 -29.4 ± 2.1
Mean of C3 plants -30.5 -63.6 -33.1 -68.2 -24.9 -29.4 -28.1
(SD between C3 plant species) (± 2.1) (± 7.9) (± 7.8) (± 11.2) (± 2.2) (± 2.6) (± 2.5)
C4-leaf
Maize (Zea mays)3
-11.0 ± 0.1 -40.5 ± 0.6 -29.5 -52.9 ± 0.8 -9.3 ± 1.3 -15.2 ± 0.5 -16.6 ± 1.2
CAM-leaf
Saltwort (Batis maritima)3
-25.6 ± 0.4 -63.3 ± 0.4 -37.7 -60.0 ± 0.9 -24.4 ± 1.7 -23.8 ± 1.2 -27.8 ± 0.3 Scarlet paintbrush (Crassula
falcata)3 -17.9 ± 0.1 -51.1 ± 0.9 -33.2 -55.9 ± 2.1 -10.3 ± 0.5 -17.2 ± 0.2 -19.8 ± 0.7
1
All values in ‰ ± SD (n=3-5), analytical measurements see Methods. 2
Fresh leaves were collected at Crossgar, N. Ireland in July 2003. 3
Greenhouse-grown in N. Ireland 2003.
BGD
1, 393–412, 2004
Carbon isotope anomaly in the major
plant C1pool F. Keppler et al. Title Page Abstract Introduction Conclusions References Tables Figures J I J I Back Close Full Screen / Esc
Print Version Interactive Discussion
© EGU 2004
Table 3. δ13C values1of biomass and the lignin and pectin methoxyl pools of plant tissues.
Plant common name (species) Biomass (B) (δ13C) Lignin methoxyl (LM) (δ13C) ∆13 C (LM-B) (δ13 CLM-δ13CB) Pectin methoxyl (PM) (δ13C) ∆13 C (PM-B) (δ13 CPM-δ13CB) C3-wood2
European ash (Fraxinus excelsior) -24.5 ± 0.7 -36.9 ± 1.2 -12.4 -43.1 ± 0.6 -18.6
English oak (Quercus robur) -29.4 ± 0.2 -41.1 ± 1.3 -11.7 -44.2 ± 1.2 -14.8
Sweet osmanthus (Osmanthus fragans) -27.3 ± 0.1 -41.7 ± 1.2 -14.7 -53.3 ± 1.1 -26.0
Geronggang (Cratoxylum sp) -26.5 ± 0.3 -39.5 -13.0 n.d. -
Tasmanian oak (Eucalyptus delegatensis) -26.3 ± 0.2 -37.7 -11.4 -45.4 ± 0.7 -18.1
Dark red meranti (Shorea sp) -28.2 ± 0.2 -44.0 -15.8 -45.6 ± 0.3 -17.4
Utile (Entandrophragma utile) -27.1 ± 0.2 -39.5 -12.4 n.d. -
Mean of wood -27.1 -40.1 -13.0 -46.3 -19.2 C3-leaf3
European ash (Fraxinus excelsior) -27.9 ± 0.2 -65.5 -37.6 -73.7 ± 1.0 -45.8
English oak (Quercus robur) -30.8 ± 0.1 -62.2 -31.4 -69.2 ± 0.3 -38.4
European beech (Fagus sylvatica) -31.8 ± 0.2 -66.2 -34.4 -68.2 ± 1.0 -36.4
Norway maple (Acer platanoides) -33.6 ± 0.2 -61.4 -27.8 -63.1 ± 0.6 -29.5
Scots pine (Pinus sylvestris) -27.6 ± 0.1 -51.7 -24.1 -53.7 ± 0.3 -26.1
Cocksfoot grass (Dactylis glomerata) -29.3 ± 0.2 -53.5 -24.2 -50.7 ± 0.2 -21.4
Mean of C3-leaves -30.2 -60.1 -29.9 -63.1 -32.9
C4-leaf
Sugar cane (Saccharum officinarum)4 -11.9 ± 0.1 -42.1 -30.2 -36.0 ± 0.9 -24.1
Savanna grass (Hyparrhenia sp)5
-12.8 ± 0.2 -33.1 -20.2 n.d. -
Maize (Zea mays)6
-11.0 ± 0.1 -47.3 -36.3 -40.5 ± 0.6 -29.5
CAM-leaf
Saltwort (Batis maritima)6
-25.6 ± 0.4 -52.4 -25.7 -63.3 ± 0.4 -37.3
Scarlet paintbrush (Crassula falcata)6
-17.9 ± 0.1 -49.6 -31.7 -51.1 ± 0.5 -33.2
Mean of C3, C4 and CAM leaves -29.0 -32.2
1
All values in ‰, either mean of two samples or n=3-5 ± SD; n.d.: - not detectable, for sample preparation and analytical measurements see Methods (25). 2
Wood samples were collected from Cameroon, Indonesia, Malaysia, and N. Ireland. 3
Leaves were collected at Crossgar, N. Ireland in July 2003. 4
Sampled from South Africa. 5
Sampled from Cote d’Ivory. 6
BGD
1, 393–412, 2004
Carbon isotope anomaly in the major
plant C1pool F. Keppler et al. Title Page Abstract Introduction Conclusions References Tables Figures J I J I Back Close Full Screen / Esc
Print Version Interactive Discussion © EGU 2004 17 Figure 1 (A,B,C,D) A 0 20 40 60 80 100 150 175 200 225 250 275 300 Temperature (°C) umol g -1 dw chloromethane methanol acetaldehyde acetone B -140 -120 -100 -80 -60 -40 150 175 200 225 250 275 300 Temperature (°C) δ 13C ( ‰ ) chloromethane methanol
methoxyl-groups pectin pool composite methyl released
Fig. 1. Amounts and isotopic signatures of several volatile organic compounds formed
dur-ing progressive heatdur-ing of lypholised ash leaves. (a) Cumulative amounts of methanol,
chloromethane, acetaldehyde and acetone formed are shown on a molar basis. Each point is the mean of three replicate analyses of independent samples (n=3). Error bars shown for CH3OH are typical of SDs for all compounds.
BGD
1, 393–412, 2004
Carbon isotope anomaly in the major
plant C1pool F. Keppler et al. Title Page Abstract Introduction Conclusions References Tables Figures J I J I Back Close Full Screen / Esc
Print Version Interactive Discussion © EGU 2004 17 Figure 1 (A,B,C,D) A 0 20 40 60 80 100 150 175 200 225 250 275 300 Temperature (°C) umol g -1 dw chloromethane methanol acetaldehyde acetone B -140 -120 -100 -80 -60 -40 150 175 200 225 250 275 300 Temperature (°C) δ 13C ( ‰ ) chloromethane methanol
methoxyl-groups pectin pool composite methyl released
Fig. 1. (b) Carbon isotopic composition of accumulated CH3OH and CH3Cl at each temper-ature during progressive heating. Also shown is the composite δ13C values calculated on a molar basis for CH3OH and CH3Cl released during heating. For reference the measured initial δ13C of the pectin methoxyl pool is displayed. Vertical bars show SD for triplicate samples.
BGD
1, 393–412, 2004
Carbon isotope anomaly in the major
plant C1pool F. Keppler et al. Title Page Abstract Introduction Conclusions References Tables Figures J I J I Back Close Full Screen / Esc
Print Version Interactive Discussion © EGU 2004 18 C 0 40 80 120 160 200 150 175 200 225 250 275 300 Temperature (°C) um ol g -1 dw 0 20 40 60 80 100 umol g -1 dw remaining pectin methoxyl groups
methanol chloromethane D -60 -50 -40 -30 -20 150 175 200 225 250 275 300 Temperature (°C) δ 13C ( ‰ ) biomass acetaldehyde acetone
Figure 1. Amounts and isotopic signatures of several volatile organic compounds formed
during progressive heating of lypholised ash leaves. (A) Cumulative amounts of methanol, chloromethane, acetaldehyde and acetone formed are shown on a molar basis. Each point is the mean of three replicate analyses of independent samples (n=3). Error bars shown for CH3OH are typical of SDs for all compounds. (B) Carbon isotopic composition of accumulated CH3OH and CH3Cl at each temperature during progressive heating. Also shown
Fig. 1. (c) Remaining pectin methoxyl pool (PM) after each heating step in relation to the
formation of methanol and chloromethane.
BGD
1, 393–412, 2004
Carbon isotope anomaly in the major
plant C1pool F. Keppler et al. Title Page Abstract Introduction Conclusions References Tables Figures J I J I Back Close Full Screen / Esc
Print Version Interactive Discussion © EGU 2004 18 C 0 40 80 120 160 200 150 175 200 225 250 275 300 Temperature (°C) um ol g -1 dw 0 20 40 60 80 100 umol g -1 dw
remaining pectin methoxyl groups methanol chloromethane D -60 -50 -40 -30 -20 150 175 200 225 250 275 300 Temperature (°C) δ 13C ( ‰ ) biomass acetaldehyde acetone
Figure 1. Amounts and isotopic signatures of several volatile organic compounds formed
during progressive heating of lypholised ash leaves. (A) Cumulative amounts of methanol, chloromethane, acetaldehyde and acetone formed are shown on a molar basis. Each point is the mean of three replicate analyses of independent samples (n=3). Error bars shown for
CH3OH are typical of SDs for all compounds. (B) Carbon isotopic composition of
accumulated CH3OH and CH3Cl at each temperature during progressive heating. Also shown
Fig. 1. (d) Carbon isotope composition of accumulated acetaldehyde and acetone at various
temperatures during progressive heating of ash leaf biomass with reference to the δ13C value of the original bulk biomass. Error bars shown for acetaldehyde are also typical of those for acetone.
BGD
1, 393–412, 2004
Carbon isotope anomaly in the major
plant C1pool F. Keppler et al. Title Page Abstract Introduction Conclusions References Tables Figures J I J I Back Close Full Screen / Esc
Print Version Interactive Discussion © EGU 2004 C-c4 ycle Higher plants Coal C4 plants ? -130 - 120 -110 -100 -90 -80 -70 -60 -50 -40 -30 -20 -10 0 10 δ13C (‰) Crude oil Abiogenic methane Thermogenic natural gas
Pedosphere Earth crust Terrestrial Biosphere Methoxyl groups pectin-pool C3 plants met hylo tr ophi c met hano gene sis C1 VOCs Cn+1 VOCs Atmospheric CO2 C3-c ycle CAM Marine carbonates Methane Ethanol Acetaldehyde Acetone Methanol
Methyl halides (CH3Cl, CH3Br, CH3I), CH3CN
Marine Plankton
PDB standard
Biomass
Carbonate reductionBacterial methaneMethyl fermentation
Biomass Te rre stria l pl an ts Methoxyl groups lignin-pool Methoxyl groups pectin-pool pectin-pool Troposphere
Fig. 2. Schematic diagram displaying13C depletion of methoxyl groups relative to bulk biomass of terrestrial plants and their relationship to biospheric C1 and Cn+1 VOCs. Data for carbon isotopic composition of major carbon pools were taken from Whiticar (1996). Carbon isotope signatures for VOCs are related to sources, degradation steps after formation are not taken into account.