HAL Id: hal-00304113
https://hal.archives-ouvertes.fr/hal-00304113
Submitted on 18 Apr 2008HAL is a multi-disciplinary open access
archive for the deposit and dissemination of sci-entific research documents, whether they are pub-lished or not. The documents may come from teaching and research institutions in France or abroad, or from public or private research centers.
L’archive ouverte pluridisciplinaire HAL, est destinée au dépôt et à la diffusion de documents scientifiques de niveau recherche, publiés ou non, émanant des établissements d’enseignement et de recherche français ou étrangers, des laboratoires publics ou privés.
Technical Note: A new global database of trace gases
and aerosols from multiple sources of high vertical
resolution measurements
B. Hassler, G. E. Bodeker, M. Dameris
To cite this version:
B. Hassler, G. E. Bodeker, M. Dameris. Technical Note: A new global database of trace gases and aerosols from multiple sources of high vertical resolution measurements. Atmospheric Chemistry and Physics Discussions, European Geosciences Union, 2008, 8 (2), pp.7657-7702. �hal-00304113�
ACPD
8, 7657–7702, 2008A new database of trace gases and
aerosols B. Hassler et al. Title Page Abstract Introduction Conclusions References Tables Figures ◭ ◮ ◭ ◮ Back Close
Full Screen / Esc
Printer-friendly Version Interactive Discussion Atmos. Chem. Phys. Discuss., 8, 7657–7702, 2008
www.atmos-chem-phys-discuss.net/8/7657/2008/ © Author(s) 2008. This work is distributed under the Creative Commons Attribution 3.0 License.
Atmospheric Chemistry and Physics Discussions
Technical Note: A new global database of
trace gases and aerosols from multiple
sources of high vertical resolution
measurements
B. Hassler1, G. E. Bodeker2, and M. Dameris3
1
Meteorological Institute, University of Munich, Munich, Germany
2
National Institute of Water and Atmospheric Research, Lauder, New Zealand
3
Deutsches Zentrum f ¨ur Luft- und Raumfahrt, Institut f ¨ur Physik der Atmosph ¨are, Oberpfaffenhofen, Germany
Received: 20 February 2008 – Accepted: 25 March 2008 – Published: 18 April 2008 Correspondence to: B. Hassler ([email protected])
ACPD
8, 7657–7702, 2008A new database of trace gases and
aerosols B. Hassler et al. Title Page Abstract Introduction Conclusions References Tables Figures ◭ ◮ ◭ ◮ Back Close
Full Screen / Esc
Printer-friendly Version Interactive Discussion
Abstract
A new database of trace gases and aerosols with global coverage, derived from high vertical resolution profile measurements, has been assembled as a collection of bi-nary data files; hereafter referred to as the “Bibi-nary DataBase of Profiles” (BDBP). Ver-sion 1.0 of the BDBP, described here, includes measurements from different
satellite-5
(HALOE, POAM II and III, SAGE I and II) and ground-based measurement systems (ozonesondes). In addition to the primary product of ozone, secondary measurements of other trace gases, aerosol extinction, and temperature are included. All data are subjected to very strict quality control and for every measurement a percentage error on the measurement is included. To facilitate analyses, each measurement is added
10
to 3 different instances (3 different grids) of the database where measurements are indexed by: (1) geographic latitude, longitude, altitude (in 1 km steps) and time, (2) ge-ographic latitude, longitude, pressure (at levels ∼1 km apart) and time, (3) equivalent latitude, potential temperature (8 levels from 300 K to 650 K) and time.
In contrast to existing zonal mean databases, by including a wider range of
mea-15
surement sources (both satellite and ozonesondes), the BDBP is sufficiently dense to permit calculation of changes in ozone by latitude, longitude and altitude. In addition, by including other trace gases such as water vapour, this database can be used for comprehensive radiative transfer calculations. By providing the original measurements rather than derived monthly means, the BDBP is applicable to a wider range of
applica-20
tions than databases containing only monthly mean data. Monthly mean zonal mean ozone concentrations calculated from the BDBP are compared with the database of Randel and Wu, which has been used in many earlier analyses. As opposed to that database which is generated from regression model fits, the BDBP uses the original (quality controlled) measurements with no smoothing applied in any way and as a result
25
ACPD
8, 7657–7702, 2008A new database of trace gases and
aerosols B. Hassler et al. Title Page Abstract Introduction Conclusions References Tables Figures ◭ ◮ ◭ ◮ Back Close
Full Screen / Esc
Printer-friendly Version Interactive Discussion
1 Introduction
Ozone is a greenhouse gas and as such past and future changes in ozone drive changes in radiative forcing of the climate system. To incorporate these changes in radiative forcing by ozone, global climate models require ozone boundary conditions that span the atmosphere from the surface to the lower mesosphere (0–70 km), from
5
pole to pole, and at high vertical resolution, e.g. to resolve changes in ozone close to the tropopause where the effect on radiative forcing is largest (Forster and Shine,
1997). Furthermore, if zonal asymmetries in the ozone changes can be included, this results in a more accurate representation of changes in radiative forcing.
A vertically resolved ozone database with sufficient density to detect changes in
10
ozone as a function of latitude, longitude and altitude, is valuable for attributing past changes in ozone e.g. zonal asymmetry in ozone trends may be indicative of the influ-ence of changes in dynamics. Such a database is also valuable for the evaluation of chemistry-climate models and in particular for validating the ability of these models to reproduce the latitude-altitude structure in past ozone changes.
15
There are two commonly used vertical ozone profile databases currently available (Fortuin and Kelder,1998;Randel and Wu,2007). However, both report monthly mean zonal mean data only, with no longitudinal resolution. The BDBP is not a zonal mean database and individual measurement sets are archived. A measurement set is a group of measurements made at the same date, time, latitude, longitude, altitude and
20
from the same instrument. As a result, the BDBP can be used to extract ozone profiles for a specified location.
In Randel and Wu (2007) no changes in tropospheric ozone are reported and ozonesondes are used only from Syowa and Resolute. These ozonesonde measure-ments are used to infer changes in ozone poleward of 60◦ latitude. Because Syowa
25
(69◦S) is close to the Antarctic vortex edge, meridional movements of the vortex re-sult in Syowa ozonesondes sampling air from both inside and outside the vortex and therefore decreases in ozone over the Antarctic are likely underestimated.
ACPD
8, 7657–7702, 2008A new database of trace gases and
aerosols B. Hassler et al. Title Page Abstract Introduction Conclusions References Tables Figures ◭ ◮ ◭ ◮ Back Close
Full Screen / Esc
Printer-friendly Version Interactive Discussion
Fortuin and Kelder (1998) built their database using ozonesonde profiles from se-lected stations and SBUV-SBUV/2 measurements from 1980 to 1991, mainly to provide an ozone climatology for global climate model simulations. For the BDBP many more ozonesonde stations were available providing a greater degree of coverage. Further-more, longer periods of data were available for the ozonesonde stations, and therefore
5
a considerably longer time period for this database could be achieved. In addition, the high vertical resolution of the BDBP allows more detailed analyses of vertical ozone structures compared to the 19 pressure levels in the Fortuin and Kelder database.
The BDBP has been implemented in a flexible and extensible data file format struc-tured for rapid extraction of data. Three different instances of the database have been
10
created where measurements are indexed by: (1) geographic latitude, longitude, al-titude (in 1 km steps) and time, (2) geographic laal-titude, longitude, pressure (at levels ∼1 km apart) and time, (3) equivalent latitude (Butchart and Remsberg, 1986), po-tential temperature (8 levels from 300 K to 650 K) and time (see Sect. 2). A detailed description of the different data sources from which measurements have been added
15
to Version 1 of the BDBP is given in Sect.3. By including data from as many sources as possible, dense coverage of the globe, at high temporal resolution, is achieved. The spatial and temporal coverage of the database is quantified in Sect.4. Monthly mean 2◦zonal mean ozone concentrations were extracted from the BDBP and are compared with the data set of Randel and Wu (2007) in Sect. 5. Section 6 then shows some
20
examples from the BDBP of O3, NO2and H2O for one (or more) specified level(s) and
a defined latitude region. Finally, in Sect. 6, the advantages of the BDBP over other existing databases are highlighted and suggestions are made for possible applications of the BDBP.
2 Database structure
25
To facilitate analysis of the BDBP, three different instances of the database were as-sembled, each comprising a 3-dimensional data grid (Fig.1).
ACPD
8, 7657–7702, 2008A new database of trace gases and
aerosols B. Hassler et al. Title Page Abstract Introduction Conclusions References Tables Figures ◭ ◮ ◭ ◮ Back Close
Full Screen / Esc
Printer-friendly Version Interactive Discussion In all cases one of the dimensions is time. The other two dimensions are: in Grid I,
geographical latitude and altitude, in Grid II, geographical latitude and pressure, and in Grid III, equivalent latitude and potential temperature. The data are stored within the grids as “measurement sets”. A measurement set is a collection of measurements made at the same date and time, latitude, longitude, and altitude, from the same
instru-5
ment, which are stored together with the source of the measurement set (e.g. “SAGE2 V6.2”). Each grid contains the same source data but gridded in three different ways to provide different meridional slices of the database. For example, in Grid III, binning the data by equivalent latitude and potential temperature preserves the steep meridional gradients in any zonal means calculated from the database, e.g. close to the vortex
10
edge. In the other two grids these would be smeared out as a consequence of averag-ing data inside and outside the vortex on lines of constant latitude. For each grid, the data are stored in 90 files, each of which span 2◦in geographic latitude or, for Grid III, 2◦ of equivalent latitude, for convenience. Grid I has 70 altitude levels extending from 1 km to 70 km in 1 km steps, and the measurements have been interpolated to these levels
15
(as discussed further below). Grid II has 70 pressure levels spaced approximately 1 km apart given by:
pn= p0e
−n/7, n = 1..70 (1)
wherep0=1013.25 hPa.
The pressure levels are exactly 1 km apart when the scale height (RT /g) is 7 km
20
(R=286.9 N m kg−1K−1,g=9.8 m s−1). Grid III has 8 potential temperature levels at 300, 315, 330, 350, 400, 450, 550, and 650 K matching the standard output levels of the NCEP/NCAR potential temperature database (http://dss.ucar.edu/datasets/ds090.0/). The lowest levels of 270, 280, and 290 K were excluded because these levels intersect the Earth’s surface and confound the calculation of equivalent latitude. Meridional
25
profiles of potential vorticity (PV) by equivalent latitude (see Fig. 1a of Nash et al.,
1996) were calculated from NCEP/NCAR reanalyses (Kistler et al.,2001) every 6 h on the 8 isentropic levels listed above. The equivalent latitude for a given measurement set
ACPD
8, 7657–7702, 2008A new database of trace gases and
aerosols B. Hassler et al. Title Page Abstract Introduction Conclusions References Tables Figures ◭ ◮ ◭ ◮ Back Close
Full Screen / Esc
Printer-friendly Version Interactive Discussion on a given isentropic level is calculated by taking the PV at the measurement latitude
and longitude, and, using the meridional profile of PV vs. equivalent latitude at the nearest 6 h mark, the equivalent latitude is linearly interpolated using the PV value. Grid III in version 1.0 of the BDBP has no data before 1978 since equivalent latitudes before 1978 were not available.
5
Each measurement comprises a value, an error in percent, and a data descriptor (e.g. “Ozone”). The length of each measurement set varies according to the number of measurements available. In this way, the grids are kept compact since no null values need to be stored. If the source data are in the form of vertical profiles, values are interpolated onto the pre-defined vertical levels with the result that the profile is no
10
longer kept as a single entity within the grid. Each measurement set has its own unique time stamp and therefore the measurement sets at a given altitude and latitude bin need not be equally spaced in time (see Fig.1).
The two primary target variables for this version of the BDBP are ozone and tem-perature and the data sources used have been selected to optimize the spatial and
15
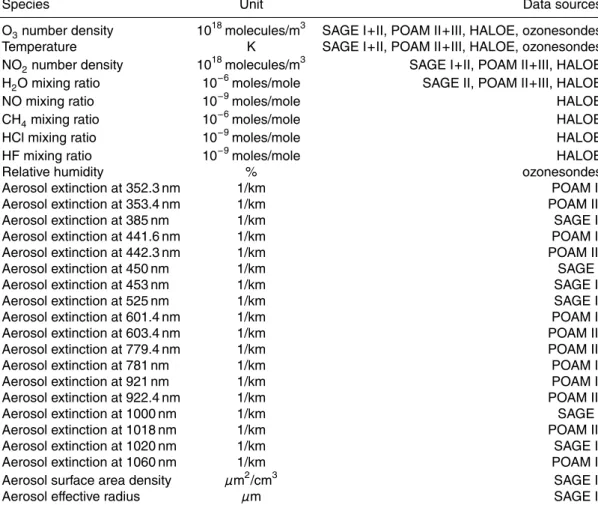
temporal coverage for these variables. Where other coincident measurements (e.g. NO2or H2O) are available from the data sources, these have been added to the grids. The variables included in the BDBP, together with their data sources, are listed in Ta-ble1.
3 Data sources
20
Criteria for the selection of source data for this version of the BDBP were:
1. Only profile data are considered and only profiles with high vertical resolution (i.e. better than ∼1.5 km). Two data sources fulfilling these criteria are solar occultation satellite-based instruments and ozonesondes. Lidar and aircraft profile measure-ments would also have been suitable but were not included in this version of the
25
ACPD
8, 7657–7702, 2008A new database of trace gases and
aerosols B. Hassler et al. Title Page Abstract Introduction Conclusions References Tables Figures ◭ ◮ ◭ ◮ Back Close
Full Screen / Esc
Printer-friendly Version Interactive Discussion to permit the data to be included in Grids II and III and these were not always
available. Furthermore, these data sources would not have added significant quantities of data to the BDBP.
2. All measurements must include an indication of measurement precision and the measurement errors should preferably be small.
5
3. Source data spanning longer periods were given higher priority.
4. Measurements covering a data sparse region of the globe were given high priority. These criteria led to the use of HALOE, SAGE I, SAGE II, POAM II, POAM III and ozonesondes as data sources for this version of the BDBP. The specifics concerning the addition of each of these data sources are given in Sects.3.1to3.4.
10
3.1 SAGE I and II
3.1.1 SAGE I and II instrument and data information
Both Stratospheric Aerosol and Gas Experiment (SAGE) instruments were built and launched by NASA (see for example McCormick et al., 1989; Cunnold et al., 1989;
Nazaryan and McCormick, 2005; Liu et al., 2006). Version 6.1 SAGE I data were
15
provided by L. W. Thomason (NASA; personal communication). The SAGE I measure-ments start in February 1979 and stop in November 1981 spanning 79◦S to 79◦N.
Version 6.2 SAGE II data were used (Wang et al., 2006,
http://eosweb.larc.nasa.gov/project/sage2/table sage2.html) which started in Oc-tober 1984 and ended in August 2005. The spatial coverage spans 80◦S to 80◦N (see
20
Table2), although coverage can be sparse at higher latitudes depending on season (Wang et al.,2002).
Measurement errors for SAGE I and SAGE II, included in the BDBP, are given in the source data files and are calculated by accounting for all known sources of uncertainty in the measurement. For both SAGE I and II the temperature and pressure values
ACPD
8, 7657–7702, 2008A new database of trace gases and
aerosols B. Hassler et al. Title Page Abstract Introduction Conclusions References Tables Figures ◭ ◮ ◭ ◮ Back Close
Full Screen / Esc
Printer-friendly Version Interactive Discussion included in the data files were not retrieved parameters, but were provided by the
Na-tional Meteorological Center (NMC). Nevertheless they were used to determine the levels at which the data were inserted into Grid II and Grid III, and were also included as measurements within each measurement set.
Since both SAGE I and SAGE II measure trace gas profiles with the solar
occulta-5
tion method, an additional identifier specifying whether the measurement was made at sunrise or sunset was included in each SAGE measurement set.
3.1.2 Altitude correction for SAGE I data
There is a known altitude error in SAGE I observations (Veiga et al.,1995).Wang et al.
(1996) discuss and analyse this error in detail. To correct for this error in the SAGE I
10
data, an altitude correction based on Fig. 3 ofWang et al.(1996) was performed. Alti-tudes for every profile measured between 60◦N and 60◦S were shifted upwards by an offset dependent on latitude but independent on altitude i.e. the measured profiles are shifted rigidly upwards. AlthoughWang et al.(1996) only discuss the altitude error for ozone profiles, the correction was applied to all measurements. Pressure and
temper-15
ature values were assumed to be correct since they were provided from NMC directly (Wang et al.,1996) and therefore the pressure profiles were not shifted.
3.1.3 Screening of SAGE I data
There are few publications, if any, that describe how best to screen SAGE I data to remove outliers. Therefore, in this analysis, data quality controls, similar to those
per-20
formed for the SAGE II data (described below), were applied to remove outliers from the O3 and NO2 data. Particularly below 15 km, measurements of O3 and NO2 can be affected by aerosols. Therefore, measurements of O3 and NO2 were removed if
the aerosol extinction at 1000 nm was higher than 0.001/km (L.W. Thomason, NASA, personal communication). Nevertheless, the utility of the SAGE I data below 15 km
25
ACPD
8, 7657–7702, 2008A new database of trace gases and
aerosols B. Hassler et al. Title Page Abstract Introduction Conclusions References Tables Figures ◭ ◮ ◭ ◮ Back Close
Full Screen / Esc
Printer-friendly Version Interactive Discussion regions of enhanced upper tropospheric ozone). These data are retained in the BDBP
with their high error values to allow later screening. 3.1.4 Screening of SAGE II data
Rind et al. (2005) showed that O3, NO2 and H2O measurements from SAGE II are
affected by interference from aerosols and clouds. Since the original SAGE II data
5
are only available in an unscreened version (although they are provided with quality flags for unreliable data) additional treatment of the data was necessary to ensure the highest possible quality. The screening was performed following the suggestions of
Wang et al.(1996) andRind et al.(2005). Data points or whole profiles were removed if the following checks were true:
10
For O3specifically:
– From the time when the beta angle of the spacecraft (the angle between the
satellite orbit plane and the Earth to Sun vector) exceeds 60◦ until it returns to less than 40◦all profiles are excluded.
– All measurements below 23 km from July 1991 to October 1993 are excluded to
15
avoid the confounding effects of the Mt. Pinatubo eruption.
– Measurements between 23 June 1993 and 11 April 1994, between 30 km and
50 km are excluded whenever the quoted measurement error exceeds 10%.
– Measurements between 10.5 km and 24.5 km are excluded if the ozone mixing
ratio exceeds 10 ppm.
20
– Measurements above 25 km are excluded if values are>100 ppm.
– Measurements at altitudes above 3 hPa are excluded if values are>50 ppm.
– Measurements in the mid- to upper troposphere are excluded when clouds are
present as denoted by the cloud quality flags in the data files. For NO2specifically:
25
– If the 1020 nm aerosol absorption is greater than 7×10⁻⁴km−1the measurement is excluded.
ACPD
8, 7657–7702, 2008A new database of trace gases and
aerosols B. Hassler et al. Title Page Abstract Introduction Conclusions References Tables Figures ◭ ◮ ◭ ◮ Back Close
Full Screen / Esc
Printer-friendly Version Interactive Discussion For H2O specifically:
– If the relative humidity exceeds 100% or is less than 0% the measurement is
excluded.
– If clouds are present anywhere between 6 and 25.5 km (as denoted by the cloud
identifier flags) the water vapour measurement at the altitude of the flagged clouds
5
is omitted.
– Above the tropopause, if the aerosol absorption at 1020 nm exceeds 4×10⁻⁴km−1 the water vapour measurement is excluded.
– If the optical depth at 1020 nm is large (as denoted by the quality flags) the
mea-surement is excluded.
10
– If the H2O slow convergence flag is set, the measurement is excluded.
For all aerosol extinction measurements:
– If the “T-C inversion routine failure for the screened aerosol extinction retrieval” is
set, the measurement is excluded.
– If the “cloud test not successful” flag is set, the measurement is excluded.
15
Furthermore:
– For NO2and H2O, all measurements between 23 June 1993 and 10 April 1994,
at altitudes above 30 hPa are excluded.
– For NO2 and H2O, all measurements in November 1991, September 1992 and October 1992 at altitude below 150 hPa are excluded.
20
– For O3 and H2O, all measurements in the first 6 km are removed when there is
large absorption (integrated value above that level bigger than about 5%) in the 1020 nm channel.
– For O3, NO2 and H2O, if the measurement is more than 10σ away from the
monthly mean value for that latitude (15◦ zones), longitude (90◦ quadrants) and
25
ACPD
8, 7657–7702, 2008A new database of trace gases and
aerosols B. Hassler et al. Title Page Abstract Introduction Conclusions References Tables Figures ◭ ◮ ◭ ◮ Back Close
Full Screen / Esc
Printer-friendly Version Interactive Discussion The climatology and statistics needed to perform the last test were calculated
sepa-rately for each of the 3 species as area weighted means from the unscreened SAGE II data.
3.2 HALOE
The Halogen Occultation Experiment (HALOE) was launched in September 1991 as a
5
NASA project. Measurements are available from October 1991 until November 2005 in the latest Version 19. HALOE uses solar occultation to simultaneously measure, amongst others, vertical profiles of O3, HCl, HF, CH4, H2O, NO, NO2and temperature
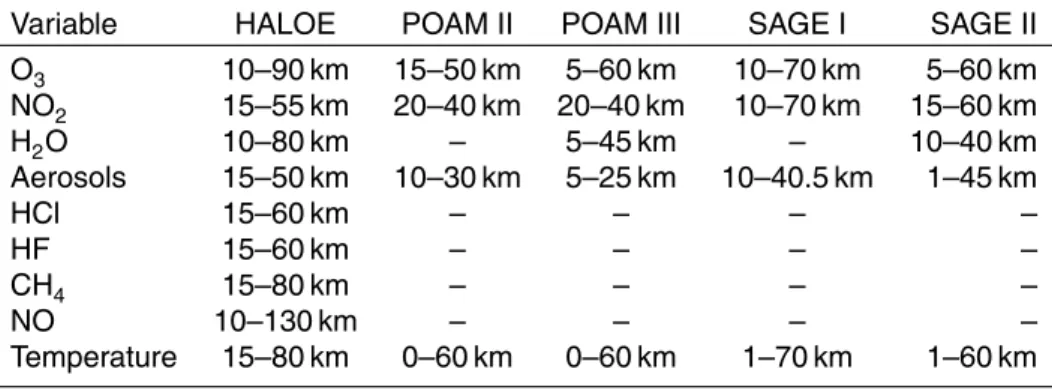
which are added to the BDBP. The altitude range of the measurements extends from ∼15 km to 60–130 km, depending on the species (see Table3). Although the vertical
10
resolution of the profiles is ∼1.6 km, the data were included in the BDBP since these measurements provide good global coverage and have been used in numerous pre-vious studies (McKenna et al.,2002;Steil et al.,2003;Remsberg and Deaver,2005). For every measurement a measurement error is also provided in the source data files and these are added to the BDBP. A sunrise/sunset identifier is also included in each
15
measurement set. HALOE data are already screened for cirrus cloud contamination, described inHervig and McHugh(1999), and therefore no additional screening of the data was done. A detailed analysis of the HALOE ozone data quality (Version 18) is presented inBhatt et al. (1999). For a more detailed HALOE data description see
Russell et al.(1993).
20
3.3 POAM II and III
The Polar Ozone and Aerosol Measurement II (POAM II) instrument was developed by the Naval Research Laboratory (NRL) to measure the vertical distribution of atmo-spheric O3, H2O, NO2, aerosol extinction, and temperature. It covers a spectral range
from approximately 350 to 1060 nm in nine channels. The latest available version is
25
ACPD
8, 7657–7702, 2008A new database of trace gases and
aerosols B. Hassler et al. Title Page Abstract Introduction Conclusions References Tables Figures ◭ ◮ ◭ ◮ Back Close
Full Screen / Esc
Printer-friendly Version Interactive Discussion were made between 55◦and 71◦N and between 63◦and 88◦S with a vertical resolution
of ∼1 km. The profiles of the different measured species cover an altitude range from 10 km to 50 km (see Table3). For a more detailed description of the POAM II instrument and the retrievals seeGlaccum et al.(1996) andLumpe et al.(1997), respectively.
POAM III was launched after the satellite on which POAM II was located failed. It
5
started measurements in April 1998 and ended in November 2005. Version 4 is the latest available dataset for POAM III. In this version, quality flags for the profiles of O3, H2O and NO2were included to allow screening of lower quality measurements resulting
from sunspot activity and aerosol artifacts (Lumpe et al.,2006). Beside these additions, POAM III data sets contain the same species as POAM II, with the measuring channels
10
for the aerosol extinctions slightly shifted (see Table1). The vertical resolution is also ∼1 km (Randall et al., 2003), and the measurements were made in almost identical latitude bands (from 54◦–71◦N and 62◦–88◦S). The altitude range is slightly bigger for POAM III than for POAM II (see Table 3). For a more detailed description of the POAM III instrument and its retrieval algorithms seeLucke et al.(1999) andLumpe et
15
al. (2002), respectively.
Since temperature and pressure are not directly measured with the POAM instru-ments, both variables are taken from reanalyses either from the UK Met Office (UKMO) or the National Centers for Environmental Prediction (NCEP) and are included in the database. For sorting POAM II and POAM III in Grid II (latitude/pressure) and Grid III
20
(equivalent latitude/potential temperature), the pressure and temperature values from NCEP were used. A sunrise/sunset identifier is also included in each measurement set. Error values are available for both POAM II and POAM III from the original data files and could therefore be added to the database.
ACPD
8, 7657–7702, 2008A new database of trace gases and
aerosols B. Hassler et al. Title Page Abstract Introduction Conclusions References Tables Figures ◭ ◮ ◭ ◮ Back Close
Full Screen / Esc
Printer-friendly Version Interactive Discussion 3.4 Ozonesonde data
3.4.1 Ozonesonde data selection
Ozonesondes are balloon-borne instruments that measure in situ ozone with a wet-chemical method: ambient air is pumped through an electrolytic cell containing a buffered potassium iodide solution where ozone oxidizes the iodide into iodine. The
5
resultant current within the cell is directly proportional to the ozone concentration in the cell. There are several different ozonesonde types in use globally, with the most common being the electrochemical concentration cell (ECC) (Komhyr,1969), the Brewer-Mast (BM) bubbler (Brewer and Milford,1960) and the carbon-iodine (CI) sonde (Komhyr, 1965). All ozonesondes are flown together with a radiosonde to measure
10
pressure, temperature and relative humidity.
Many studies analysing the suitability of ozonesonde measurements for long-term ozone trend detection have been published (Tiao et al.,1986; Bodeker et al.,1998;
Logan et al., 1999). Although the quality of the ozonesonde data depends on the sonde preparation, the experience of the measuring team and some sources of error
15
particular to each instrument, the measurement uncertainties are generally small and can be quantified. The ozonesonde measurements are also the only data included in this version of the BDBP that provide coverage in the troposphere. The ozonesonde data were subjected to thorough quality checks (described below) before being added to the BDBP.
20
Seven different sources for ozonesonde data were used for the database: 1. WOUDC Data DVD “Ozone Data for the world, ODW DVD#1, 1926–2005”, 2. WOUDC database webpage for the most recent data not provided on the DVD
(http://www.woudc.org/data e.html),
3. NOAA webpage, mainly for data from US stations (ftp://ftp.cmdl.noaa.gov/ozwv/
25
ozone/),
ACPD
8, 7657–7702, 2008A new database of trace gases and
aerosols B. Hassler et al. Title Page Abstract Introduction Conclusions References Tables Figures ◭ ◮ ◭ ◮ Back Close
Full Screen / Esc
Printer-friendly Version Interactive Discussion that submit data to both but in a more timely fashion to the NDACC (http://www.
ndsc.ncep.noaa.gov/data/).
5. SHADOZ webpage, for equatorial stations not submitting their data to the WOUDC (http://croc.gsfc.nasa.gov/shadoz/).
6. Directly from the Lauder archive of ozonesonde flights,
5
7. Private communications with H. Claude from Hohenpeissenberg and R. Kivi from Sodankyla to get source profiles from those stations.
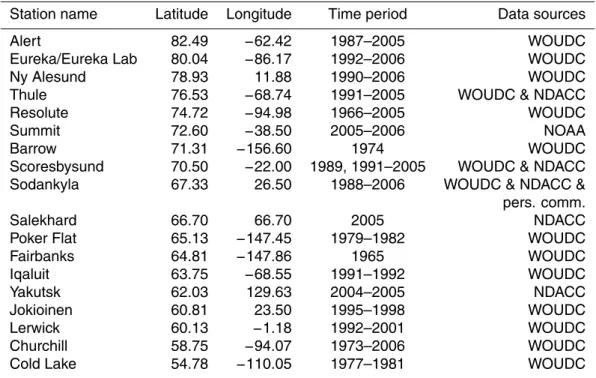
In total, profiles from 136 stations were added to the BDBP spanning 82◦N to 90◦S (see TableA1). As long as the sonde type was detailed in the original data file, that sounding was rated as a potential candidate to be added to the database after passing
10
several quality checks which are described below. Soundings from the following sonde types were accepted: Brewer-Mast, Brewer-GDR (Ronnebeck and Sonntag, 1976), ECC, Carbon-Iodine, Indian (Shreedharan, 1968) and Regener. Where the altitude and/or time after launch was not available in the original data file, or when the values were unrealistic (e.g. a time after launch of 3 h for the first data level), these were
15
(re)calculated from the pressure and temperature measurements assuming a mean ascent rate of 6 m/s.
Normalization factors (NFs) are calculated by dividing a total column ozone value de-rived from the ozonesonde ozone profile by an independent total column ozone mea-surement available either from a coincident ground-based (Dobson or Brewer
spec-20
trophotometer) or satellite-based column ozone measurement. For the ozonesonde flights added to the BDBP, new NFs were calculated as follow. First the ozone column from the surface to the top of the ozonesonde flight was calculated using trapezoidal integration. Then the missing ozone between the top of the flight and the top of the atmosphere was added using the climatology of McPeters et al. (2007). Added
to-25
gether these provide the total column ozone estimate from the ozonesonde flight. The independent total column ozone value was extracted from the NIWA combined total column ozone database (M ¨uller et al.,2007) according to the date, time and location of the ozonesonde flight. Because this combined total column ozone database is
avail-ACPD
8, 7657–7702, 2008A new database of trace gases and
aerosols B. Hassler et al. Title Page Abstract Introduction Conclusions References Tables Figures ◭ ◮ ◭ ◮ Back Close
Full Screen / Esc
Printer-friendly Version Interactive Discussion able only from November 1978 onwards, new NFs could not be calculated for flights
prior to that date. For flights not reaching 30 hPa the uncertainty on the partial col-umn above the top of the flight is large and a reliable new NF could not be calculated. Therefore flights not reaching 30 hPa were rejected. Both the original NFs listed in the data files (if available), and the new NFs, are considered for quality checks. If both NFs
5
are available, the original NF must be between 0.9 and 1.1 and the new NF must be between 0.8 and 1.2. If only one NF is available then only the check appropriate for that NF is performed. If neither NF is available the profile is not added to the BDBP.
Each ozonesonde measurement set includes the original NF, or the new NF if the original is not available, so that users of the ozonesonde data in the BDBP can choose
10
whether or not to apply the NF to the ozone measurements. While the NF is stored in the BDBP it was not applied to the ozonesonde data.
Since the measurements in the BDBP are stored at specific altitude/pressure/theta levels, the values for those levels extracted from the ozonesonde profiles must be in-terpolated. For an interpolated value to be added to the database at least one
mea-15
surement must be within 200 m of the respective level.
The period for which data are available differs from station to station. Flights started in the early 1960s at a few stations distributed globally. At many stations flights were done just for a few years, while other stations have measurements only during some months or during campaigns, and some stations have a continuous time series of
20
ozone profiles up until the present. In the late 1990s, new ozonesonde stations were chosen to cover regions poorly represented at that time, specifically over the equa-tor and Southern Hemisphere (Thompson et al., 2003). Combining all 7 mentioned ozonesonde data sources, flights from the early 1960s to 2006 were added to the BDBP as long as profiles were available and of suitable quality.
25
3.4.2 Ozonesonde data errors
The ozonesonde data files obtained through the sources detailed above for the most part do not include the measurement errors associated with each measurement,
nei-ACPD
8, 7657–7702, 2008A new database of trace gases and
aerosols B. Hassler et al. Title Page Abstract Introduction Conclusions References Tables Figures ◭ ◮ ◭ ◮ Back Close
Full Screen / Esc
Printer-friendly Version Interactive Discussion ther for ozone, temperature, relative humidity nor pressure. To estimate the error on
the ozone measurement, information about sonde type quality and measurement er-rors were obtained fromSmit and Kley(1996) unless otherwise specified (see below). According to their suggested classification of sonde type and altitude range different ozone error values were applied (see Fig.2). In addition:
5
– ECC ozonesondes: error values were taken fromKomhyr et al.(1985). For Lauder the error profiles for ECC ozonesondes of the 4A and 5A series described by
Bodeker et al.(1998) were applied.
– Regener ozonesondes: those sondes were not tested in the analysis of Smit
and Kley (1996), but it is known that the errors of those sondes tend to be
10
quite high (WMO,1989), so relatively high error values, commensurate with other ozonesonde types with high errors, were assumed.
Error values for temperature, pressure and relative humidity for the soundings were set as follows:
– Temperature: error values for the sonde temperature measurements are set
ac-15
cording toBodeker et al.(1998). Different error values for unshaded and shaded temperature sensors are prescribed. For most soundings information about the shading of the temperature sensor is not available (the exception being Lauder) so error values for unshaded sensors are used.
– Pressure: depending on the station, different pressure error values are assumed.
20
Since more detailed information about the soundings at Lauder are available, the pressure error value for that station was calculated from a large data set of calibrated pressure sensors and found to be 0.258 hPa. For all other stations error values were assumed to be ∼1 hPa up to a height of 100 hPa, and ∼0.5 hPa from a measurement height higher than 100 hPa, according to personal communication
25
with Vaisala about pressure errors for radiosonde measurements.
– Relative humidity: for all stations and all altitudes an error value of 3% for the
ACPD
8, 7657–7702, 2008A new database of trace gases and
aerosols B. Hassler et al. Title Page Abstract Introduction Conclusions References Tables Figures ◭ ◮ ◭ ◮ Back Close
Full Screen / Esc
Printer-friendly Version Interactive Discussion with Vaisala about humidity errors for radiosonde measurements.
It is not always Vaisala radiosondes that are flown with each ozonesonde at every station and the type of radiosonde used is seldom logged in the original ozonesonde data files. However, since Vaisala radiosondes are the most commonly used sondes, for all sonde data added to the BDBP the error values for pressure and relative humidity
5
are set to the Vaisala radiosonde errors. 3.4.3 Quality check
In addition to the error checks described above, several further checks were made to screen and remove poor quality data from the ozonesonde data files, viz.:
– Individual ozone records are rejected when negative ozone partial pressures,
10
0.0 mPa ozone partial pressures within 60◦ of the equator, or ozone partial pres-sure ≥25 mPa at altitudes above 30 hPa are meapres-sured.
– Entire ozone profiles are rejected when unrealistically low ozone values over the
whole profile (profile mean <2 mPa and profile maximum <4 mPa) are found or when more than 33% of all ozone values in the profile are 0.0 mPa.
15
– Individual temperature records are rejected when values in the troposphere
>60◦C or in the case of extreme spikes in stratospheric temperature (for one or two consecutive values). The spikes were defined in two different ways accord-ing to the resolution of the checked profile. Profiles with more than 10 values per kilometre were categorised as “high-resolution” profiles. For those the mean
20
temperature and standard deviation for every km-layer was calculated and data values were rejected if they exceeded the range of mean temperature ±30 stan-dard deviations. Temperature spikes for “low-resolution” profiles were defined by exceeding a maximum lapse rate. In the troposphere data values were rejected if the lapse rate was higher than 0.06 K/m, for the stratosphere the maximum lapse
25
ACPD
8, 7657–7702, 2008A new database of trace gases and
aerosols B. Hassler et al. Title Page Abstract Introduction Conclusions References Tables Figures ◭ ◮ ◭ ◮ Back Close
Full Screen / Esc
Printer-friendly Version Interactive Discussion
– When two identical records at the same pressure/altitude level (not defined as
ascending and descending values) are found, one is rejected.
No relative humidity values above the tropopause (as assumed for the application of the error values – see above) were added to the database since errors in humidity mea-surements from radiosondes are known to increase with decreasing water vapour
con-5
tent, temperature and pressure (Elliott and Gaffen,1991). Stratospheric humidity data from radiosondes are therefore thought to be of no big use (SPARC,2000). Although
Miloshevich et al.(2001) worked out a correction for relative humidity measurements for Vaisala RS80-A radiosondes, no further quality improvements were performed to the sonde humidity data in the database since in most cases the radiosonde type was
10
not known.
4 Database temporal, latitudinal and longitudinal coverage
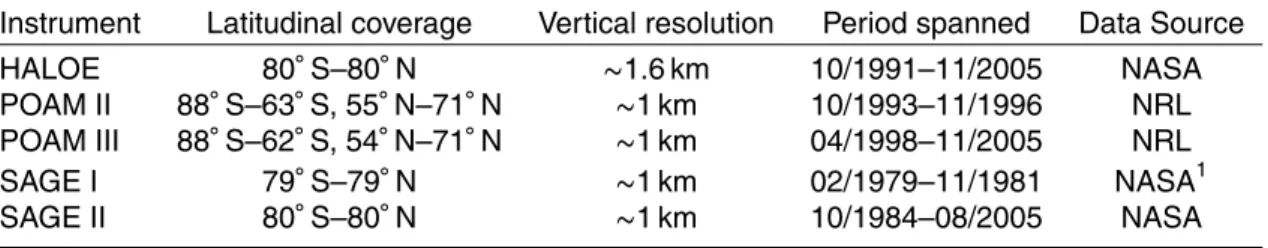
By combining measurements from several satellite-based instruments and from ozonesondes it is possible to achieve high temporal and spatial coverage in the BDBP. Table2 summarizes the temporal coverage of the satellites and these, together with
15
the ozonesondes, are shown graphically in Fig.3. Note that although the ozonesonde data cover a long time period, the spatial coverage can be poor due to the number and location of the ozonesonde stations. In this version of the BDBP, for 2006, only ozonesonde data are available, and so the spatial coverage for 2006 is poorer than for the preceding years.
20
To quantify the spatial and temporal coverage of the BDBP for a given altitude-/pressure/isentropic level, we have defined factors (hereafter referred to as B-factors) that combine the temporal and spatial coverage into one value. For a given level, a spatial grid is selected (e.g. 2◦latitude by 5◦longitude) and monthly means within each grid cell are calculated (described further in Sect.5) over some selected time period.
25
ACPD
8, 7657–7702, 2008A new database of trace gases and
aerosols B. Hassler et al. Title Page Abstract Introduction Conclusions References Tables Figures ◭ ◮ ◭ ◮ Back Close
Full Screen / Esc
Printer-friendly Version Interactive Discussion least N% of the months in the selected time period. The B-Factor does not indicate
which part of the globe is not sampled nor which periods within the total period are not covered. Figure4shows B-factors for a resolution of 2◦latitude by 5◦longitude for O3
as a function of changing time period (panel a) and changing data source (panel b) as well as NO2and H2O for changing time period (panels c and d, respectively).
5
As mentioned earlier, one selection criteria for the BDBP data sources was the goal of high temporal and spatial coverage for ozone and temperature. It can be seen in Fig.4that ozone has the highest B-factors for all three shown species, exceeding 80% between ∼10 km and ∼30 km even at a high resolution of 2◦by 5◦. For O3, the periods
with a late start year have higher B-factors as a result of sparser coverage early in the
10
period (see Fig.3). B-factors for temperature are even slightly higher than those for O3 but are not shown here. Above 60 km coverage of ozone decreases rapidly.
In panel (b) of Fig.4the effects of the cumulative addition of different data sources on the temporal and spatial coverage of the BDBP are shown. First the effects of adding SAGE II data are shown, followed, in order, by SAGE I, HALOE, POAM II, POAM III and
15
finally ozonesondes. Even though the addition of POAM III data extends the temporal coverage of the BDBP, the B-factors do not change with the addition of the POAM III data because it does not extend the spatial coverage. Clearly, at a resolution of 2◦ by 5◦, the inclusion of the ozonesondes is vital to achieve B-factors above 80% in the stratosphere and any coverage at all in the lower troposphere.
20
NO2coverage does not reach the 80% mark although it is close in the altitude range
∼15 km to ∼45 km (see Fig.4c). Only very sparse data are available at altitude levels above ∼45 km and below ∼15 km.
Of the 3 species shown, H2O is the only one with almost constant B-factors
through-out the stratosphere and lower mesosphere (Fig.4d), from ∼15 km up to 70 km. While
25
relative humidity from the ozonesonde flights is added to the BDBP in the troposphere, these measurements are excluded from panel (d) of Fig. 4 since only water vapour measurements are considered. However, B-factors are significantly lower (maximum at around 40%) than for the other species caused by the low number of satellite
instru-ACPD
8, 7657–7702, 2008A new database of trace gases and
aerosols B. Hassler et al. Title Page Abstract Introduction Conclusions References Tables Figures ◭ ◮ ◭ ◮ Back Close
Full Screen / Esc
Printer-friendly Version Interactive Discussion ments that were added to the BDBP providing H2O data (see Table3).
5 Comparison with Randel and Wu database
An often used and well established database for ozone trend analyses and calculations of changes in radiative forcing by ozone is that fromRandel and Wu(2007), hereafter referred to as R&W. In this section, monthly means of ozone at selected altitudes and
5
latitudes calculated from the BDBP are compared with R&W. As mentioned in Sect.1, R&W consists of monthly mean zonal mean ozone and is based mainly on SAGE I and SAGE II data, with ozonesonde profiles from Syowa and Resolute providing high latitude coverage.
Figure 5 compares monthly mean times series from the BDBP and R&W at the
10
equator and 25 km altitude. The monthly means for the BDBP and for SAGE I+SAGE II were calculated over the same latitude band as in R&W, but with the requirement that there had to be at least 6 values available at the given latitude and altitude for the monthly mean to be valid. For both the BDBP and SAGE I+SAGE II, of the individual values available for the calculation of the monthly means, the highest and lowest 25%
15
were discarded to ensure that extreme values were not included. This rather simple method of rejecting extreme values is sufficient for this exercise; more sophisticated methods are in development for a 3-D (latitude, altitude, time) monthly mean ozone database that will be created from the BDBP.
Even though R&W are based on SAGE I and SAGE II only in this part of the
atmo-20
sphere, there are no missing values since the values provided by R&W are not the raw monthly means, but the values from a regression model fit to the raw monthly means (W. Randel personal communication). Also apparent in panel (a) of Fig.5is an offset between BDBP and R&W with BDBP monthly means being higher. The source of this offset is highlighted in panel (b); R&W add monthly mean anomalies to the climatology
25
ofFortuin and Kelder(1998) whereas the BDBP simply provides the original means of the raw data. If the anomaly time series alone are compared (Fig.5c) it is clear that the
ACPD
8, 7657–7702, 2008A new database of trace gases and
aerosols B. Hassler et al. Title Page Abstract Introduction Conclusions References Tables Figures ◭ ◮ ◭ ◮ Back Close
Full Screen / Esc
Printer-friendly Version Interactive Discussion agreement between the BDBP and R&W is excellent. It is also clear that R&W does
not capture some of the outliers in the BDBP (e.g. November 1984) because R&W is the regression model fit and not the raw monthly mean data.
Figure 6 shows another comparison between the BDBP and R&W where ozone anomalies were calculated by subtracting the mean annual cycle from monthly mean
5
time series, for altitudes between 1 km and 70 km and for the latitude zone from 40◦N to 50◦N.
The mean annual cycles (right hand panels in Fig. 6) compare well. The BDBP covers a greater altitude range than R&W providing data between 50 and 70 km and, more importantly, good coverage in the troposphere. With a latitude band of 10◦ the
10
number of missing monthly means calculated using the BDBP is small; the gap in the earlier 1980s above ∼33 km is between SAGE I and SAGE II (ozonesondes provide data at lower altitudes). Anomalies (left hand panels in Fig.6) of the same sign are found during similar periods and at similar altitudes. However, the BDBP anomalies have greater vertical scale, extending down to ∼10 km altitude whereas those of R&W
15
are suppressed below 20 km. The anomalies calculated using the BDBP show greater temporal variability and larger amplitudes than R&W. This is because R&W is based on regression model output and regression models cannot capture all of the variabil-ity. Because the regression model used by R&W does not include a basis function to describe the effects of volcanic eruptions on ozone, negative ozone anomalies in the
20
lower stratosphere related to the Pinatubo eruption in the early 1990s are significantly more apparent in the BDBP than in R&W. There is a discontinuity in the BDBP anoma-lies at ∼5 km altitude. This is an artifact of the monthly mean calculations using the BDBP where satellite data are not available for the monthly means at one altitude but are at the next higher altitude. Data from all of the added satellite instruments (see
25
Sect.3) have large error values in the troposphere for all measured species due to the tropospheric aerosol loading. It is suggested in various studies not to use these data for quantitative analyses (see for exampleKar et al.,2002). For the purposes of this preliminary comparison with R&W, the approach used to calculate the monthly means
ACPD
8, 7657–7702, 2008A new database of trace gases and
aerosols B. Hassler et al. Title Page Abstract Introduction Conclusions References Tables Figures ◭ ◮ ◭ ◮ Back Close
Full Screen / Esc
Printer-friendly Version Interactive Discussion is adequate. However, for a more accurate monthly mean database, weighting of the
measurements used in each mean with their errors should be incorporated.
6 Summary and Outlook
The material presented above outlines the construction of a new global database of trace gases and aerosols from multiple sources of high vertical resolution
measure-5
ments. The first version of this database, referred to as BDBP version 1.0, includes measurements from several solar occultation satellite instruments (SAGE I and II, POAM II and III, HALOE) and from ozonesonde flights from over 130 stations glob-ally, covering the period 1962 to 2006. It is planned to update the database annually to include the newest ozonesonde data, add historical data sources that have not yet
10
been included (e.g. ILAS and GOMOS, and more ground-based measurements, for ex-ample lidar data), add measurements from new satellite-based instruments currently in development, and possibly newer versions of the data already in the database (e.g. from the application of improved satellite retrieval algorithms).
The internal construction of the database allows for considerable flexibility:
15
– Where measurements are available at high temporal resolution, e.g. during an
intensive ozonesonde campaign, the resolution of the original data is maintained.
– Measurement sets can include any number of individual measurements taken by
the same instrument at that latitude, longitude, altitude and time and this can vary between data sources or within a data source.
20
– The database has a single common format so that utilities to extract subsets of
data from the BDBP are easy to write and quick to execute.
– The database consist of three different grids but the structure of the measurement
sets is the same for all three grids which simplifies data handling.
– The construction of the database allows for new, as yet undefined, species, or
25
measurements from new instruments, to be added without revision of the existing database – the measurement sets from the new instruments, possibly including newly defined species, are interleaved amongst the existing measurement sets.
ACPD
8, 7657–7702, 2008A new database of trace gases and
aerosols B. Hassler et al. Title Page Abstract Introduction Conclusions References Tables Figures ◭ ◮ ◭ ◮ Back Close
Full Screen / Esc
Printer-friendly Version Interactive Discussion
– Measurement sets for a latitude and altitude are sorted by time which speeds up
navigation and searching within the BDBP.
– Although the original trace gas profiles are not included in the BDBP as one
co-herent unit but are stored on pre-defined levels, profiles can easily be extracted from the BDBP, if required, since the vertical resolution is high (about 1 km for
5
Grid I and Grid II).
This flexibility allows for multiple applications:
– Because temporal means are not calculated, trace gas profiles at a specific
lo-cation and time, if available, can be extracted for studies requiring point source data.
10
– Case studies with data from only one data source, or a combination of data
sources, can be made.
– Since a longitude value is stored with each measurement set, analyses requiring
longitudinal disaggregation can be undertaken.
– The temporal and spatial coverage of the BDBP is sufficient to provide data for
15
statistically significant trend analyses.
– It is possible to bin the data from the BDBP in several different spatial and
tem-poral resolutions, as required for analyses (e.g. monthly means, seasonal means, yearly means, etc.), since data in the BDBP are stored with the information of the exact measurement time, latitude and longitude.
20
– The combination of data sources in the BDBP provides a robust basis for
clima-tology calculations which can be used to validate chemistry-climate models.
– Since the BDBP covers a long time period, climatologies calculated from the
ACPD
8, 7657–7702, 2008A new database of trace gases and
aerosols B. Hassler et al. Title Page Abstract Introduction Conclusions References Tables Figures ◭ ◮ ◭ ◮ Back Close
Full Screen / Esc
Printer-friendly Version Interactive Discussion Examples of some of the products available through the BDBP are shown in Fig.7.
The evolution of the ozone hole every spring is clearly visible and the values from the 6 different data sources show no significant offsets or drifts in comparison to each other. The NO2time series plotted in panel (b) of Fig.7shows decreases in NO2in 1991 and
1992 resulting from the Mt. Pinatubo eruption. The H2O time series plotted in panel
5
(c) of Fig.7 shows good agreement between the HALOE and SAGE II data sources and the derived monthly means are in good agreement with Fig. 3a ofRosenlof et al.
(2001). In contrast to the high water vapour values seen in the 1991-1994 SAGE II data in Fig. 3a ofRosenlof et al.(2001), the SAGE II data screening implemented here removes most of the H2O data points in this period where measurements were strongly 10
affected by the eruption of Mt. Pinatubo.
This version of the BDBP does not consider problems of inhomogeneities between the different data sources. While comprehensive screening was applied to the different data sources, systematic offsets and drifts between the data sources are likely. Appli-cations using the BDBP, e.g. the calculation of a monthly mean 3-D ozone database,
15
will need to consider removal of these offsets and drifts.
An advantage of combining measurements from multiple sources is the improved temporal and spatial coverage achieved. It was shown that only with the combination of the different data sources a high index of coverage (B-factor) could be achieved. Especially the ozonesonde data contribute considerably to the coverage of the
tropo-20
sphere and the lower stratosphere.
One of the first applications of the BDBP will be the creation of a global lati-tude/altitude/time monthly mean ozone database to provide the ozone boundary con-ditions for global climate model simulations. To achieve this, missing values need to be spatially and/or temporally interpolated and is the focus of ongoing development.
25
Acknowledgements. We thank all institutions and colleagues who provided us with data for the
database: NASA, NRL, WOUDC, NOAA, NDACC, SHADOZ, H. Claude, R. Kivi, L. W. Thoma-son and all the people involved in the measurements and processing of the data. We also want to thank R. Schofield for the valuable advice on the SAGE II data screening details,
ACPD
8, 7657–7702, 2008A new database of trace gases and
aerosols B. Hassler et al. Title Page Abstract Introduction Conclusions References Tables Figures ◭ ◮ ◭ ◮ Back Close
Full Screen / Esc
Printer-friendly Version Interactive Discussion
L. W. Thomason for the suggestions about the SAGE I data screening method, W. J. Ran-del and F. Wu for access to their database, as well as W. J. RanRan-del for answering patiently all our questions concerning the R&W database. B. Hassler’s work was funded by a DAAD studentship.
References
5
Bhatt, P. P., Remsberg, E. E., Gordley, L. L., McInerney, J. M., Brackett, V. G., and Russell III, J. M.: An evaluation of the quality of Halogen Occultation Experiment ozone profiles in the
lower stratosphere, J. Geophys. Res., 104(D8), 9261–9275, 1999. 7667
Bodeker, G. E., Boyd, I. S., and Matthews, W. A.: Trends and variability in vertical ozone and temperature profiles measured by ozonesondes at Lauder, New Zealand: 1986–1996, J. 10
Geophys. Res., 103(D22), 28 661–28 681, 1998. 7669,7672
Brewer, A. W. and Milford, J. R.: The Oxford-Kew Ozone sonde, Proc. R. Soc. London A, 256,
470–495, 1960. 7669
Butchart, N. and Remsberg, E. E.: The area of the stratospheric polar vortex as a diagnostic
for tracer transport on an isentropic surface, J. Atmos. Sci., 43, 1319–1339, 1986.7660
15
Cunnold, D. M., Chu, W. P., Barnes, R. A., McCormick, M. P., and Veiga, R. E.: Validation of
SAGE II Ozone Measurements, J. Geophys. Res., 94(D6), 8447–8460, 1989.7663
Elliott, W. P. and Gaffen, D. J.: On the utility of radiosonde humidity archives for climate studies,
B. Am. Meteorol. Soc., 72, 1507–1520, 1991.7674
Forster, P. M. d. F. and Shine, K. P.: Radiative forcing and temperature trends from stratospheric 20
ozone changes, J. Geophys. Res., 102, 10 841–10 855, 1997. 7659
Fortuin, J. P. and Kelder, H.: An ozone climatology based on ozonesonde and satellite
mea-surements, J. Geophys. Res., 103(D24), 31 709–31 734, 1998. 7659,7676
Glaccum, W., Lucke, R., Bevilacqua, R. M., Shettle, E. P., Hornstein, J. S., Chen, D. T., Lumpe, J. D., Krigman, S. S., Debrestian, D. J., Fromm, M. D., Dalaudier, F., Chassefiere, E., Deniel, 25
C., Randall, C. E., Rusch, D. W., Olivero, J. J., Brogniez, C., Lenoble, J., and Kremer, R.: The Polar Ozone and Aerosol Measurement (POAM II) Instrument, J. Geophys. Res., 101(D9),
14 479–14 487, 1996. 7668
Hervig, M. and McHugh, M.: Cirrus detection using HALOE measurements, Geophys. Res.
Lett., 26(6), 719–722, 1999. 7667
ACPD
8, 7657–7702, 2008A new database of trace gases and
aerosols B. Hassler et al. Title Page Abstract Introduction Conclusions References Tables Figures ◭ ◮ ◭ ◮ Back Close
Full Screen / Esc
Printer-friendly Version Interactive Discussion
Kar, J., Trepte, C. R., Thomason, L. W., Zawodny, J. M., Cunnold, D. M., and Wang, H-J.: On the tropospheric measurements of ozone by the Stratospheric Aerosol and Gas Experiment II (SAGE II, version 6.1) in the tropics, Geophys. Res. Lett., 29(24), 2208,
doi:10.1029/2002GL016241, 2002. 7677
Kistler, R., Kalnay, E., Collins, W., Saha, S., White, G., Woollen, J., Chelliah, M., Ebisuzaki, W., 5
Kanamitsu, M., Kousky, V., van den Dool, H., Jenne, R., and Fiorino, M.: The NCEPNCAR 50Year Reanalysis: Monthly Means CDROM and Documentation, B. Am. Soc., 82(2), 247–
267, 2001.7661
Komhyr, W. D.: A carbon-iodine sonde sensor for atmospheric soundings, Proc. Ozone Symp.,
Albuquerque, p. 26, Geneva, 1965.7669
10
Komhyr, W. D.: Electrochemical concentration cells for gas analysis, Ann. Geophys., 25, 2003–
210, 1969,http://www.ann-geophys.net/25/2003/1969/. 7669
Komhyr, W. D., Oltmans, S. J., Chopra, A. N., and Franchois, P. R.: Performance characteristics of high-altitude ECC ozonsondes, in: Atmospheric Ozone, Proceedings of the Quadrennial
Ozone Symposium, Greece, 1985.7672,7696
15
Liu, X., Chance, K., Sioris, C. E., Kurosu, T. P., and Newchurch, M. J.: Intercompari-son of GOME, ozoneIntercompari-sonde, and SAGE II measurements of ozone: Demonstration of the need to homogenize available ozonesonde data sets, J. Geophys. Res., 111, D14305,
doi:10.1029/2005JD006718, 2006. 7663
Logan, J. A., Megretskaia, I. A., Miller, A. J., Tiao, G. C., Choi, D., Zhang, L., Stolarski, R. 20
S., Labow, G. J., Hollandsworth, S. M., Bodeker, G. E., Claude, H., DeMuer, D., Kerr, J. B., Tarasick, D. W., Oltmans, S. J., Johnson, B., Schmidlin, F., Staehelin, J., Viatte, P., and Uchino, O.: Trends in the vertical distribution of ozone: a comparison of two analyses of
ozonesonde data, J. Geophys. Res., 104, 26 373–26 399, 1999.7669
Lucke, R. L., Korwan, D., Bevilacqua, R. M., Hornstein, J. S., Shettle, E. P., Chen, D. T., Daehler, 25
M., Lumpe, J. D., Fromm, M. D., Debrestian, D., Neff, B., Squire, M., K ¨onig-Langlo, G., and Davies, J.: The Polar Ozone and Aerosol Measurement (POAM III) Instrument and Early
Validation Results, J. Geophys. Res., 104(D15), 18 785–18 799, 1999. 7668
Lumpe, J. D., Bevilacqua, R. M., Hoppel, K. W., Krigman, S. S., Kriebel, D. L., Randall, C. E., Rusch, D. W., Brogniez, C., Ramananaherosa, R., Shettle, E. P., Olivero, J. J., Leno-30
ble, J., and Pruvost, P.: POAM II Retrieval Algorithm and Error Analysis, J. Geophys. Res.,
102(D19), 23 593–23 614, 1997.7668
Algo-ACPD
8, 7657–7702, 2008A new database of trace gases and
aerosols B. Hassler et al. Title Page Abstract Introduction Conclusions References Tables Figures ◭ ◮ ◭ ◮ Back Close
Full Screen / Esc
Printer-friendly Version Interactive Discussion
rithm and Error Analysis, J. Geophys. Res., 107(D21), 4575, doi:10.1029/2002JD002137,
2002. 7668
Lumpe, J., Bevilacqua, R., Randall, C., Nedoluha, G., Hoppel, K., Russel, J., Harvey, V. L., Schiller, C., Sen, B., Taha, G., Toon, G., and V ¨omel, H.: Validation of Polar Ozone and Aerosol Measurement (POAM) III version 4 stratospheric water vapor, J. Geophys. Res., 5
111, D11301, doi:10.1029/2005JD006763, 2006. 7668
McCormick, M. P., Zawodny, J. M., Veiga, R. E., Larsen, J. C., and Wang, P. H.: An overview of SAGE I and SAGE II ozone measurements, Planet. Space Sci., 37(12), 1567–1586, 1989.
7663
McKenna, D. S., Grooß, J.-U., G ¨unther, G., Konopka, P., M ¨uller, R., Carver, G., and Sasano, Y.: 10
A new Chemical Lagrangian Model of the Stratosphere (CLaMS) 2. Formulation of chemistry
scheme and initialization, J. Geophys. Res., 107, 4256, 10.1029/2000JD000113, 2002.7667
McPeters, R. D., Lebow, G. J., and Logan, J. A.: Ozone climatological profiles for satellite
re-trieval algorithms, J. Geophys. Res., 112, D05308, doi:10.1029/2005JD006823, 2007. 7670
Miloshevich, L. M., V ¨omel, H., Paukkunen, A., Heymsfield, A. J., and Oltmans, S. J.: Character-15
ization and correction of relative humidity measurements from Vaisala RS80-A radiosondes
at cold temperatures, J. Atmos. Ocean. Tech., 18, 135–156, 2001. 7674
M ¨uller, R., Grooß, J.-U., Lemmen, K., Heinze, D., Dameris, M., and Bodeker, G. E.: Simple measures of ozone depletion in the polar stratosphere, Atmos. Chem. Phys., 8, 251–264,
2008,http://www.atmos-chem-phys.net/8/251/2008/.7670
20
Nash, E. R., Newman, P. A., Rosenfield, J. ., and Schoeberl, M. R.: An objective determination of the polar vortex using Ertel’s potential vorticity, J. Geophys. Res., 101(D5), 9471–9478,
1996. 7661
Nazaryan, H. and McCormick, M. P.: Comparisons of Stratospheric Aerosol and Gas Exper-iment (SAGE II) and Solar Backscatter Ultraviolet Instrument (SBUV/2) ozone profiles and 25
trend estimates, J. Geophys. Res., 110, D17302, doi:10.1029/2004JD005483, 2005. 7663
Randall, C. E., Rusch, D. W., Bevilacqua, R. M., Hoppel, K. W., Lumpe, J. D., Shettle, E., Thompson, E., Deaver, L., Zawodny, J., Kyr ¨o, E., Johnson, B., Kelder, H., Dorokhov, V. M., K ¨onig-Langlo, G., and Gil, M.: Validation of POAM III ozone: Comparisons with ozonesonde and satellite data, J. Geophys. Res., 108(D12), 4367, doi:10.1029/2002JD002944, 2003. 30
7668
Randel, W. J. and Wu, F.: A stratospheric ozone profile data set for 1979-2005: Variabil-ity, trends, and comparisons with column ozone data, J. Geophys. Res., 112, D06313,
ACPD
8, 7657–7702, 2008A new database of trace gases and
aerosols B. Hassler et al. Title Page Abstract Introduction Conclusions References Tables Figures ◭ ◮ ◭ ◮ Back Close
Full Screen / Esc
Printer-friendly Version Interactive Discussion
doi:10.1029/2006JD007339, 2007. 7659,7660,7676
Remsberg, E. E. and Deaver, L. E.: Interannual, solar cycle, and trend terms in mid-dle atmospheric temperature time series from HALOE, J. Geophys. Res., 110, D06106,
doi:10.1029/2004JD004905, 2005. 7667
Rind, D., Lerner, J., and Zawodny, J.: A complementary analysis for SAGE II data profiles, 5
Geophys. Res. Lett., 32, L07812, doi:10.1029/2005GL022550, 2005.7665
Ronnebeck, K. and Sonntag, D.: Eine weiterentwickelte elektrochemische Ozonradiosonde, Z.
Meteorol., 26, 15–19, 1976.7670
Rosenlof, K. H., Oltmans, S. J., Kley, D., Russell, J. M. III, Chiou, E.-W., Chu, W. P., Johnson, D. G., Kelly, K. K., Michelsen, H. A., Nedoluha, G. E., Remsberg, E. E., Toon, G. C., and 10
McCormick, M. P.: Stratospheric water vapour increases over the past half-century, Geophys.
Res. Lett., 28(7), 1195–1198, 2001.7680
Russell, J. M. III, Gordley, L. L., Park, J. H., Drayson, S. R., Hesketh, D. H., Cicerone, R. J., Tuck, A. F., Frederick, J. E., Harries, J. E., and Crutzen, P.: The Halogen Occultation
Experiment, J. Geophys. Res., 98(D6), 10 777–10 797, 1993.7667
15
Shreedharan, C. R.: An Indian electrochemical ozonesonde, J. Phys. E. Sci. Instrum., Sr-2,
995–997, 1968. 7670
Smit, H. G. J. and Kley, D.: J ¨ulich Ozone Sonde Intercomparison Experiment (JOSIE), 5
February–8 March 1996, WMO Report No. 130, 108 pp., 1996. 7672,7696
SPARC: Assessment of Upper Tropospheric and Stratospheric Water Vapour, Chap. 2, World 20
Climate Research Programme, WCRP-113, WMP/TD-No.1043, 261–264, 2000. 7674
Steil, B., Br ¨uhl, C., Manzini, E., Crutzen, P. J., Lelieveld, J., Rasch, P. J., Roeckner, E., and Kr ¨uger, K.: A new interactive chemistry-climate model: 1. Present-day climatology and inter-annual variability of the middle atmosphere using the model and 9 years of HALOE/UARS
data, J. Geophys. Res., 109(D9), 4290, doi:10.1029/2002JD002971, 2003. 7667
25
Thompson, A. M., Witte, J. C., McPeters, R. D., Oltmans, S. J., Schmidlin, J. A., Logan, J. A., Fujiwara, M., Kirchhoff, V. W. J. H., Posny, F., Coetzee, G. J. R., Hoegger, B., Kawakami, S., Ogawa, T., Johnson, B. J., V ¨omel, H., and Labow, G.: Southern Hemisphere Additional Ozonesondes (SHADOZ) 1998–2000 tropical ozone climatology – 1. Comparison with Total Ozone Mapping Spectrometer (TOMS) and gound-based measurements, J. Geophys. Res., 30
108(D2), 8238, doi:10.1029/2001JD000967, 2003. 7671
Tiao, G. C., Reinsel, G. C., Pedrick, J. H., Allenby, G. M., Mateer, C. L., Miller, A. J., and DeLuisi, J. J.: A statistical trend analysis of ozonesonde data, J. Geophys. Res., 91, 13 121–13 136,
ACPD
8, 7657–7702, 2008A new database of trace gases and
aerosols B. Hassler et al. Title Page Abstract Introduction Conclusions References Tables Figures ◭ ◮ ◭ ◮ Back Close
Full Screen / Esc
Printer-friendly Version Interactive Discussion
1986. 7669
Veiga, R. E., Cunnold, D. M., Chu, W. P., and McCormick, M. P.: Stratospheric aerosol and gas experiments I and II comparisons with ozonesondes, J. Geophys. Res., 100(D5), 9073–
9090, 1995. 7664
Wang, H. J., Cunnold, D. M., and Bao, X.: A critical analysis of Stratospheric Aerosol and Gas 5
Experiment ozone trends, J. Geophys. Res., 101(D7), 12 495–12 514, 1996. 7664,7665
Wang, H. J., Cunnold, D. M., Thomason, L. W., Zawodny, J. M., and Bodeker, G. E.: As-sessment of SAGE version 6.1 ozone data quality, J. Geophys. Res., 107(D23), 4691,
doi:10.1029/2002JD002418, 2002. 7663
Wang, P.-H., Cunnold, D. M., Trepte, C. R., Wang, H. J., Jing, P., Fishman, J., Brackett, V. 10
G., Zawodny, J. M., and Bodeker, G. E.: Ozone variability in the midlatitude upper tropo-sphere and lower stratotropo-sphere diagnosed from a monthly SAGE II climatology relative to the
tropopause, J. Geophys. Res., 111, D21304, doi:10.1029/2005JD006108, 2006.7663
WMO (World Meteorological Organization): Scientific Assessment of Stratospheric Ozone: 1989, Vol. 1, Global Ozone Research and Monitoring Project - Report No. 50, 486 pp., 15
ACPD
8, 7657–7702, 2008A new database of trace gases and
aerosols B. Hassler et al. Title Page Abstract Introduction Conclusions References Tables Figures ◭ ◮ ◭ ◮ Back Close
Full Screen / Esc
Printer-friendly Version Interactive Discussion
Table 1. Variables stored in version 1.0 of the BDBP, together with their units and data source(s).
Species Unit Data sources
O3number density 10 18
molecules/m3 SAGE I+II, POAM II+III, HALOE, ozonesondes
Temperature K SAGE I+II, POAM II+III, HALOE, ozonesondes
NO2number density 10 18
molecules/m3 SAGE I+II, POAM II+III, HALOE H2O mixing ratio 10−6moles/mole SAGE II, POAM II+III, HALOE
NO mixing ratio 10−9moles/mole HALOE
CH4mixing ratio 10
−6
moles/mole HALOE
HCl mixing ratio 10−9moles/mole HALOE
HF mixing ratio 10−9moles/mole HALOE
Relative humidity % ozonesondes
Aerosol extinction at 352.3 nm 1/km POAM II
Aerosol extinction at 353.4 nm 1/km POAM III
Aerosol extinction at 385 nm 1/km SAGE II
Aerosol extinction at 441.6 nm 1/km POAM II
Aerosol extinction at 442.3 nm 1/km POAM III
Aerosol extinction at 450 nm 1/km SAGE I
Aerosol extinction at 453 nm 1/km SAGE II
Aerosol extinction at 525 nm 1/km SAGE II
Aerosol extinction at 601.4 nm 1/km POAM II
Aerosol extinction at 603.4 nm 1/km POAM III
Aerosol extinction at 779.4 nm 1/km POAM III
Aerosol extinction at 781 nm 1/km POAM II
Aerosol extinction at 921 nm 1/km POAM II
Aerosol extinction at 922.4 nm 1/km POAM III
Aerosol extinction at 1000 nm 1/km SAGE I
Aerosol extinction at 1018 nm 1/km POAM III
Aerosol extinction at 1020 nm 1/km SAGE II
Aerosol extinction at 1060 nm 1/km POAM II
Aerosol surface area density µm2/cm3 SAGE II
ACPD
8, 7657–7702, 2008A new database of trace gases and
aerosols B. Hassler et al. Title Page Abstract Introduction Conclusions References Tables Figures ◭ ◮ ◭ ◮ Back Close
Full Screen / Esc
Printer-friendly Version Interactive Discussion
Table 2. Coverage, vertical resolution, period spanned and source of the data for the
satellite-based measurements included in version 1.0 of the BDBP.
Instrument Latitudinal coverage Vertical resolution Period spanned Data Source
HALOE 80◦ S–80◦ N ∼1.6 km 10/1991–11/2005 NASA POAM II 88◦ S–63◦ S, 55◦ N–71◦ N ∼1 km 10/1993–11/1996 NRL POAM III 88◦ S–62◦ S, 54◦ N–71◦ N ∼1 km 04/1998–11/2005 NRL SAGE I 79◦ S–79◦ N ∼1 km 02/1979–11/1981 NASA1 SAGE II 80◦ S–80◦ N ∼1 km 10/1984–08/2005 NASA 1