HAL Id: hal-00316219
https://hal.archives-ouvertes.fr/hal-00316219
Submitted on 1 Jan 1996
HAL is a multi-disciplinary open access
archive for the deposit and dissemination of sci-entific research documents, whether they are pub-lished or not. The documents may come from teaching and research institutions in France or abroad, or from public or private research centers.
L’archive ouverte pluridisciplinaire HAL, est destinée au dépôt et à la diffusion de documents scientifiques de niveau recherche, publiés ou non, émanant des établissements d’enseignement et de recherche français ou étrangers, des laboratoires publics ou privés.
Detection of nitric acid and nitric oxides in the
terrestrial atmosphere in the middle-infrared spectral
region
M. I. Blecka, M. de Mazière
To cite this version:
M. I. Blecka, M. de Mazière. Detection of nitric acid and nitric oxides in the terrestrial atmosphere in the middle-infrared spectral region. Annales Geophysicae, European Geosciences Union, 1996, 14 (11), pp.1103-1110. �hal-00316219�
Detection of nitric acid and nitric oxides in the terrestrial atmosphere
in the middle-infrared spectral region
M. I. Błe11 cka1, M. De Mazie|re2
1 Space Research Centre, Remote Sensing Department, Bartycka 18A, 00-716 Warszawa, Poland 2 Belgian Institute for Space Aeronomy, Ringlaan 3, B-1180 Brussels, Belgium
Received: 31 October 1995/Revised: 13 June 1996/Accepted: 18 June 1996
Abstract. A proposal for combined space and ground-based observations of the vertical distributions and the column densities of nitric acid and nitric oxide concentra-tions in the earth’s atmosphere is discussed. We focus on the aspects that are particular to the idea of correlative measurements: geometrical considerations, simulations of the solar absorption spectra in the middle-infrared region corresponding to the different observational geometries, and the associated retrieval methods. These studies are done specifically for the Belgian-French experiment MIRAS (MIR Infrared Atmospheric Spectrometer) on-board the Russian Space Station MIR and correlative ground-based FTIR measurements in the Tatra moun-tains.
1 Introduction
The detection of minor gaseous constituents (SO2, HNO3, NO9, HCl for example) and the determination of their concentration is very important in the study of the Earth’s environment. Despite their relatively small con-tent, these components can play a substantial role in atmospheric processes, leading even to breaking the eco-logical equilibrium (e.g. the influence of chlorine and ni-trogen on the ozone content in the atmosphere). Mid- and long-term observations from ground and from space are necessary to monitor sudden changes and to investigate long-term trends in the composition of the atmosphere. Central and Eastern Europe (Poland, Czech Republic and Slovakia for example) are regions where the number of such observations is very low. The combination of ground-based measurements in the Tatra mountains with the space experiment MIRAS is a good opportunity to fill this gap.
Correspondence to: M. Błe1 cka
The MIRAS grille spectrometer experiment has been prepared by the Belgian and French research institutions BISA, ONERA and LPMA (BISA: Belgian Institute for Space Aeronomy; ONERA: Office National d’Etudes et de Recherches Ae´rospatiales, Paris; LPMA: Laboratoire de Physique Mole´culaire et Applications, Univ. P.&M. Curie, Paris). It was launched towards MIR in the module ‘‘SPEKTR’’ on May 20 and mounted in space on 21 July, 1995. The first scientific measurements are foreseen by the end of this year. The Polish partner has been building the FTIR spectrometer that will be operated from Kasprowy Wierch or Łomnica in the Tatra mountains (49°N, 20°E). By combining the satellite and ground-based measure-ments, we hope particularly to benefit from correlative measurements producing auxiliary information from each other for retrieval (e.g. vertical profiles starting in the lower stratosphere from MIRAS, and total columns including troposphere from the ground-based FTIR instrument), for validation purposes and to obtain com-plementary measurements that will allow to study the atmospheric budget of some constituents as e.g., chlorine, NO9, etc. Therefore, we must verify which observations can be compared directly or how they must be interpreted to provide comparable quantities. As examples we present here some investigations concerning the HNO3 and NO2 species.
Nitrogen species play an important role in (photo-) chemical processes related to ozone destruction. Know-ledge of their concentration and vertical distribution, including their seasonal, latitudinal and diurnal vari-ations, and their long-term trends is very important in understanding the evolution of the ozone layer.
Many remote sensing observations of nitrogen species with various spectroscopic techniques from space, balloon or ground have become available lately (Kreher et al., 1995, and references therein); one of the most recent datasets with near-global coverage is provided by the CLAES and HALOE instruments on UARS from Sept 1992 onwards (Dessler et al., 1996 and references therein). However, only a limited number of long-term studies has
Fig. 1. a Block diagram of MIRAS optical system.
b Mounting of the instrument on the module SPEKTR, attached to the space station MIR. Depending on the attitude of MIR, MIRAS will adopt two different positions, as indicated by the dashed line
been published yet, mainly obtained at ground observato-ries e.g., the Jungfraujoch station in Switzerland (Rinsland et al., 1991; Demoulin et al., 1996).
The gas-phase chemistry of nitrogen species and their role in the destruction of ozone has been known for long time (e.g., Brasseur and Solomon, 1984). With the eruption of the Mt. Pinatubo volcano in summer 1991, the role of aerosols in the partitioning of nitrogen species through heterogeneous chemistry and the consequent impact on the ozone distribution through reactions with the halogen species has become evident (Solomon et al., 1996); the corresponding response in the evolution of the NO2 col-umn and of its diurnal variation over the last decade has been recognised in various observations (Van Roozendael et al., 1996, and references therein). Such a perturbed chemistry also plays a major role in the observed ozone losses in the polar winter and spring through heterogen-eous processes on polar stratospheric clouds (PSC) at low temperatures, occasionally leading to denitrification (WMO, 1995a). Also the impact of the growing aircraft fleet which causes enhanced NO9 emissions and probably higher water vapour and background aerosol
concentra-tions is of growing concern (WMO, 1995b). Therefore, it is of great interest to include the nitrogen species in the correlative measurements proposed here, which in particu-lar contribute to budget studies and vertical profile in-formation simultaneously, with a good spatial and tem-poral coverage, and which include a new ground-based site.
2 Instrumentation
2.1 Specifications of the MIRAS spectrometer
The MIRAS grille spectrometer is functionally identical to the grille spectrometer flown in the Spacelab and ATLAS programmes: detailed descriptions can be found in several references (e.g., Muller et al., 1985; Camy-Peyret et al., 1992). The instrument has been rebuilt, adapting it to the MIR requirements and updating the electronics. In the case of the optics, major revisions have been applied to the suntracker optical system, to have a wider field of accept-ance (Gobin, 1992). A block diagram of the optical part of the instrument is shown in Fig. 1a. This instrument is
Fig. 2. a General layout of the FTIR instrument. The spectrometer is contained in one box that is composed of three main items: telescope, interferometer, data processing unit. b Block diagram of the optical part of the FTIR spectrometer (Błe1 cka et al., 1994)
mounted on the outer side of the module SPEKTR at-tached to the space station MIR (Fig. 1b).
Briefly MIRAS is a scanning spectrometer cover-ing the 2.5—10.0lm spectral range with spectral re-solution better than 20 000, obtained with a 58.06 grooves/mm diffraction grating and a hyperbolic raster operating in transmission at entrance and in reflection at exit. A two detector and two filter wheel system (1 per detector) allows the simultaneous observation of at least two constituents. Each filter wheel can accommodate eight filters; the combination of filter and scanned grating angle defines the spectral interval that is observed. The signal-to-noise ratio is of the order of 50. Some more technical and operational details are described by De Mazie`re et al. (1995).
2.2 Specifications of the ground-based FTIR spectrometer The FTIR Spectrometer is a rapid-scan instrument produ-cing a one-sided interferogram. A general view of the instrument is presented in Fig. 2a, b. The Fourier spec-trometer is contained in one box. This box is composed of main three items: telescope including the sun tracking system, interferometer and data processing unit. The in-strument contains two interferometers sharing the same optical elements: the main interferometer for measuring
the target spectrum in the spectral range 2.0—16.0lm, and the reference interferometer, for measuring the real move-ments of the reflector.
Basic parameters of the constructed device are the following: spectral range :"2.0—16.0lm; spectral resolu-tion: +0.1 cm~1; dynamic range 216; angular field of view"6’(arcmin); S/N +50. As in the case of MIRAS the choice of the 2.0—16.0lm spectral range is motivated by the presence of numerous strong bands of vibrational-rotational quantum transitions, characteristic of the men-tioned gases which enables their detection and determina-tion of their concentradetermina-tion in the atmosphere.
3 Scientific objectives 3.1 MIRAS scientific objective
The MIRAS experiment’s scientific objective is monitor-ing of the atmospheric composition over at least one year, with a good seasonal and global geographical coverage; the technique used is solar occultation infrared absorption spectrometry in the 2.5 to 510.0 micron range. The density profiles of the following trace gases will be measured from the lower stratosphere up to the lower thermosphere (exact altitude limits depend on the mole-cule considered): O3, H2O, CO, CO2, NO, NO2, CH4,
N2O, HF, HCl, HNO3, N2O5, OCS, HCN and maybe CF2Cl2.The MIRAS cyclogram is divided into polar (470°), tropical, sub-tropical and mid-latitude campaigns and covers one calendar year; however since MIRAS has pre-decessors flown in 1983 and 1992, long-term trends in the concentration changes will also be addressed.
3.2 Polish FTIR spectrometer scientific objective
The FTIR spectrometer which will be used for the ground-based measurements in the Tatra mountains has been designed and built in Poland with the ob-jective of studying the concentration and distribution of atmospheric trace gases and ozone by means of in-frared absorption spectroscopy in the wavelength band 2.0—16.0lm. It is the first laboratory version of the same type of instrument planned for use during the CESAR mission (in 1998) onboard a small satellite. During the CESAR mission, measurements of absorption spectra are planned during sunset and sunrise in the height range of 10 km to 55 km ($1 km). For the experiment discussed here, ground-based measurements of column amounts of the trace gases will be performed from a sta-tion in the Tatra mountains. Two meteorological observ-atories are available: one at Kasprowy Wierch (49°N, 20°E, 1985 m altitude) and one at Tatrzan´ska Łomnica (49°N, 20°E, 2632 m altitude). We intend to continue the measurements at the chosen site beyond MIRAS’ lifetime to investigate long-term atmospheric evolution above Eastern Europe.
3.3 Specific objectives of the combined experiment
In addition to these measurement campaigns in the MIRAS cyclogram, it has been agreed with the Russian Flight Control Center to exploit a maximum number of occultations on occasions of satellite overpasses over the ground-based observatory; the conditions of spatial over-lap are discussed in detail hereafter.
Since an individual MIRAS observation is restricted to a small spectral window, and hence to a limited number of molecules, studies of more geophysical relevance can be performed with support from the quasi-simultaneous ground-based measurements: it is foreseen that during MIRAS overpasses the FTIR spectra will include the species that enable a coherent budget study (e.g., all the most abundant chlorine species), or that enable a more consistent interpretation (e.g., access to dynamical tracer molecules, correlated species, etc.). For species with non-negligible concentration in the troposphere, the tropospheric amount can be deduced from the compari-son of the overlapping satellite and ground-based measurements.
As explained in Sect. 4.3, the analysis of the ground-based measurements taken on these occasions will be-nefit from the vertical distributions measured by MIRAS for a more reliable estimation of the total column amounts.
4 Observation strategy
4.1 The importance of the observational geometry for the correlative measurements
The solar infrared radiation reaching the instrument, either in space, either on earth surface is attenuated along its path through the atmosphere mainly by absorption, which depends on the wavelength. The corresponding simulations presented hereafter have been done using the FSCATM algorithms (Gallery et al., 1983), for a spherical earth, including refraction in the atmosphere, and the US Standard 1976 model atmosphere.
The major difference between the two methods present-ed here namely the satellite and the ground-baspresent-ed measurements is their viewing geometry (McKenzie et al., 1989). The MIRAS spectrometer will point to the limb, observing the solar radiation that has passed through the earth’s atmosphere in sunset or sunrise conditions: this is the observational geometry of the occultation absorption experiments. Transmission spectra of the atmosphere will be measured during the event for various values of the tangent height. The ground-based spectra are character-ized by the solar zenith angle at the time of recording. Figures 3a, b and 4a, b show the growth of the constituents (NO2 and HNO3) amount along the line-of-sight, for the ground-based and satellite measurements respectively.
The geographical extent of the atmospheric airmasses sampled by both techniques in a correlative experiment of MIRAS with the ground-based FTIR from the Observ-atory on Kasprowy Wierch in the Tatra mountains for NO2 and HNO3 is shown in Fig. 5a, b, respectively. For the satellite limb measurement at x km tangent altitude 90% of the absorber is accumulated along the solid curve starting at the tangent point and running to end point: the triangular area below the curve gives an indication of the atmospheric region containing 90% of the absorber amount. For the ground-based observation at x degrees SZA, 90% of the absorbed amount is accumulated along the dashed curve originating at the observatory’s location, up to its end point: again the triangular area below the curve indicates the atmospheric region containing 90% of the absorber amount. The four curves correspond to the following solar zenith angles: 26, 50, 75 and 90 degrees. For example, in the ground-based observation at 90° SZA, Fig. 3 shows that the last part of the optical path from the Sun to observer from 20 km altitude to the observatory’s height contains approximately 60% of the HNO3 total amount that makes up the absorption in the spectrum. However, the same part of the path contains less than 40% of the NO2 amount that is responsible for the observed absorption. This behaviour originates from the fact that the NO2 concentration profile peaks at a higher altitude than the HNO3 one. If, in the same observational conditions, we are interested in the location in space of 90% of the detected absorber amounts, then Figs. 3 and 5 show that for HNO3 the corresponding airmass stretches out from the ground to 25 km altitude, covering a distance on Earth of 600 km from the observ-atory; analogously for NO2 the airmass is located between ground and 34 km, covering an even larger distance of
Fig. 3a, b. Growth of the accumulated molecular amount along the line-of-sight (LOS) versus altitude above earth’s surface, for a ground-based observation from the Tatra Observatory at different apparent solar zenith angles (SZA app) of a NO2, b HNO3
about 660 km on earth. These distances are directed east or west of the observatory depending on whether the observation is done at sunrise or sunset. Figure 4 should be interpreted analogously for an optical path from satel-lite to sun reaching its lowest altitude at the location of the tangent point. From these figures we conclude that the atmosphere close to (farther away from) the observation point in the horizontal direction is better sampled by the ground-based measurements at smaller (larger) SZA and by the collocated space-based measurements at higher (lower) tangent point altitudes; co-location here means spatial coincidence of the ground observatory and the projection on the earth of the tangent point of the obser-vation from space.
5 Choice of spectral windows
Simulations of the expected infrared solar occultation spectra have been performed, assuming vertical distribu-tion of atmospheric trace constituents according to the US 1976 Standard Atmosphere model and taking into account the spectral resolution of the instruments presented here. The atmospheric transmission in selected
Fig. 4a, b. Growth of the accumulated molecular amount along the line-of-sight (LOS) versus altitude above earth’s surface, for a satel-lite limb observation (from MIRAS) at different tangent heights (TGP) of a NO2, b HNO3
intervals of the spectrum (3-lm range) has been calculated using the line-by-line fast atmospheric signature code FAS-CODE2 with HITRAN92-database (Smith et al., 1978)
Some results of our simulation of atmospheric spectra with clearly visible signatures of NO2 and HNO3 molecules taken at different tangent altitudes by MIRAS, namely at 15, 25 and 30 km, and at different zenith angles by ground-based measurements are presented in Figs. 6—9.
For the ground-based measurements the main diffi-culty is to separate the lines of the gases of interest from the neighbouring lines of H2O of tropospheric origin. Therefore, in many cases it is impossible to use the same spectral region for the satellite and ground-based measurements, which adds to the complexity of the inter-pretation of the correlative measurements.
6 Retrieval methods 6.1 MIRAS spectrometer
An inversion must be performed to retrieve the concentra-tion profile of the gases. Two different methods have been
Fig. 5a, b. The comparison of the airmasses sampled in correlative measurements from satellite limb and from ground-based observa-tions for a NO2 and b HNO3
Fig. 6. Simulated atmospheric spectra in the 1598—1605 cm~1 spec-tral range containing significant NO2 absorptions, corresponding to MIRAS measurements at different tangent altitudes (H"15, 30 km)
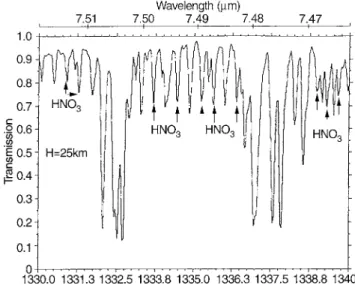
Fig. 7. Simulated atmospheric spectra in the 1330—1340 cm~1 spec-tral range containing significant HNO3 absorptions, corresponding to MIRAS measurements at 25 km tangent altitude
Fig. 8a, b. Simulated ground-based atmospheric spectrum in the 2911—2916 cm~1 spectral range, containing characteristic NO2 ab-sorptions, a at solar zenith angle (SZA)"26°, b at SZA"76° 1108 M. I. Błe1 cka, M. De Mazie`re: Detection of nitric acid and nitric oxides in the terrestrial atmosphere
Fig. 9. Simulated ground-based atmospheric spectrum in the 875—900 cm~1 spectral range, at solar zenith angle (SZA)"76°; the two Q branches at 879 cm~1 and 896 cm~1 of the nitric acid absorp-tion spectrum are visible
used up to now for spaceborne grille spectrometer experi-ments: Mill’s method, as shown and explained in Fig. 10 (Alamichel et al., 1986), and a damped non-linear least-squares minimization method with simultaneous retrieval of all unknown parameters (Armante, 1992). In both cases, spherical homogeneity is assumed. These methods have been optimized (Achard et al., submitted 1996) and are being implemented for MIRAS as well.
6.2 FTIR-measurements from the ground
Passive absorption techniques from the ground are less well suited for the retrieval of vertical concentration pro-files; however, if made with a sufficiently high-resolution instrument they are well adapted to the detection of new constituents and to reliable measurements of column densities. Nevertheless, the retrieval of column densities requires an estimate of the shape of the vertical concentra-tion profile of the constituents to be determined. For this purpose data from model calculations or from satellite measurements such as MIRAS can be used. The column amounts will be determined using a spectral fit method that adjusts the column amount so as to minimize the differences between simulated and observed spectra, in the least-squares sense.
The main sources of errors in the retrievals are: experi-mental noise and inaccurate knowledge of the instrument line shape, uncertainties in the assumed pressure-temper-ature profile and molecular concentration profiles and in the adopted line parameters for the gas, and statistical uncertainties coming from the algorithm. In the case of MIRAS, insufficient accuracy of the tangent point loca-tion, derived from the MIR orbit data and MIRAS helio-stat orientation, adds uncertainties to the derived vertical profiles. A quantification of the uncertainties must be
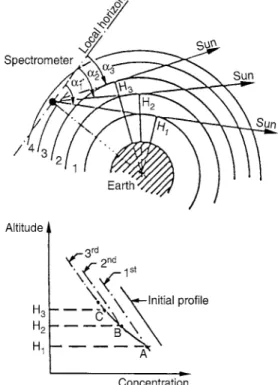
Fig. 10. The geometry of the solar occultation measurements and Mill’s method (Alamichel et al., 1986). According to Mill’s method the treatment of the spectra taken during one occultation starts at the lowest tangent height (H1): the vertical distribution profile is scaled up or down equally in all layers (1 to 4) above H1, so as to obtain the smallest rms difference between this first experimental spectrum and its corresponding simulated one. Then in a similar way, the next spectrum at tangent height H2 is compared with the corresponding simulation and the rms residual is minimized by scaling the previously obtained vertical profile values (denoted ‘‘1st
profile’’ in the figure) in all layers above H2, i.e. layers 2 to 4, while
keeping the lower values fixed, resulting in the 2nd profile. One continues until the adjustment has been done for the uppermost spectrum, leading to a first guess for the retrieved vertical distribu-tion, represented by the curve A-B-C-3rd profile. The whole proce-dure is repeated until convergence over the whole vertical profile is reached
made for each species (absorption-line dependent) and observation condition; an example applicable to MIRAS can be found in Achard et al. (1995, 1996), which shows also that the algorithms uncertainties can be estimated reliably if the same data are analysed independently with different algorithms. Similarly, biases between the re-trievals from the ground-based and space-borne data can be excluded to a large extent if the retrieval codes have a maximum number of modules in common, e.g., for the forward spectrum calculations, and adopt the same model and auxiliary parameters.
7 Summary
The planned experiment combining the spaceborne in-frared observations by MIRAS with the correlative ground-based FTIR observations from the Tatra moun-tains in Poland over at least a one year period (1996—1997) is able to address important issues in atmospheric
chemistry and its global changes in a time frame where few global measurements are available. It will fill a gap be-tween similar space-borne measurements from UARS and the projected Japanese and European platforms and the International Space Station, and includes a new ground-based observatory in Eastern Europe.
Acknowledgements. The work was supported by the grant 2 2150 92
03p 23 of the Polish State Committee for Scientific Research (KBN) and Belgian-Polish Joint Project No 4207 and IN/PO/004. We thank the Belgian OSTC for financing the MIRAS experiment.
Topical Editor F. Vial thanks F. Karcher for his help in evaluat-ing this paper.
References
Achard, V., C. Camy-Peyret, and M. De Mazie| re, HCl, CO and NO vertical profiles from the grille spectrometer on ATLAS-1,
Pro-ceedings of the European Symposium on Satellite Remote Sensing II, Paris (France), September 25—28, SPIE Vol. 2582, 1995, in
press.
Achard, V., M. De Mazie`re, C. Camy-Peyret, F. Karcher, and C. Lippens, Space-borne measurements of the upper-strato-spheric HCl vertical distribution in early 1992, and the trend in total stratospheric chlorine since 1985, submitted to J. Geophys. Res., Feb. 1996.
Alamichel, C., J. Laurent, D. Brard, and F. Mendez, An automatic program for retrieving atmospheric mixing ratio profiles from occultation spectra, Ann. Geophysicae., 4, 201—206, 1986. Armante, R., Inversion des Spectres Enregistrs par Occultation
Solaire dans l’Infrarouge a partir de Ballon ou de Satellite en vue de de´terminer les Profils Verticaux de Concentration des con-stituants de l’Atmosphere Terrestre, PhD Thesis, l’Universite´ Paris VI, 1992.
Błłe11 cka, M., W. Filipiak, S. Gadomski, J. Grygorczuk, A. Jurewicz, S. Makal, M. Morawski, P. Orlean{ ski, M. Rafałowski, and M. Rataj, CESAR: FS-experiment design review Ver. 2.0, Nov. 23, Report SRC, Warsaw, 1994.
Brasseur, G., and S. Solomon, Aeronomy of the Middle Atmosphere, D. Reidel, Dordrecht, 1984.
Camy-Peyret, C., N. Papineau, R. Armante, V. Achard, J. Besson, C. Muller, M. De Mazie| re, C. Lippens, J. Vercheval, M. Acker-man, and D. Frimout, Grille spectrometer scientific programs for the ATLAS1 Space Shuttle Flight, Rech. Ae& rosp., 3, 67—77, 1992. De Mazie| re, M., M. Ackerman, C. Lippens, C. Muller, V. Achard, J. Besson, C. Camy-Peyret, R. Hennecart, S. Rodin, and V. Antonov, The MIRAS Earth observation programme, Nouv. Sci. ¹echnol., 13 (2/3/4), 165—170, 1995.
Demoulin, P., R. Zander, G. Roland, L. Delbouille, and C. P. Rins-land, Long-term monitoring of NO, NO2, and HNO3 above the
Jungfraujoch, Polar Stratospheric Ozone, Proc. of the third
Euro-pean workshop (Office for Official Publications of the EuroEuro-pean Communities, ¸uxembourg), Eds. J. A. Pyle, N. R. P. Harris, and
G. T. Amanatidis, pp. 170—174, 1996.
Dessler A. E., S. R. Kawa, D. B. Considine, J. W. Waters, L. Froidevaux, and J. B. Kumer, UARS measurements of ClO and NO2 at 40 and 46 km and implications for the model ‘‘ozone deficit’’, Geophys. Res. ¸ett., 23, 339—342, 1996.
Gallery, W. O., F. X. Kneizys, and S. A. Clough, Air mass computer program for atmospheric transmittance/radiance calculation: FSCATM, AFG¸-¹R-83-0065, 1983.
Gobin, R., Senseur solaire de pointage, grand champ, haute re´solu-tion, M-S¹-1A-008-ONERA, ONERA Internal Document, May 1992.
Kreher, K., M. Fiedler, T. Gomer, J. Stutz, and U. Platt, The latitudinal distribution (50°N—50°S) of NO2 and O3 in Octo-ber/November 1990, Geophys. Res. ¸ett., 22, 1217—1220, 1995. McKenzie, R. L., P. V. Johnston, J. M. Zawodny, and M. P.
McCor-mick, NO2 column intercomparison between ground-based measurements at Lauder, New Zealand (45°S) and colocated SAGE II satellite measurements, in Ozone in the Atmosphere, A. Deepak, 1989.
Muller, C., C. Lippens, J. Vercheval, M. Ackerman, J. Laurent, M. P. Lemaitre, J. Besson, and A. Girard, Experience ‘‘Spectrometre a grille’’ a bord de la premiere charge utile de SPACELAB, J.
Optics, 16, 155—168, 1985.
Rinsland, C. P., R. Zander, and P. Demoulin, Ground-based infrared measurements of HNO3 total column abundances: long-term trend and variability, J. Geophys. Res., 96, 9379—9389, 1991. Smith, H. J. P., D. J. Dube, M. E. Gardner, S. A. Clough, F. X.
Kneizys, and L. S. Rothman, FASCODE-fast atmospheric signa-ture code, AFG¸-¹R-78-0081, 1978.
Solomon, S., R. W. Portmann, R. R. Garcia, L. W. Thomason, L. R. Poole, and M. P. McCormick, The role of aerosol variations in anthropogenic ozone depletion at northern midlatitudes, J.
Geo-phys. Res., 101, 6713—6727, 1996.
Van Roozendael, M., M. De Mazie| re, C. Hermans, P. C. Simon, J.-P. Pommereau, F. Goutail, X. Tie, C. Granier, and G. Brasseur, Nitrogen dioxide column amounts measurements at 45° and 65°N following Mt. Pinatubo eruption and comparison with 2-D model calculations, Polar Stratospheric Ozone, Proc. of the third
European workshop (Office for Official Publications of the Euro-pean Communities, ¸uxembourg), Eds. J. A. Pyle, N. R. P. Harris,
and G. T. Amanatidis, pp. 425—430, 1996.
WMO Global Ozone Research and Monitoring Project-Rep. 37, ‘Scientific Assessment of Ozone Depletion: 1994’, World Meteorol. Organisation, Geneva, Polar Ozone, Eds. D. W. Fahey et al., Chapter 3, 1995a.
WMO Global Ozone Research and Monitoring Project-Rep. 37,
‘Sci-entific Assessment of Ozone Depletion: 1994’, World
Meteorologi-cal Organisation, Geneva, Subsonic and supersonic aircraft
emis-sions, Eds. A. Wahner and M. A. Geller et al., Chapter 11, 1995b.
.


![[PDF] Cours Base de Données ADO.NET en PDF | Formation informatique](data:image/gif;base64,R0lGODlhAQABAIAAAP///wAAACH5BAEAAAAALAAAAAABAAEAAAICRAEAOw==)