HAL Id: hal-01898958
https://hal.archives-ouvertes.fr/hal-01898958v2
Submitted on 30 Oct 2020
HAL is a multi-disciplinary open access
archive for the deposit and dissemination of
sci-entific research documents, whether they are
pub-lished or not. The documents may come from
teaching and research institutions in France or
abroad, or from public or private research centers.
L’archive ouverte pluridisciplinaire HAL, est
destinée au dépôt et à la diffusion de documents
scientifiques de niveau recherche, publiés ou non,
émanant des établissements d’enseignement et de
recherche français ou étrangers, des laboratoires
publics ou privés.
Quantification of ice nuclei active at near 0°C
temperatures in low-altitude clouds at the Puy de Dôme
atmospheric station
M. Joly, Pierre Amato, Laurent Deguillaume, M. Monier, C. Hoose, A.-M.
Delort
To cite this version:
M. Joly, Pierre Amato, Laurent Deguillaume, M. Monier, C. Hoose, et al.. Quantification of ice
nuclei active at near 0°C temperatures in low-altitude clouds at the Puy de Dôme atmospheric
sta-tion. Atmospheric Chemistry and Physics, European Geosciences Union, 2014, 14, pp.8185-8195.
�10.5194/acp-14-8185-2014�. �hal-01898958v2�
www.atmos-chem-phys.net/14/8185/2014/ doi:10.5194/acp-14-8185-2014
© Author(s) 2014. CC Attribution 3.0 License.
Quantification of ice nuclei active at near 0
◦
C temperatures in
low-altitude clouds at the Puy de Dôme atmospheric station
M. Joly1,2,3,4, P. Amato1,2, L. Deguillaume3,4, M. Monier3,4, C. Hoose5, and A.-M. Delort1,2
1Clermont Université, Université Blaise Pascal, Institut de Chimie de Clermont-Ferrand, BP 10448, 63000 Clermont-Ferrand,
France
2CNRS, UMR6296, Institut de Chimie de Clermont-Ferrand, BP 80026, 63171 Aubière, France
3Clermont Université, Université Blaise Pascal, Observatoire de Physique du Globe de Clermont-Ferrand, Laboratoire de
Météorologie Physique, BP 10448, 63000 Clermont-Ferrand, France
4CNRS, UMR6016, Laboratoire de Météorologie Physique/Observatoire de Physique du Globe de Clermont-Ferrand, BP
80026, 63171 Aubière, France
5Institute for Meteorology and Climate Research, Karlsruhe Institute of Technology, Wolfgang-Gaede-Weg 1, 76131
Karlsruhe, Germany
Correspondence to: M. Joly ([email protected]) and P. Amato ([email protected]) Received: 27 January 2014 – Published in Atmos. Chem. Phys. Discuss.: 11 February 2014
Revised: 22 May 2014 – Accepted: 27 June 2014 – Published: 14 August 2014
Abstract. The distribution, abundance and nature of ice nu-cleation active particles in the atmosphere are major sources of uncertainty in the prediction of cloud coverage, precipi-tation patterns and climate. Some biological ice nuclei (IN) induce freezing at temperatures at which most other
atmo-spheric particles exhibit no detectable activity (> −10◦C).
Their actual contribution to the pool of IN in clouds remains poorly known, but numerical studies have suggested a prob-able significance of biological IN in atmospheric processes. In this study, cloud water was collected aseptically from the summit of Puy de Dôme (1465 m a.s.l., France) within con-trasted meteorological and physico-chemical situations. To-tal and biological (i.e. heat-sensitive) IN were quantified by
droplet-freezing assay between −5◦C and −14◦C. We
ob-served that freezing was systematically induced by biological
material, between −6◦C and −8◦C in 92 % of the samples.
Its removal by heat treatment consistently led to a decrease of
the onset freezing temperature, by 3◦C or more in most
sam-ples. At −10◦C, 0 to ∼ 220 biological IN mL−1of cloud
wa-ter were measured (i.e. 0 to ∼ 22 m−3of cloud air based on
cloud liquid water content estimates), and these represented 65 % to 100 % of the total IN. Based on back-trajectories and on physico-chemical analyses, the high variability observed resulted probably from a source effect, with IN originating mostly from continental sources. Assuming that biological
IN were all bacteria, at maximum 0.6 % of the bacterial cells present in cloud water samples could have acted as IN at
−8◦C, 1.5 % at −10◦C, and 3.1 % at −12◦C. The data set
generated here will help elucidate the role of biological and bacterial IN on cloud microphysics by numeric modelling, and their impact on precipitation at local scale.
1 Introduction
The formation of clouds and their evolution have global im-pacts on earth’s climate. Within the last decade, considerable efforts have been made in order to identify and quantify the particles acting as ice nuclei (IN) in the atmosphere. Those particles are responsible for the heterogeneous nucleation of ice in supercooled clouds, leading to modifications of their radiative properties and initiating precipitation. At
tempera-tures colder than about −15◦C, feldspar particles were
re-cently demonstrated to account for a great part to the pool of IN in mixed-phase clouds at a global scale (Atkinson et al., 2013). However, at warmer temperatures, most of the min-eral aerosols as well as metallic and soot particles exhibit only very low or undetectable IN activity (INA), and the best ice nuclei candidates are biological (bacteria, fungi), or bio-genic (macromolecules derived from living organisms, such
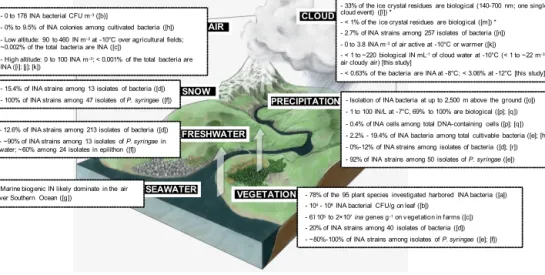
8186 M. Joly et al.: Quantification of ice nuclei active at near 0 C temperatures PRECIPITATION VEGETATION SEAWATER FRESHWATER CLOUD AIR
- 0 to 178 INA bacterial CFU m-3([b)]
- 0% to 9.5% of INA colonies among cultivated bacteria ([h]) - Low altitude: 90 to 460 IN m-3at -10°C over agricultural fields; ~0.002% of the total bacteria are INA ([c])
- High altitude: 0 to 100 INA m-3; < 0.001% of the total bacteria are INA ([i]; [j]; [k])
- 78% of the 95 plant species investigated harbored INA bacteria ([a]) - 104 - 108INA bacterial CFU/g on leaf ([b])
- 6î 105to 2×10⁷ina genes g-1on vegetation in farms ([c]) - 20% of INA strains among 40 isolates of bacteria ([d]) - ~80%-100% of INA strains among isolates of P. syringae ([e]; [f]) - Marine biogenic IN likely dominate in the air
over Southern Ocean ([g])
SNOW
- 15.4% of INA strains among 13 isolates of bacteria ([d]) - 100% of INA strains among 47 isolates of P. syringae ([f]) - 12.6% of INA strains among 213 isolates of bacteria ([d]) - ~90% of INA strains among 13 isolates of P. syringae in water; ~60% among 24 isolates in epilithon ([f])
- 33% of the ice crystal residues are biological (140-700 nm; one single cloud event) ([l]) *
- < 1% of the ice crystal residues are biological ([m]) * - 2.7% of INA strains among 257 isolates of bacteria ([n]) - 0 to 3.8 INA m-3of air active at -10°C or warmer ([k]) - < 1 to ~220 biological IN mL-1of cloud water at -10°C (< 1 to ~22 m-3 air cloudy air) [this study]
- < 0.63% of the bacteria are INA at -8°C; < 3.06% at -12°C [this study] - Isolation of INA bacteria at up to 2,500 m above the ground ([o]) - 1 to 100 IN/L at -7°C, 69% to 100% are biological ([p]; [q]) - 0.4% of INA cells among total DNA-containing cells ([p]; [q]) - 2.2% - 19.4% of INA bacteria among total cultivable bacteria ([e]; [h]) - 0%-12% of INA strains among isolates of bacteria ([d]; [r]) - 92% of INA strains among 50 isolates of P. syringae ([e])
Figure 1. Schematic summarizing our current knowledge about the abundance of biological IN active at temperatures ≥ −10◦C in the dif-ferent environmental links of the water cycle. An asterisk indicates data relative to ice crystal residues in clouds at much colder temperatures. [a] Lindow et al. (1978); [b] Lindemann et al. (1982); [c] Garcia et al. (2012) ; [d] Maki and Willoughby (1978); [e] Constantinidou et al. (1990); [f] Morris et al. (2008) ; [g] Burrows et al. (2013); [h] Stephanie and Waturangi (2011); [i] Bowers et al. (2009); [j] Conen et al. (2012); [k] Xia et al. (2013); [l] Pratt et al. (2009); [m] Cziczo et al. (2013); [n] Joly et al. (2013); [o] Sands et al. (1982); [p] Christner et al. (2008a); [q] Christner et al. (2008b); [r] Šantl-Temkiv et al. (2009).
as proteins) (Conen et al., 2011; DeMott and Prenni, 2010). Hence, biological IN are thought to largely influence cloud evolution within the upper range of temperatures around freezing (e.g. Möhler et al., 2007). Among those, the most ef-ficient natural IN described so far are bacteria, with
represen-tatives active at temperatures as “warm” as −2◦C (Maki et
al., 1974); other very active biological IN different from bac-teria were also detected in the air, but their exact nature re-mains unknown (Garcia et al., 2012). Specimens of INA bac-teria have been recovered from all the compartments of the water cycle: freshwaters (Maki and Willoughby, 1978; Mor-ris et al., 2008), clouds (Joly et al., 2013) and precipitation at high altitude (Sands et al., 1982) or closer to the ground (Constantinidou et al., 1990; Maki and Willoughby, 1978; Šantl-Temkiv et al., 2009; Stephanie and Waturangi, 2011). This supports the hypothetical concept termed “bioprecipi-tation” that such bacteria could participate to hydrological cycles by triggering precipitation (Morris et al., 2004).
Figure 1 summarizes our current quantitative knowledge
about high-negative-temperature (> −15◦C) IN in the
atmo-sphere and in the environmental compartments of the wa-ter cycle. The main results of the present study are also indicated. Most plants harbour relatively large populations of epiphytic ice nucleation active (INA) bacteria (Constan-tinidou et al., 1990; Lindemann et al., 1982; Lindow et al., 1978; Maki and Willoughby, 1978; Morris et al., 2008), so the main source of atmospheric biological IN is probably vegetation (Pöschl et al., 2010). Recently, oceans were also cited as possible emitters of biogenic IN into the atmosphere (Burrows et al., 2013).
In the air at low altitude, Garcia et al. (2012) observed
concentrations of 90 to 460 IN m−3 active at −10◦C over
vegetated agricultural areas, most of which were classified as biological based on their sensitivity to heat. In this latter study, INA bacterial cells were estimated to represent only a small fraction of the total airborne bacteria (∼ 0.002 %) (Garcia et al., 2012). Nevertheless, some specimens of INA bacterial strains have been recovered by culture from atmo-spheric samples (e.g. Stephanie and Waturangi, 2011). At high altitude, notwithstanding their suspected importance in atmospheric processes, much less quantitative data of high-temperature IN is available. Their concentration there is in
general much below 25 m−3, but it can vary drastically
be-tween < 1 and ∼ 100 m−3 within very short time frames
(Bowers et al., 2009; Conen et al., 2012; Xia et al., 2013). In-terestingly, the highest concentrations were observed at high relative humidity.
Airborne IN can be transported to regions very distant from the source of emission and affect rain patterns after being incorporated into clouds (Creamean et al., 2013). In the single orographic cirrus cloud event studied by Pratt et al. (2009), about half of the 46 ice crystals residues (140–
700 nm in diameter; −31◦C ambient temperature) had a
mass spectrometry signature typical of mineral dust, while about 33 % were biological particles. More recent and more extensive in situ observations of cirrus clouds at
tempera-tures < −30◦C showed that biological particles are probably
much more scarce among the solid residues of ice crystals (i.e. less than 1 %), but that rather mineral dust and metallic particles dominate (Cziczo et al., 2013). However, observing
ice crystal residues does not guarantee identifying the actual IN, and cirrus are high-altitude, very low temperature and non-precipitating clouds, so probably not the most appropri-ate environments for investigating high-temperature and bi-ological IN. A quantitative study of high-temperature atmo-spheric IN at lower altitude was led at the Jungfraujoch
sum-mit in the Alps (3450 m a.s.l.); concentrations of 0 to 3.8 m−3
were measured when clouds were present on the site (Xia et al., 2013). Albeit, as emphasized by authors, their “precision was low” due to a limited air sample volume of less than
3 m3.
Fresh snow and rain collected at different locations over the planet, from poles to sub-equatorial regions, carried ∼ 1
to ∼ 100 IN active at −7◦C per litre of water. Most were
al-tered by heat treatment and were thus categorized as biolog-ical, and about half of these were probably bacteria (Christ-ner et al., 2008a, b). INA bacteria were reported to be rel-atively more abundant in rainfall than in the air at a given site (Stephanie and Waturangi, 2011), which may indicate that INA bacteria are preferentially incorporated into rainfall than other bacteria.
Based on these studies, biological IN are undoubtedly present throughout the water cycle. They represent an im-portant fraction of the pool of high subzero temperature IN where they were unambiguously quantified: in the air at low altitude, and in precipitation. However, our knowledge about their relative abundance in clouds is still scarce, which lim-its the evaluation of their impact on hydrological cycles us-ing modellus-ing approaches (Hoose et al., 2010; Phillips et al., 2008). As stressed by DeMott and Prenni (2010), it is tech-nically not possible to provide any realistic concentration of airborne IN particles at the altitude of a cloud from measure-ments in precipitation, due to possible dilution/concentration effects and to non-nucleation particle scavenging. With the objective of providing quantitative data of IN concentration in clouds that could be utilized for modelling purposes, cloud water samples were collected throughout the year and under various meteorological situations from the summit of Puy de Dôme mountain in France (1465 m a.s.l.). Total and bi-ological IN concentrations were measured by the
droplet-freezing method (immersion droplet-freezing mode) between −5◦C
and −14◦C. Data were then analysed against
meteorologi-cal, chemical and biological variables, and maximum possi-ble values of INA bacteria concentration were inferred.
2 Materials and methods
2.1 Cloud water sampling and meteorological
measurements
Twelve random cloud events were sampled at the Puy de
Dôme station (45◦4602000N, 2◦5705700E; 1465 m above sea
level; see Figure S1 for localization) between June 2011 and October 2012. These events were visually classified
as non-orographic, and care was taken to avoid precipi-tating clouds during collection at the sampling site. These events were identified as samples #76 to #87 following the numbering of cloud events sampled at Puy de Dôme since 2001, for which chemical and microbiological data sets are publicly available at http://wwwobs.univ-bpclermont.fr/SO/ beam/data.php. Sampling operations were decided after vi-sual estimation of cloud optical thickness at the sampling site. Cloud droplets were selectively collected using single-stage aluminum droplet impactors (cut-off diameter: ∼ 7 µm; Kruisz et al., 1992) sterilized by autoclave, as in Vaïtilingom et al. (2012) and previous studies from our group. Meteoro-logical data were recorded continuously during sampling by the Observatory of the Globe of Clermont-Ferrand (OPGC)’s atmospheric station. The following parameters were consid-ered in our analysis: temperature (T; Vaisala), relative humid-ity (RH; Vaisala), liquid water content (LWC; Gerber PVM-100), and cumulated precipitation downwind the sampling site (Fig. S1 in the Suppleemnt). For most samples, LWC was not available. Sample collection rates were not judged reli-able enough for estimating LWC due to variations of collec-tion efficiency with droplet size distribucollec-tion or ice formacollec-tion (Kruisz et al., 1992). So, in those cases, LWC was approxi-mated from archive data by assigning the minimum, average or maximum value observed in clouds at Puy de Dôme (0.1,
0.3 or 0.6 g m−3, respectively; Deguillaume et al., 2014)
de-pending on the sample collection rate.
The global meteorological context was examined through 72 h back-trajectories of the air masses sampled using the HYSPLIT model (HYbrid Single-Particle Lagrangian Inte-grated Trajectory) with GDAS1 meteorological data archive and default settings (Draxler and Rolph, 2010) and satel-lite visible images of Europe and France from EUMETSAT, available for academic purposes at http://www.woksat.info/ wwp.html.
2.2 Physico-chemical characterization and total cell
counts
Cloud water samples were recovered either liquid or frozen onto the impaction plate depending on ambient temperature during sampling. For each sample, pH was measured (Con-sort multiparameters C830) and major inorganic and organic ions were examined by ion chromatography (Dionex DX 320 for anions and Dionex ICS1500 for cations).
Total bacteria were counted by epifluorescence mi-croscopy on DAPI-stained samples as in Vaïtilingom et al. (2012). Directly after collection, samples were fixed by the addition of 2 % formaldehyde (final concentration; from 20 % stock solution prepared in phosphate buffer
0.1 M, pH 7.0), and incubated in the presence of 2.5 µg mL−1
of DAPI (40,6-diamino-2-phenylindole) in the dark for
at least 20 min before filtration on GTBP black filters (0.22 µm porosity; Millipore). Filters were then mounted on microscope slides and observed under UV-epifluorescence
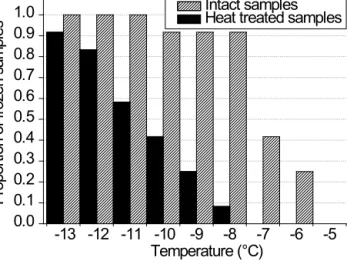
8188 M. Joly et al.: Quantification of ice nuclei active at near 0 C temperatures -13 -12 -11 -10 -9 -8 -7 -6 -5 0.0 0.1 0.2 0.3 0.4 0.5 0.6 0.7 0.8 0.9
1.0 Intact samples Heat treated samples
Pr op or tio n of fr oz en s am pl es Temperature (°C)
Figure 2. Cumulative proportion of cloud samples for which at least
one freezing event was observed during IN assays, in the absence of
treatment (shaded bars) or after heating at 95◦C for 10 min (black
bars).
microscopy (λexc=365 nm; λem=420 nm) (Leica
DM-IRB).
2.3 Droplet-freezing assays
The ice nucleation activity (INA) of the cloud water sam-ples in the immersion freezing mode was determined within 2 h after collection following the well-tried droplet-freezing method (Vali, 1971). Thirty-two to 160 drops (Table 2) of 20 µL were distributed in 0.2 mL microtubes designed for high thermal conductivity and preventing aerial contami-nation and evaporation (Stopelli et al., 2014). These were placed in a cooling bath (Julabo F34-ED) at decreasing
tem-peratures from −5 to −14◦C, with 1◦C intervals for 8 min.
The tubes were visually inspected at the end of each temper-ature step, and those still liquid were counted. The
concen-tration (mL−1) of ice nuclei CINat the temperature T in the
suspensions was calculated using the equation in Vali (1971):
CIN=[ln (Ntotal) – ln (Nliquid)]T/ V × (1 / Df), where Ntotal
is the total number of droplets, Nliquidthe number of droplets
still liquid after 8 min at the temperature T , V the
vol-ume of the droplets assayed (mL) and Df the dilution
fac-tor of the suspension. Under our experimental conditions,
the quantification limits ranged from 1.6 to 173.3 IN mL−1
in the case where 32 droplets were assayed, and from 0.3
to 253.8 IN mL−1 in the case where 160 droplets were
as-sayed. Negative controls consisted of ultrapure sterile water droplets, and these remained liquid over all the range of tem-peratures investigated.
2.4 Biological IN quantification
For each sample, the concentration of biological IN (INAbio)
was calculated as the difference between the concentration
of IN measured in untreated sample (INAtotal) and the
con-centration of IN measured after heating for 10 min at 95◦C
(INAheated), as in Christner et al. (2008a) and in Garcia et al. (2012). Heat denatures protein structures, so it elimi-nates at least a certain fraction of biological IN without
altering non-biological material. When [(INAheated)T −1 –
(INAheated)T] exceeded [(INAtotal)T −1 – (INAtotal)T], this
calculation artificially led to a decrease in the
concentra-tion of INAbio at T − 1 compared to T , and values of
INAheatedwere corrected for being consistent with the val-ues of INAtotal. Following this rule, three valval-ues of INAheated
were corrected: −12◦C in sample #79, −10◦C in sample
#82 and −11◦C in sample #86.
2.5 Statistical analyses
Principal component analysis was made using R soft-ware version 2.12.2 (R Core Team, 2011). Non-parametric tests (Pearson’s rank correlation test, Mann–Whitney test) were performed as most data were not normally distributed and the number of samples was quite low (< 30), using PAST version 2.04 (Hammer et al., 2001).
3 Results and discussion
3.1 Main characteristics of the cloud water samples
Twelve cloud water samples were collected between 29 June 2011 and 10 October 2012 from cloud events lasting in to-tal approximately 20 to 180 h at the Puy de Dôme, based on relative humidity measurements (Table 1; Fig. S1 in the Sup-plement). The meteorological context associated with each sampling period is presented in Fig. S1 in the Supplement. Most of the air masses sampled originated from the west (At-lantic Ocean) and travelled over different continental areas in Europe before reaching the Puy de Dôme, following differ-ent trajectories. Sampling operations were started about 5 to 110 h after clouds arrived at the sampling site. Cloud water was then collected for 1 h 10 min to 5 h 15 min, and after sam-pling the samsam-pling site remained embedded in cloud for 5 to more than 160 additional hours.
Only clouds that were non-precipitating at the sampling site were collected, but on some occasions rainfall occurred in the vicinity. The amount of precipitation that fell at five sites downwind the sampling site around the sampling period of time was measured (see Fig. S1 in the Supplement and Ta-ble 1); most cloud events were not or slightly precipitating in this area, with less than 1 mm of rain accumulated consider-ing the five rain gauges together. In contrast, it reached 1.6 and 7 mm for samples #76 and #77, respectively. Ambient
temperature during sampling ranged from −1.5 to 13.3◦C,
so some samples consisted of ice formed upon impaction on the collectors (samples #80 through #84); other samples were collected as liquid.
Bacteria concentration in the samples ranged between
1.65 × 10³and 3.37 × 10⁴mL−1. The chemical composition
varied greatly from one sample to another (Table S1 in the Supplement): pH ranged from 4.6 to 6.2, which are typical values for cloud water (e.g. Deguillaume et al., 2014). Am-monium (16.8 to 531.1 µM), sodium (0.6 to 145.7 µM), ni-trate (1.0 to 126.0 µM) and sulfate (0.5 to 52.2 µM) domi-nated among inorganic ions, and formate was the most abun-dant dissolved carboxylic acid (3.2 to 109.6 µM). The chem-ical signature of the samples attested of mixed influences from oceanic and continental sources, the respective contri-butions to the global chemical composition of which were more or less marked depending on the origin of the air mass.
3.2 Quantification of total and biological ice nuclei
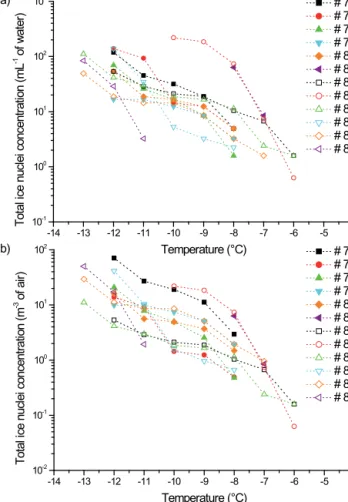
The total concentration of IN active between −5◦C and
−14◦C was determined by droplet freezing assays. In 11
of the 12 cloud samples (92 %), the onset temperature of freezing (i.e. temperature at which the first droplet froze) was
−8◦C or warmer. Only sample #87 started to freeze at colder
temperature (−11◦C) (Table 2; Fig. 2). Ice initially formed
due to the presence of 0.6 to 8.5 IN mL−1(Table 2; Fig. 3a).
Two samples (#81 and #83) were clearly outlying with much
higher IN concentrations (∼ 70 mL−1at −8◦C). Overall, the
onset freezing temperature was significantly correlated with the concentration of IN in the sample at the warmest temper-atures (Table S2; p value < 0.03, 0.66 < ρ < 0.79 with IN
concentrations at −8 and −9◦C). After correction for LWC
(Fig. 3b), the concentration of IN per volume of cloud air
ranged from 0.06 to more than 71.1 m−3between −6◦C and
−14◦C. This is in the range of concentrations typically
ob-served in the air at high altitude (Fig. 1) (Bowers et al., 2009; Xia et al., 2013), and 1 order of magnitude lower than the concentrations measured at low altitude (Garcia et al., 2012). Rain and surface snow samples analysed using similar meth-ods by Christner et al. (2008a, b) had total IN concentrations
of about ∼ 1 to ∼ 300 per litre of water at −8◦C, i.e. 2 orders
of magnitude fewer than in our cloud water samples. This probably resulted from the relative dilution of insoluble par-ticles in precipitation compared to cloud water (Flossmann and Wobrock, 2010), and from differences in sample han-dling: Christner et al. (2008a, b) filtered samples for concen-trating particles larger than 0.22 µm, so smaller IN particles were missed, among which some could have originated from bacteria (Phelps et al., 1986). In addition, it is possible that a fraction of IN particles was not recovered from the filters.
Heating samples for 10 min at 95◦C invariably decreased
the highest temperature of freezing (Fig. 2), in general by
3◦C to 4◦C, and by 1◦C (sample #81) to more than 4◦C
in samples #77 and #79, respectively (Table 2). This indi-cated that heat-sensitive IN (thereafter termed biological IN) were systematically responsible for freezing at the warmest temperatures. The proportion of biological IN in samples did not depend on the absolute total IN concentration (Table S2
-14 -13 -12 -11 -10 -9 -8 -7 -6 -5 -4 10-2 10-1 100 101 102 # 76 # 77 # 78 # 79 # 80 # 81 # 82 # 83 # 84 # 85 # 86 # 87 b) To ta l ic e nu cle i c on ce nt ra tio n (m -3 o f a ir) Temperature (°C) -14 -13 -12 -11 -10 -9 -8 -7 -6 -5 -4 10-1 100 101 102 103 a) To ta l ic e nu cle i c on ce nt ra tio n (m L -1 o f w at er ) Temperature (°C) # 76 # 77 # 78 # 79 # 80 # 81 # 82 # 83 # 84 # 85 # 86 # 87
Figure 3. Cumulative concentration of total IN in the cloud
sam-ples. (a) per volume of water sample (mL−1) and (b) per
corre-sponding volume of cloud air (m−3).
in the Supplement; p > 0.05). As other IN were activated at lower temperature, the relative contribution of biological IN decreased with decreasing temperature, from 97 % to 100 %
of the total number of IN active at −8◦C to as low as 77 %
at −12◦C (Table 2). These are in accordance with
observa-tions of IN in the air (Garcia et al., 2012) and in precipitation (Christner et al., 2008a, b).
The average absolute concentrations of biological and non-biological IN are represented on Fig. 4. Since heat treat-ment does probably not inactivate every IN site of biologi-cal material such as fungi or pollen (Pummer et al., 2012), the concentrations of biological IN reported here should be seen as conservative (i.e. lowest possible) values. Clearly, non-biological (i.e. heat-resistant) particles contribution
be-came significant only around −12◦C and colder. We
exam-ined the influence of the different variables measured on the IN content of our samples. Table S2 shows Spearman’s cor-relation matrices (p values, ρ and n) linking the variables together. Among noticeable correlations, coldest sampling temperatures were linked with highest onset freezing temper-atures (Table S2; Spearman’s rank correlation test; n = 12,
8190 M. Joly et al.: Quantification of ice nuclei active at near 0 C temperatures T able 1. Main characteristics of the cloud ev ents sampled. Sa mples reco v ered as ice formed upon impaction in the sampler are indicated in italic. See detailed ion composition in T able S1 in the Supplement. Sample Date Sampling period (UTC) Sampling duration (h) V olume sampled (mL) Cloud period (UTC) a Cloud ev ent duration (h) a T ime in cloud be-fore sampling (h) a T ime in cloud af-ter sampling (h) a Precipitation accumulated in the vicin-ity (mL) b Mean sampling temperature (◦ C) Mean L WC during sampling (g m − 3 ) Bacteria concentration (mL − 1 ) From T o From T o # 76 29 Jun 11 6:30 a.m. 11:45 a.m. 5.25 > 200 28/06/11, 10:00 p.m. 30/06/11, 0:00 a.m. 26 8.5 12.3 1.6 11.5 0.6 n.d. ∗ # 77 7 Jul 11 1:50 p.m. 3:00 p.m. 1.17 15 07/07/11, 9:00 a.m. 08/07/11, 6:00 a.m. 21 4.8 15 7 12.0 0.1 n.d. ∗ # 78 20 Jul 11 7:30 a.m. 9:10 a.m. 1.67 47 19/07/11, 3:00 p.m. 23/07/11, 4:00 p.m. 97 16.5 78.8 0.2 8.3 0.3 c 12355 # 79 7 No v 11 1:00 p.m. 2:30 p.m. 1.50 193 06/11/11, 8:00 a.m. 08/11/11, 11:00 a.m. 51 29 20.5 0.4 7.0 0.6 c 10825 # 80 20 Jan 12 12:45 p.m. 3:00 p.m. 2.25 55 18/01/12, 11:00 p.m. 26/01/12, 0:00 a.m. 169 37.7 129 0 − 0.4 0.3 c 9980 # 81 23 Jan 12 1:00 p.m. 4:00 p.m. 3.00 53 18/01/12, 11:00 p.m. 26/01/12, 0:00 a.m. 169 110 56 0 − 1.2 0.1 c 33 724 # 82 19 Ma r 12 12:10 p.m. 4:10 p.m. 4.0 0 4 5 1 7/03/12, 11:00 p.m. 21/03/12, 11:00 a.m. 84 37.2 42.8 0.2 − 1.5 0.1 c 1648 # 83 4 Apr 12 6:10 a.m. 9:20 a.m. 3. 17 2 9 0 3/04/12, 11:00 p.m. 06/04/12, 12:00 p.m. 61 7.2 50.7 0.25 − 0.4 0.1 c 14 914 # 84 18 Ap r 12 8:10 a.m. 12:15 p.m. 4. 08 3 1 17/04/12, 6:00 p.m. 25/04/12, 6:00 a.m. 180 14.2 161.8 0 0.2 0.1 c 3902 # 85 25 Jun 12 1:35 p.m. 5:00 p.m. 3. 42 6 6 25/06/12 01:00 a.m. 26/06/12 12:00 a.m. 35 12.6 19 0 13.3 0.3 c 4474 # 86 13 Se p 12 7:50 a.m. 9:50 a.m. 2. 00 7 5 12/09/12, 7:00 p.m. 13/09/12, 3:00 p.m. 20 12.8 5.2 0.8 6.0 0.6 c 5199 # 87 10 O ct 12 8:40 a.m. 9:50 a.m. 1. 17 7 0 08/10/12, 9:00 p.m. 11/10/12, 0:00 a.m. 63 35.7 26.2 0 9.4 0.6 c 19 658 ∗ n.d.: not determined. a Defined as RH > 95 % based on hourly av erage (see Fig. S1). b Sum of precipitation accumulated at fi v e rain g auge stations in the vicinity of Puy de Dôme (Ro yat, F arnette, Sayat, T rois Ponts and Blanzat) (see Fig. S1). c Estimation from sample collection rat e and Puy de Dôme data archi v e.
T able 2. T otal IN concentration and proportio n of heat-sensiti v e IN in the cloud w ater samples between − 5 ◦C and − 14 ◦C. V alues belo w the detection limit are presented as “0” for visual clarity , and “ > ” indicates v alues higher than our quantificatio n limit. Sample n = ∗ Onset freezing temperature ( ◦C) Onset freezing temperature after heat treatment ( ◦C) Decrease of onset freezing temperature by heat treatment ( ◦C) IN mL − 1[total (% heat-sensitive) ] T emperature ( ◦C) − 5 ◦C − 6 ◦C − 7 ◦C − 8 ◦C − 9 ◦C − 10 ◦C − 11 ◦C − 12 ◦C − 13 ◦C − 14 ◦C # 76 32 − 8 − 12 4 0 (– %) 0 (– %) 0 (– %) 4.9 (100 %) 18.7 (100 %) 31.6 (100 %) 45.0 (100 %) 118.4 (99 %) n.d. n.d. # 77 32 − 8 < − 12 > 4 0 (– %) 0 (– %) 0 (– %) 4.9 (100 %) 12.3 (100 %) 14.4 (100 %) 92.8 (100 %) 138.6 (100 %) n.d. n.d. # 78 32 − 8 − 11 3 0 (– %) 0 (– %) 0 (– %) 1.6 (100%) 8.5 (100%) 16.5 (100%) 26.1 (94%) 69.3 (88%) n.d. n.d. # 79 32 − 8 < − 12 > 4 0 (– %) 0 (– %) 0 (– %) 3.2 (100%) 8.5 (100%) 12.3 (100%) 16.5 (100%) 16.5 (100%) n.d. n.d. # 80 32 − 8 − 11 3 0 (– %) 0 (– %) 0 (– %) 4.2 (100 %) 12.3 (100 %) 16.5 (100 %) 18.7 (92 %) 53.4 (91 %) n.d. n.d. # 81 32 − 7 − 8 1 0 (– %) 0 (– %) 8.5 (100%) 63.4 (97%) > 173.3 (< 99 %) > 173.3 (< 97%) > 173.3 (< 95%) > 173.3 (< 92 %) n.d. n.d. # 82 32 − 6 − 9 3 0 (– %) 1.6 (100 %) 6.7 (100 %) 10.4 (100 %) 18.7 (74 %) 21.1 (66 %) 28.8 (70 %) 53.4 (77 %) n.d. n.d. # 83 160 − 6 − 10 4 0 (– %) 0.6 (100 %) 7.4 (100 %) 73.2 (100 %) 184.4 (100 %) 219.1 (99 %) > 253.8 (< 97 %) > 253.8 (< 93 % ) n.d. n.d. # 84 64 − 6 − 9 3 0 (– %) 1.6 (100 %) 2.4 (100 %) 11.4 (100 %) 16.5 (90 %) 18.7 (92 %) 30.2 (95 %) 41.3 (88 %) 110.6 (66 %) > 207.9 (< 55%) # 85 160 − 8 − 12 4 0 (– %) 0 (– %) 0 (– %) 2.2 (100 %) 3.2 (100 %) 5.3 (100 %) 34.7 (100 %) 138.6 (99 %) > 253.8 (< 91%) > 253.8 (< 45%) # 86 32 − 7 − 10 3 0 (– %) 0 (– %) 1.6 (100 %) 3.2 (100 %) 8.5 (100 %) 14.4 (89 %) 14.4 (89 %) 18.7 (83 %) 49.0 (93 %) > 173.3 (< 56 %) # 87 32 − 11 − 13 2 0 (– %) 0 (– %) 0 (– %) 0 (– %) 0 (– %) 0 (– %) 3.2 (100 %) 28.8 (100 %) 83.7 (72 %) > 173.3 (< 46 %) Median − 8 − 10.5 3 0 (– %) 0 (– %) 0 (– %) 4.9 (100 %) > 12.3 (100 %) > 16.5 (100 %) > 29.5 (< 96 %) > 61.4 (< 92 %) > 97.2 (< 82 %) > 190.6 (< 51 %) Min − 11 − 13 1 0 (– %) 0 (– %) 0 (– %) 0 (– %) 0 (– %) 0 (– %) 3.2 (70 %) 16.5 (91 %) 49.0 (66 % ) > 173.3 (< 45%) Max − 6 − 8 > 4 0 (– %) 1.6 (100 %) 8.5 (100 %) 73.2 (100 %) 184.4 (100 %) 219.1 (100 %) > 253.8 (100 %) > 253.8 (100 %) > 253.8 (93 %) > 253.8 (< 56 %) ∗ Number of 20 µL drople ts assayed by immersion freezing assays; n.d.: not determined.
8192 M. Joly et al.: Quantification of ice nuclei active at near 0 C temperatures
Figure 4. Mean cumulative concentrations of biological
(heat-sensitive. shaded area) and non-biological (heat-resistant, black area) IN in clouds (n = 12) per volume of air. The sum of the two categories corresponds to the mean concentration of total IN. The lower bound was considered for values below the detection limit.
p =0.0361, ρ = −0.61). Consistently, IN activity was higher
in samples collected frozen than in samples collected as liq-uid: higher IN concentrations at the highest temperatures and warmer onset freezing temperature (Mann–Whitney test;
me-dians = −8 and −6◦C, respectively). This result is quite
sur-prising if, logically, one considers that the most active IN should be activated and precipitated first, and so that cold air masses should be depleted in highest temperatures IN com-pared to warmer air masses. Bigg (1996)’s observations of airborne IN in the Arctic indeed suggested that such a selec-tion process occurs in the atmosphere. In our case, the
mini-mum temperature during sampling was > −2◦C (Table 1), so
likely still too warm for leading to any temperature partition-ing of IN in the clouds sampled. So, despite the fact that the influence of freezing on further IN concentration measure-ments in our samples cannot be totally excluded, it is possi-ble that the relationship observed results from a higher ex-pression level of IN proteins by bacteria in the coldest clouds (Nemecek-Marshall et al., 1993).
Clouds which precipitated downwind the Puy de Dôme had globally a shorter lifespan at the sampling site (Table S2 in the Supplement). Despite the potential influence of IN on precipitation, no correlation was found here between IN con-centrations and local rainfall.
Principal component analysis (PCA) revealed two differ-ent groups of IN depending on their temperature of activity,
with a net separation between −10◦C and −11◦C (Fig. S2).
This demonstrated differences in the origin of the two sets of IN and so probably in their nature as well. The clear positive
correlation existing between INT ≤ −11◦C and soluble
inor-ganic ions concentrations supports their inorinor-ganic
composi-tion (Fig. S2). The concentracomposi-tions of INT >−11◦C, i.e.
biolog-ical IN, and Ca2+were positively correlated, while the trend
toward chloride, which mostly originates from marine en-vironment (Warneck, 1999) was negative (Table S2). These tend to situate the sources of biological IN on the continent, at the Puy de Dôme site, probably including both regional and more distant areas.
Considering cloud droplets as spherical, we propose an ex-trapolation of IN concentration per droplet based on the total IN concentration measured. Thus, for a population of cloud droplets distributed as a single mode of 20 µm in diameter, at
the temperature of −8◦C there was a maximum of 1 IN
ev-ery ∼ 3 × 10⁶droplets, and the median value corresponded
to 1 IN every ∼ 5 × 10⁷droplets.
3.3 Estimation of the contribution of bacteria to
biological IN
Joly et al. (2013) proposed an estimation of the concentra-tion of INA bacteria in clouds based on laboratory results. It
was proposed that between 0 and ∼ 500 bacterial cells mL−1
could act as IN in cloud water at −10◦C. This very wide
range needed clarification. In order to discriminate bacterial IN from other biological IN, Christner et al. (2008a, b) sug-gested treating samples with lysozyme. This was intended to alter bacterial cell wall and selectively eliminate bacte-rial IN. Lysozyme is indeed responsible for the lysis of pep-tidoglycans by hydrolysing the 1,4-β linkages between N-acetylmuramic acid and N-acetylglucosamine, so it is partic-ularly active towards Gram-positive bacteria; its efficiency towards Gram-negative species is much less marked and it requires additional treatments incompatible with droplet freezing assays (Masschalck and Michiels, 2003; Repaske, 1956). So far, all INA bacteria described in literature includ-ing those encountered in clouds have been Gram-negative species (Cochet and Widehem, 2000; Joly et al., 2013). We verified lysozyme efficiency in altering INA of bacteria on two of our cloud samples and on laboratory cultures of INA Gamma-Proteobacteria (Gram-negative) isolated from cloud water (those reported in Joly et al., 2013): lysozyme had no effect on the freezing profiles (not shown). So, this treatment was finally judged not reliable enough here for suppressing specifically bacterial INA and it was not applied further.
In our samples, bacteria concentration ranged from
1.6 × 10³ to 3.4 × 10⁴mL−1, which is within the range of
concentrations typically observed in cloud water at the Puy de Dôme site (Vaïtilingom et al., 2012) (Table 1). As ex-pected, since only a small proportion of bacteria is actually IN active and that this can be very variable even within INA+ bacterial strains cultures (e.g. Joly et al., 2013), IN concentra-tion did not vary with bacteria concentraconcentra-tion. Rather, it was significantly correlated with most ion concentrations,
partic-ularly strongly with K+ and NO−3 (Table S2 in the
Supple-ment), suggesting a similar source, i.e. continental origin. In order to provide an estimation of the possible proportion of
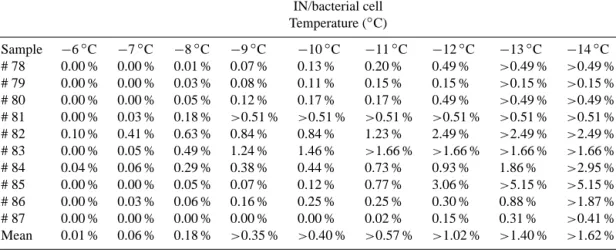
Table 3. Inferred maximum possible fraction of INA bacteria among total bacteria in the samples based on heat-sensitive IN concentrations
and on total bacteria counts. A “>” indicate values higher than experimental quantification limit for heat-sensitive IN. IN/bacterial cell Temperature (◦C) Sample −6◦C −7◦C −8◦C −9◦C −10◦C −11◦C −12◦C −13◦C −14◦C # 78 0.00 % 0.00 % 0.01 % 0.07 % 0.13 % 0.20 % 0.49 % >0.49 % >0.49 % # 79 0.00 % 0.00 % 0.03 % 0.08 % 0.11 % 0.15 % 0.15 % >0.15 % >0.15 % # 80 0.00 % 0.00 % 0.05 % 0.12 % 0.17 % 0.17 % 0.49 % >0.49 % >0.49 % # 81 0.00 % 0.03 % 0.18 % >0.51 % >0.51 % >0.51 % >0.51 % >0.51 % >0.51 % # 82 0.10 % 0.41 % 0.63 % 0.84 % 0.84 % 1.23 % 2.49 % >2.49 % >2.49 % # 83 0.00 % 0.05 % 0.49 % 1.24 % 1.46 % >1.66 % >1.66 % >1.66 % >1.66 % # 84 0.04 % 0.06 % 0.29 % 0.38 % 0.44 % 0.73 % 0.93 % 1.86 % >2.95 % # 85 0.00 % 0.00 % 0.05 % 0.07 % 0.12 % 0.77 % 3.06 % >5.15 % >5.15 % # 86 0.00 % 0.03 % 0.06 % 0.16 % 0.25 % 0.25 % 0.30 % 0.88 % >1.87 % # 87 0.00 % 0.00 % 0.00 % 0.00 % 0.00 % 0.02 % 0.15 % 0.31 % >0.41 % Mean 0.01 % 0.06 % 0.18 % >0.35 % >0.40 % >0.57 % >1.02 % >1.40 % >1.62 %
INA bacteria in our samples, biological IN concentration was normalized to bacteria concentration (Table 3). This has to be considered as an upper estimate as it obviously assumes only one IN site per cell, which is the most likely (Hartmann et al., 2013), and it ignores the fact that a certain but unknown fraction of biological materials other than bacteria could also have been inactivated by heat and contributed to the popu-lation of biological IN, such as cell fragments for example
(Hartmann et al., 2013). At the temperature of −6◦C, a
max-imum of 0.1 % of the bacteria could have been responsible for freezing (sample #82). This proportion reached maxima
of 1.24 % at −9◦C and 3.06 % at −12◦C (in samples #83
and #85, respectively), or about 200 INA cells mL−1. In the
air over vegetated areas, INA bacteria were estimated to con-tribute only ∼ 0.002 % of the total cells (Garcia et al., 2012), and this proportion falls to less than 0.001 % at high altitudes (Xia et al., 2013). In snowfall, comparable estimations gave a very similar fraction of 0.4 % of bacterial cells acting as IN
between −4◦C and −7◦C (Christner et al., 2008a) (Fig. 1).
In laboratory cultures of INA bacteria, the proportion of in-dividual cells actually acting as IN largely depends on the strain. Except in some exceptionally efficient microorgan-isms for which this can reach up to more than 4 %, this is
of-ten around 1 % at −9◦C, and in general well below 0.1 % at
−6◦C (Joly et al., 2013; Šantl-Temkiv et al., 2009;
Yankof-sky et al., 1981). So, at temperatures below −6◦C, the
pro-portion of INA bacterial cells in clouds basically matched laboratory cultures of INA+ strains.
Low pH (i.e. pH ∼ 4) was shown to negatively impact bac-terial INA (Turner et al., 1990). This suggested attenuation of bacterial IN efficiency in polluted clouds due to anthro-pogenic emissions responsible for acidification (Attard et al., 2012). Among the set of clouds investigated here, only sam-ple #79, with a pH of 4.6, was clearly under influence of hu-man emissions. Yet its freezing profile was not different from others, and on the whole we found no significant relationship
between pH and total or biological IN concentrations (Spear-man’s correlation test; the p values ranged between 0.46 and
1 between −6 and −13◦C).
4 Conclusion
To our knowledge, this study constitutes the first quantitative data set of biological IN measured directly in cloud water. A basic but straightforward experimental set-up allowed us to determine that the concentration of total IN varies in
gen-eral between ∼ 1 and ∼ 200 mL−1at −10◦C. As previously
observed in the air (Garcia et al., 2012) and in precipitation (Christner et al., 2008a), heat-sensitive material, i.e. biolog-ical particles, was systematbiolog-ically responsible for freezing at the warmest temperatures and largely dominated the
popula-tion of IN particles at temperatures down to −11◦C. These
data support the possibility that biological material could contribute to cloud evolution by triggering precipitation at
temperatures close to 0◦C.
A certain proportion of the biological IN detected in the cloud water samples were likely bacterial cells. Some speci-mens were indeed previously recovered by culture from sev-eral clouds collected at that site (Joly et al., 2013). Assuming that the biological IN observed were all bacterial cells, be-tween 0 % and about 1.5 % of the total bacteria were IN at
−10◦C. This extends to much higher values than the
propor-tion of around 0.001 % and 0.4 % proposed for air (Garcia et al., 2012; Xia et al., 2013) and precipitation, respectively (Christner et al., 2008a).
Our experimental procedure by conventional droplet freez-ing assay only allowed processfreez-ing a limited number of sam-ples, which also limited our conclusions. In addition, season-ality was not approached here. The development of online measurements is opening new perspectives in the prospec-tion for atmospheric IN, and, in the near future, it should greatly help elucidate their role and environmental drivers
8194 M. Joly et al.: Quantification of ice nuclei active at near 0 C temperatures
(e.g. Bundke et al., 2010; Huffman et al., 2013). Such esti-mates of in-cloud biological IN concentrations will allow the community of atmospheric scientists to explore, e.g. using cloud-resolving models, the extent to which these particles can contribute to cloud glaciation, to modification of cloud radiative properties and to regional precipitation patterns.
The Supplement related to this article is available online at doi:10.5194/acp-14-8185-2014-supplement.
Acknowledgements. M. Joly is grateful to Region Auvergne and
FEDER for PhD scholarship. We thank Martine Sancelme and Guillaume Voyard for technical help on microbiology and ion chromatography respectively, Yves Pointin for rain data, and the OPGC staff, particularly Jean-Marc Pichon, for their excellent logistic support at the Puy de Dôme Observatory. We are also grateful to LMGE UMR6023 CNRS-UBP for kindly providing access to microscopes. We are also grateful to Cindy Morris, Gabor Vali and two anonymous reviewers for their constructive comments on the discussion manuscript.
Edited by: A. Huffman
References
Atkinson, J. D., Murray, B. J., Woodhouse, M. T., Whale, T. F., Baustian, K. J., Carslaw, K. S., Dobbie, S., O’Sullivan, D., and Malkin, T. L.: The importance of feldspar for ice nucleation by mineral dust in mixed-phase clouds, Nature, 498, 355–358, 2013. Attard, E., Yang, H., Delort, A.-M., Amato, P., Pöschl, U., Glaux, C., Koop, T., and Morris, C. E.: Effects of atmospheric conditions on ice nucleation activity of Pseudomonas, Atmos. Chem. Phys., 12, 10667–10677, doi:10.5194/acp-12-10667-2012, 2012. Bigg, E. K.: Ice forming nuclei in the high Arctic, Tellus B, 48,
223–233, 1996.
Bowers, R. M., Lauber, C. L., Wiedinmyer, C., Hamady, M., Hal-lar, A. G., Fall, R., Knight, R., and Fierer, N.: Characterization of airborne microbial communities at a high-elevation site and their potential to act as atmospheric ice nuclei, Appl. Environ. Microbiol., 75, 5121–5130, 2009.
Bundke, U., Reimann, B., Nillius, B., Jaenicke, R., and Bingemer, H.: Development of a Bioaerosol single particle detector (BIO IN) for the Fast Ice Nucleus CHamber FINCH, Atmos. Meas. Tech., 3, 263–271, doi:10.5194/amt-3-263-2010, 2010. Burrows, S. M., Hoose, C., Pöschl, U., and Lawrence, M. G.: Ice
nuclei in marine air: biogenic particles or dust?, Atmos. Chem. Phys., 13, 245–267, doi:10.5194/acp-13-245-2013, 2013. Christner, B. C., Cai, R., Morris, C. E., McCarter, K. S., Foreman,
C. M., Skidmore, M. L., Montross, S. N. and Sands, D. C.: Ge-ographic, seasonal, and precipitation chemistry influence on the abundance and activity of biological ice nucleators in rain and snow, P. Natl. Acad. Sci., 105, 18854–18859, 2008a.
Christner, B. C., Morris, C. E., Foreman, C. M., Cai, R. and Sands, D. C.: Ubiquity of biological ice nucleators in snowfall, Science, 319, p. 1214, 2008b.
Cochet, N. and Widehem, P.: Ice crystallization by Pseudomonas
syringae, Appl. Microbiol. Biotechnol., 54, 153–161, 2000.
Conen, F., Henne, S., Morris, C. E., and Alewell, C.: Atmospheric
ice nucleators active can be quantified on PM10filters, Atmos.
Meas. Tech., 5, 321–327, doi:10.5194/amt-5-321-2012, 2012. Conen, F., Morris, C. E., Leifeld, J., Yakutin, M. V., and Alewell,
C.: Biological residues define the ice nucleation properties of soil dust, Atmos. Chem. Phys., 11, 9643–9648, doi:10.5194/acp-11-9643-2011, 2011.
Constantinidou, H., Hirano, S. S., Baker, L. S., and Upper, C. D.: Atmospheric dispersal of ice nucleation-active bacteria: the role of rain, Phytopathology, 80, 934–937, 1990.
Creamean, J. M., Suski, K. J., Rosenfeld, D., Cazorla, A., DeMott, P. J., Sullivan, R. C., White, A. B., Ralph, F. M., Minnis, P., Com-stock, J. M., Tomlinson, J. M. and Prather, K. A.: Dust and bio-logical aerosols from the Sahara and Asia influence precipitation in the Western U.S., Science, 339, 1572–1578, 2013.
Cziczo, D. J., Froyd, K. D., Hoose, C., Jensen, E. J., Diao, M., Zondlo, M. A., Smith, J. B., Twohy, C. H. and Murphy, D. M.: Clarifying the dominant sources and mechanisms of cirrus cloud formation, Science, 340, 1320–1324, 2013.
Deguillaume, L., Charbouillot, T., Joly, M., Vaïtilingom, M., Para-zols, M., Marinoni, A., Amato, P., Delort, A.-M., Vinatier, V., Flossmann, A., Chaumerliac, N., Pichon, J. M., Houdier, S., Laj, P., Sellegri, K., Colomb, A., Brigante, M. and Mailhot, G.: Clas-sification of clouds sampled at the puy de Dôme (France) based on 10 years of monitoring of their physicochemical properties, Atmos. Chem. Phys., 14, 1485–1506, doi:10.5194/acp-14-1485-2014, 2014.
DeMott, P. J. and Prenni, A. J.: New directions: need for defining the numbers and sources of biological aerosols acting as ice nuclei, Atmos. Environ., 44, 1944–1945, 2010.
Draxler, R. and Rolph, G.: HYSPLIT (HYbrid Single-Particle La-grangian Integrated Trajectory model, available at: http://ready. arl.noaa.gov/HYSPLIT.php (last access: 5 February 2014), 2010. Flossmann, A. I. and Wobrock, W.: A review of our understanding of the aerosol–cloud interaction from the perspective of a bin resolved cloud scale modelling, Atmos. Res., 97, 478–497, 2010. Garcia, E., Hill, T. C. J., Prenni, A. J., DeMott, P. J., Franc, G. D., and Kreidenweis, S. M.: Biogenic ice nuclei in boundary layer air over two U.S. high plains agricultural regions, J. Geophys. Res.-Atmos., 117, D018209, doi:10.1029/2012JD018343, 2012. Hammer, Ø., Harper, D. A., and Ryan, P. D.: PAST: PAleontologi-cal STatistics software package for education and data analysis, Palaeontol. Electron., 4, available at: http://www.uv.es/pe/2001_ 1/past/past.pdf (last access: 20 May 2014), 2001.
Hartmann, S., Augustin, S., Clauss, T., Wex, H., Šantl-Temkiv, T., Voigtländer, J., Niedermeier, D., and Stratmann, F.: Immer-sion freezing of ice nucleation active protein complexes, At-mos. Chem. Phys., 13, 5751–5766, doi:10.5194/acp-13-5751-2013, 2013.
Hoose, C., Kristjánsson, J. E., and Burrows, S. M.: How important is biological ice nucleation in clouds on a global scale?, Environ. Res. Lett., 5, 024009, doi:10.1088/1748-9326/5/2/024009, 2010. Huffman, J. A., Prenni, A. J., DeMott, P. J., Pöhlker, C., Mason, R. H., Robinson, N. H., Fröhlich-Nowoisky, J., Tobo, Y., Després, V. R., Garcia, E., Gochis, D. J., Harris, E., Müller-Germann, I., Ruzene, C., Schmer, B., Sinha, B., Day, D. A., Andreae, M. O., Jimenez, J. L., Gallagher, M., Kreidenweis, S. M., Bertram, A. K., and Pöschl, U.: High concentrations of biological aerosol
par-ticles and ice nuclei during and after rain, Atmos. Chem. Phys., 13, 6151–6164, doi:10.5194/acp-13-6151-2013, 2013.
Joly, M., Attard, E., Sancelme, M., Deguillaume, L., Guilbaud, C., Morris, C. E., Amato, P., and Delort, A.-M.: Ice nucleation ac-tivity of bacteria isolated from cloud water, Atmos. Environ., 70, 392–400, 2013.
Kruisz, C., Berner, A., and Brantner, B.: A cloud water sampler for high wind speeds, Proc. EUROTRAC Symp., 92, 523–525, 1992. Lindemann, J., Constantinidou, H. A., Barchet, W. R.. and Up-per, C. D.: Plants as sources of airborne bacteria, including ice nucleation-active bacteria, Appl. Environ. Microbiol., 44, 1059– 1063, 1982.
Lindow, S., Arny, D., and Upper, C.: Distribution of ice nucleation-active bacteria on plants in nature, Appl. Environ. Microbiol., 36, 831–838, 1978.
Maki, L. R., Galyan, E. L., Chang-Chien, M. M., and Caldwell, D. R.: Ice nucleation induced by Pseudomonas syringae, Appl. Environ. Microbiol., 28, 456–459, 1974.
Maki, L. R. and Willoughby, K. J.: Bacteria as biogenic sources of freezing nuclei, J. Appl. Meteorol., 17, 1049–1053, 1978. Masschalck, B. and Michiels, C. W.: Antimicrobial properties of
lysozyme in relation to foodborne vegetative bacteria, Crit. Rev. Microbiol., 29, 191–214, 2003.
Möhler, O., DeMott, P. J., Vali, G., and Levin, Z.: Microbiology and atmospheric processes: the role of biological particles in cloud physics, Biogeosciences, 4, 1059–1071, 2007,
http://www.biogeosciences.net/4/1059/2007/.
Morris, C. E., Georgakopoulos, D. G., and Sands, D. C.: Ice nucle-ation active bacteria and their potential role in precipitnucle-ation, J. Phys. IV, 121, 87–103, 2004.
Morris, C. E., Sands, D. C., Vinatzer, B. A., Glaux, C., Guilbaud, C., Buffière, A., Yan, S., Dominguez, H., and Thompson, B. M.: The life history of the plant pathogen Pseudomonas syringae is linked to the water cycle, ISME J., 2, 321–334, 2008.
Nemecek-Marshall, M., LaDuca, R., and Fall, R.: High-level ex-pression of ice nuclei in a Pseudomonas syringae strain is in-duced by nutrient limitation and low temperature, J. Bacteriol., 175, 4062–4070, 1993.
Phelps, P., Giddings, T. H., Prochoda, M., and Fall, R.: Release of cell-free ice nuclei by Erwinia herbicola, J. Bacteriol., 167, 496– 502, 1986.
Phillips, V. T. J., DeMott, P. J., and Andronache, C.: An empiri-cal parameterization of heterogeneous ice nucleation for multi-ple chemical species of aerosol, J. Atmos. Sci., 65, 2757–2783, 2008.
Pöschl, U., Martin, S. T., Sinha, B., Chen, Q., Gunthe, S. S., Huffman, J. A., Borrmann, S., Farmer, D. K., Garland, R. M., Helas, G., Jimenez, J. L., King, S. M., Manzi, A., Mikhailov, E., Pauliquevis, T., Petters, M. D., Prenni, A. J., Roldin, P., Rose, D., Schneider, J., Su, H., Zorn, S. R., Artaxo, P., and Andreae, M. O.: Rainforest aerosols as biogenic nuclei of clouds and precipitation in the Amazon, Science, 329, 1513–1516, 2010.
Pratt, K. A., DeMott, P. J., French, J. R., Wang, Z., Westphal, D. L., Heymsfield, A. J., Twohy, C. H., Prenni, A. J., and Prather, K. A.: In situ detection of biological particles in cloud ice-crystals, Nat. Geosci., 2, 398–401, 2009.
Pummer, B. G., Bauer, H., Bernardi, J., Bleicher, S., and Grothe, H.: Suspendable macromolecules are responsible for ice nucle-ation activity of birch and conifer pollen, Atmos. Chem. Phys., 12, 2541–2550, doi:10.5194/acp-12-2541-2012, 2012.
R Core Team: R: A Language and Environment for Statistical Com-puting, R Foundation for Statistical ComCom-puting, Vienna, Austria, available at: http://www.R-project.org (last access: 5 February 2014), 2011.
Repaske, R.: Lysis of Gram-negative bacteria by lysozyme, Biochim. Biophys. Acta, 22, 189–191, 1956.
Sands, D., Langhans, V., Scharen, A., and de Smet, G.: The associa-tion between bacteria and rain and possible resultant meteorolog-ical implications, Quart. J. Hung Meteorol. Serv., 86, 148–152, 1982.
Šantl-Temkiv, T., Gosewinkel-Karlson, U., Finster, K., and Munk Hansen, B.: The diversity and proportion of ice nucleation active bacteria in rain and their ability to produce extracellular ice nu-cleation active particles, 1460–1466, edited by: Smolik, J., and O’Dowd, C., Prague, Czech Republic, 2009.
Stephanie and Waturangi, D. E.: Distribution of Ice Nucleation-Active (INA) bacteria from rain-water and air, HAYATI, 18, 108– 112, 2011.
Stopelli, E., Conen, F., Zimmermann, L., Alewell, C., and Morris, C. E.: Freezing nucleation apparatus puts new slant on study of biological ice nucleators in precipitation, Atmos. Meas. Tech., 7, 129–134, doi:10.5194/amt-7-129-2014, 2014.
Turner, M. A., Arellano, F., and Kozloff, L. M.: Three separate classes of bacterial ice nucleation structures, J. Bacteriol., 172, 2521–2526, 1990.
Vaïtilingom, M., Attard, E., Gaiani, N., Sancelme, M., Deguillaume, L., Flossmann, A. I., Amato, P., and Delort, A.-M.: Long-term features of cloud microbiology at the puy de Dôme (France), At-mos. Environ., 56, 88–100, 2012.
Vali, G.: Quantitative evaluation of experimental results on the het-erogeneous freezing nucleation of supercooled liquids, J. Atmos. Sci., 28, 402–409, 1971.
Warneck, P.: Chemistry of clouds and precipitation, in: Chemistry of the natural atmosphere, edited by: Dmowska, R., Holton, J. R., and Rossby, H. T., Academic Press, San Diego, USA, 451–510, 1999.
Xia, Y., Conen, F. and Alewell, C.: Total bacterial number concen-tration in free tropospheric air above the Alps, Aerobiologia, 29, 153–159, 2013.
Yankofsky, S., Levin, Z., Bertold, T. and Sandlerman, N.: Some ba-sic characteristics of bacterial freezing nuclei., J. Appl. Meteo-rol., 20, 1013–1019, 1981.