HAL Id: hal-01987973
https://hal.uca.fr/hal-01987973
Submitted on 2 Feb 2021
HAL is a multi-disciplinary open access
archive for the deposit and dissemination of
sci-entific research documents, whether they are
pub-lished or not. The documents may come from
teaching and research institutions in France or
abroad, or from public or private research centers.
L’archive ouverte pluridisciplinaire HAL, est
destinée au dépôt et à la diffusion de documents
scientifiques de niveau recherche, publiés ou non,
émanant des établissements d’enseignement et de
recherche français ou étrangers, des laboratoires
publics ou privés.
A physical model of the bidirectional reflectance of
vegetation canopies. Part 2 : Inversion and validation
Bernard Pinty, M.M. Verstraete, R; E. Nickinson
To cite this version:
Bernard Pinty, M.M. Verstraete, R; E. Nickinson. A physical model of the bidirectional reflectance
of vegetation canopies. Part 2 : Inversion and validation. Journal of Geophysical Research, American
Geophysical Union, 1990, 95 (D8), pp.11767. �10.1029/JD095iD08p11767�. �hal-01987973�
A Physical Model of the Bidirectional Reflectance of Vegetation Canopies
2.
Inversion
and Validation
BERNARD PINTY 1
National Center for Atmospheric Research, Boulder, Colorado
MICHEL M. VERSTRAETE 2
Office for Interdisciplinary Earth Studies, University Corporation for Atmospheric Research, Boulder, Colorado
ROBERT E. DICKINSON
National Center for Atmospheric Research, Boulder, Colorado
A physically based, analytical model of the bidirectional reflectance of porous media was derived in a companion paper (Verstraete et al., this issue). This model is validated against laboratory and ground-based measurements taken over two vegetation covers, both in the visible and near-infrared spectral regions. An inversion procedure, based on a nonlinear optimization technique, is used to infer the intrinsic optical properties of the leaves, as well as information on the morphology of the canopies, that is, on the geometrical arrangements of these scatterers in space. The model is then used to generate theoretical bidirectional reflectances, using the values of the relevant parameters retrieved from the inversion procedure, and these values compare favorably with the actual observations over the entire range of illumination and observation angles. The values of the parameters retrieved from the inversion procedure are discussed, validated against actual independent measurements, and interpreted in terms of the physical and morphological properties of the vegetation covers.
1. INTRODUCTION
In a companion paper, Verstraete et al. [this issue] (here- inafter referred to as part 1) derived a new model of the bidirectional reflectance of a semi-infinite canopy. Based on a physical approach, this analytical model [part 1, equation (51)] expresses the bidirectional reflectance field of a semi- infinite canopy as a combination of functions describing (1) the optical properties of the leaves through their single- scattering albedo and their phase function, (2) the average distribution of leaf orientations, and (3) the architecture of the canopy, which can be interpreted in terms of the average
distance between the leaves in the vertical and horizontal
directions. If the above functions and the canopy parameters are known a priori, this model predicts the bidirectional reflec- tances over the upward hemisphere for arbitrary illumination and observation directions, and hence the directional hemi- spherical reflectance of the surface, also known as its albedo.
In the particular case of a canopy with no "hot spot"
component, and where the leaves are uniformly distributed, the single-scattering model fits the three-dimensional ray- tracing model developed by Kimes [1984] to better than one percent of the reflectance values, for various distributions of leaf orientations [Dickinson et al. 1990].
This paper addresses the inverse problem of retrieving the
1Permanently
at Laboratoire
Associ•.
de M•.t6orologie
Physique/
Observatoire de Physique du Globe de Clermont, UniversitY. Blaise Pascal, Aubi•re, France.
2Now at Department
of Atmospheric,
Oceanic,
and Space
Sci-
ences, University of Michigan, Ann Arbor.
Copyright 1990 by the American Geophysical Union. Paper number 90JD00036.
0148-0227/90/90JD-00036505.00
model parameters, starting from a sampling of the bidirec- tional reflectance field. Clearly, what is needed at this step is an economical, efficient, and yet accurate inversion proce- dure. The achievement of this step allows us to interpret satellite data, and to extract some basic information about the physical and the morphological properties of a vegetation canopy. However, before dealing with actual satellite data, it is appropriate to validate and to test the procedure (that is, the model plus the inversion) against well-processed data gathered at the ground level where the relative contribution of the atmospheric effects is lower and easier to remove. To our knowledge, only a few data sets match the requirements for a rigorous test of the inversion procedure. We selected two of these data sets: The first one is based on laboratory measurements of reflectances over a clover patch [Woessner and Hapke, 1987]; the second is based on ground level measurements of a soybean canopy [Ranson et al., 1984]. In both data sets, the bidirectional reflectance exhibits a marked hot spot effect which is of special interest here for reasons discussed in part 1.
2. DEVELOPMENT OF A PARAMETRIC MODEL
According to part 1, the bidirectional reflectance p of a
canopy illuminated by the Sun from a direction (01, 01), observed from a direction (02, 02), and normalized with
respect to the reflectance of a perfectly reflecting Lamber-
tian surface under the same conditions of illumination and
observation, is given by 60 K 1 p(01, 01; 02, 02)=-- 4 K•/.t2 + ß [Pv(g)P(g) + H(i.t •/• 1)H(kt2/•2) - 1] (1) 11,767
11,768 PINTY ET AL.' CANOPY REFLECTANCE, 2
where
/.1,1 = COS 01 /.1,2 = COS 02
cos g = cos 01 cos 02 + sin 01 sin 02 cos (qb•- qb2)
l+x
H(x) =
1 + (1 - •o)•/2x
In these equations, 0• and qb• are the zenith and azimuth
angles of the Sun, 02 and qb2 are the zenith and azimuth
angles of the observer, g is the phase angle between the incoming and the outgoing directions, •o is the average
single-scattering albedo of the particles making up the sur-
face, P(g) is the average phase function, K• and K2 describe
the leaf orientation distribution for the illumination and
viewing angles, respectively, and the term H(!•!/•:!)H(!•2/•:2) - 1 approximates the contribution from multiple scattering
[see Dickinson et al., 1990].
Pv(g) is the function that accounts for the joint transmis- sion of the incoming and outgoing radiation, and thereby also for the hot spot effect arising at low phase angle'
KI• 2 q- K2• 1 Pv(g) = exp ß •+ -eft
eft • G
exp - A+ exp • •2 /
•1•2
- exp - Ah (2) g•g2 whereG = [tan
2 0• + tan
2 02 - 2 tan 0• tan 02 cos (• - •2)] 1/2
a= 1-- b-
2rg2 2g•
r is the radius of the sun flecks on the leaves, and A is the le• area density of the canopy, a measure of the density of leaf
material.
Bidirectional reflectance data are often reposed as values
normalized by the reflectance of a Lambe•ian surface illu-
minated from the zenith. In this case, the theoretical expres- sion in (1) must be multiplied by g•. Unnormalized reflec- tance is given by multiplying (1) by g•/•.
In order to solve the inverse problem, a parametric version of the physical model must be derived. Conse-
quently, mathematical expressions expressing the phase
function for elementary scattering elements and the distri- bution of scatterer orientation have to be given. For the phase function, the frequently used empirical function intro-
duced by Henyey and Greenstein [1941] was chosen:
- 0 2)
P(g) (1
+ 0 2- 20
cos
•)3/2
(3)
where the scattering angle • = •- g, and O is the
asymmetry factor ranging from -1 (backward scattering) to + 1 (forward scattering).
A practical estimate of the average leaf orientation distri-
bution K can be obtained from the widely used parameter-
ization of Goudriaan [1977]'
Ki(ILi)
-- XIt
1 q-
XIt2/.t,
i
XIt
1 = 0.5 -- 0.6333X/-
0.33X•
(4)•2 = 0.877(1 - 2•1)
where i stands for 1 or 2, the two directions of illumination
and observation, and where -0.4 < XI < 0.6. Here, XI is
more negative (-0.4) for an erectophile canopy (mostly
vertical leaves), 0 for a canopy with a uniform leaf orienta-
tion distribution (equal probability for all leaf orientations), and more positive (0.6) for a planophile canopy (mostly
horizontal leaves). The parameter XI is a function of the leaf
angle distribution in the canopy:
F ,r/2
Xl--
ñJ I1
0-gL(Ol)l
sin
(Ol)
dog (5)
where Ol is the leaf zenith angle and gL(Ol) is the leaf angle
distribution. Two issues arise from the use of such a model.
First, in order to ensure a finite value for the reflectance,
very high precision computations must be done to evaluate the error functions in Pv(g). Although this is not a problem
on a supercomputer with access to good numerical libraries,
it nevertheless reduces the applicability of the model. More
serious, however, is the difficulty of inverting such a model; this is not impossible in principle, but the requirements for high accuracy computations, together with the rather com- plex nature of the model do not seem to encourage the general use of this model.
In order to make the joint transmission function more
tractable for inversion purposes, we develop an approximate
expression for P•(g), using some of the significant parame-
ters and variables of (2)'
1
P•(g) • 1 +
1 + Vt,(g
)
(6)Vp(g) = 4 1-
2rA t< 2Where r as the radius of the sun flecks on the '- •ncnned leaf.
This simple approximate expression has the advantages of
being computationally cheap, of being easy to invert on actual data, and of fitting the theoretical model described above with a good accuracy. This approximation was de-
rived for values of •'l and 2rA varying from -0.4 to 0.6, and from 0.01 to 2.0, respectively; for illumination and viewing
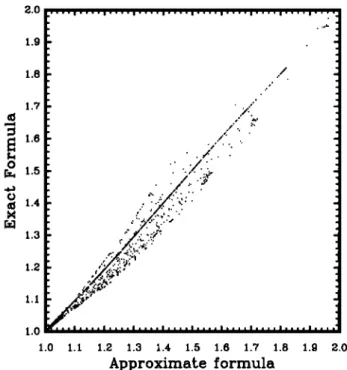
angles ranging between 0 ø and 60ø; and for a relative azimuth varying from 0 ø to 180 ø. As shown in Figure la, (6) fits the
exact formula to better than 5% in most cases when XI is
equal to 0.6 and 0.0. The worst disagreement, with an error reaching 12%, is observed (Figure lb) for an erectophile
canopy (that is, •'l = --0.4), when both 01 and 02 are greater
than 50 ø, for values of 2rA equal to or larger than 2.0. In practice, the numerical difference between the exact and the approximate formulae is smaller than the typical uncertain- ties in the observations. Furthermore, it appears that the sharpness of the hot spot phenomenon is controlled by the product 2rA for the range of variations we considered. Therefore, only one parameter (namely 2rA) instead of two is required to represent reasonably well the width of the hot spot, and this constitutes a supplementary advantage for
2.0 1.9 1.8 ../ ß 1.7 %..,' • ß
..,:'...
•
"';Z;•
O ':' ..' .' • 1.4 1.a ;' .":'•:ß
.•;••.-
:.
'",••
1.2
1.1
.••
1.0 ,,,I .... I .... I .... I .... I .... I .... I .... I .... z.0 z.z •.2 •.a •.4 •.5 z.6 •.7 •.8 z.• 2.0Approximate formula
Fig. la. Compaqson between the exact formulation for the P•(g) function with its approximate expression as given by (6), for two X• values of 0.6 and 0.0.
inversion purposes. Equation (6) has been built in order to
preserve most of the physics involved when deriving the joint transmission and the related hot spot phenomenon, and it can be seen that the sharpness of the hot spot is deter- mined by the ratio of the average radius of the sun flecks r to the typical length 1/A which is related to the typical distance
between the leaves.
In the end, the proposed parametric model describes the
bidirectional reflectance field of a canopy with the help of
four unknown parameters: to, X/, O, and 2rA. The inverse
2.0 1.9 1.8 1.7
1.6
1.5 1.4 1.3 1.2 1.1 1.0 1.0 1.1 1.2 1.3 1.4 1.5 1.6 1.7 1.8 1.9Approximat•e formula
Fig. lb. Same as Figure la, except for Xl equals -0.4.
2.0
problem consists in retrieving the values of these parameters
from a limited sample of bidirectional reflectances, assuming that (1) expresses the functional dependency of the reflected
field with respect to these parameters.
3. DESCRIPTION OF THE INVERSION PROCEDURE
Because of the high nonlinearity of (1), the inverse prob- lem must be solved by applying an iterative numerical
approach to determine the best values of the four parame- ters. The procedure adopted in this study is analogous to that
chosen by Pinty et al. [ 1989]. The basic requirement is to find
the four parameter
values
which
minimize/52
, defined
as
n
•j2_ Z [*Ok--*O(01,k,
(•l,k; 02,k,
(•2,k)]
2
(7)
k=l
where p& is the measured and p the modeled bidirectional
reflectance of the surface, for the relative geometry of
illumination
and observation
defined
by 0•,&, 4•,&, 02,&,
and
The nonlinear least squares fitting algorithm which is used to solve (7) was selected from the Numerical Algorithms
Group (NAG) library. The routine EO4JAF used here im- plements a quasi-Newton algorithm for finding a minimum of a function, subject to fixed upper and lower bounds on the
independent variables, using function values only. An initial
guess for each of the desired parameters must be provided to
the routine. The root mean square (RMS) of the fits, that is,
(152/nf)
•/2,
where
nf is the
number
of degrees
of freedom,
was
calculated to give an indication of the quality of the optimi-
zation.
A discussion of the performance of the procedure de-
scribed above can be found in the work by Pinty et al. [ 1989]. This includes results from a sensitivity study to the initial
guess, and a discussion of the impact of the angular sampling
frequency of the reflected field on the quality of the retrieval,
as well as of the quality of the inversion when data are
contaminated by a random noise. According to the results of
some new tests done with data generated from (1), it appears that the main conclusions of the sensitivity tests published in
this previous study are also valid here.
4. APPLICATION OF THE INVERSION PROCEDURE
Table 1 summarizes the sources, surface types, spectral
regions of measurements, and angular sampling frequencies
of the two data sets used here. Only part of the entire data set available from these sources was actually utilized. The first data set was chosen both because it contains a fairly well defined hot spot contribution, and because the mea- sured bidirectional reflectances were not contaminated by the contribution from additional atmospheric diffuse sources since the measurements were taken in a laboratory. The second data set tests the model under real atmospheric
conditions, and permits the validation of the inversion pro- cedure because the parameters describing the optical prop-
erties of individual leaves and their orientation in the canopy
were measured independently in addition to the bidirectional
reflectances.
The inversion procedure described in section 3 was ap-
plied to these two observational data sets. In each case, the
values of the four unknown parameters retrieved from the
11,770 PINTY ET AL.' CANOPY REFLECTANCE, 2
TABLE 1. Data Set Descriptions
Data Set Source
Spectral Bands of
Cover Type Measurements 01, deg 02, deg • = qb2 - qbl, deg Woessner and Hapke [1987] clover patch 0.448/am
2 Ranson et al. [1984] soybean 0.5-0.6/am, 0.6-0.7/am 0.7-0.8/am, 0.8-1.1 /am 0, 60 0-80, each 0, 180 10 ø 44, 55, 61 0, 7, 15, 22 0-360, nonuniform 30, 45, 60
regenerate the theoretical bidirectional reflectance values under the illumination and observation geometries at the
time the data were obtained. This was performed indepen-
dently for each illumination angle where data were collected, and the direct calculation (that is, modeling the bidirectional parameters) was applied to estimate the bidirectional reflec- tances at all illumination angles.
4.1. Laboratory Measurements: Data Set 1
The bidirectional reflectance field of a clover (Trifolium
repens) patch was measured in the laboratory by Woessner
and Hapke [1987]. Detailed information on the apparatus
and the design of the experiment can be found in the work by Woessner [1985]. The measurements were taken only in the
principal plane (that is, the plane defined by the direction of
illumination and the normal to the surface) with the viewing angle varying as indicated in Table 1. Reflectance from a normally illuminated halon sample (polytetrafluoroethylene powder) was used as a standard for the measurements.
The bidirectional reflectance data gathered at 0 ø of illumi-
nation were inverted with (1), using the procedure described
in the previous section. The values of the four model parameters retrieved from the optimal fit of this equation, as well as the RMS, are summarized in Table 2. The value of
close to 0.1, lies in a range which can be expected from
measurements made at 0.448 /am, where strong absorption
occurs. A significant backward component is observed in the phase function, which is not generally observed over vege- tation. For instance, Dickinson et al. [1990] reported that grass leaves behave more or less like isotropic scatterers. The value of Xt is indicative of a canopy with a quasi-uniform leaf orientation distribution; however, in the absence of any
measurements or observations on the canopy morphology, a
detailed discussion of the retrieved Xt values is not possible.
These measurements exhibit a rather sharp hot spot, which
is reflected in the small value of the parameter 2rA.
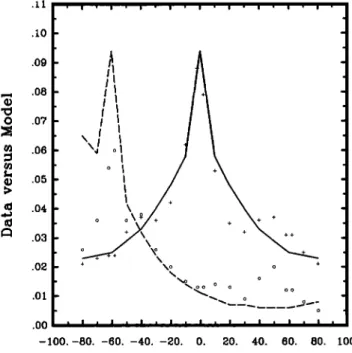
Figure 2 shows the comparison between the bidirectional
reflectances modeled with (1), using the optimally fitted
parameters, and the whole data set. It must be emphasized
TABLE 2. Values of Parameters as Retrieved From Observations Over a Clover Patch
Parameter Value
Solar zenith angle 0 ø
•o 0.099
Xl 0.115
© -0.392
2rA 0.277
RMS of fit 0.0065
here that the inversion was performed using only data collected
at an illumination angle of 0 ø. The four model parameters
retrieved by this procedure were then used to generate the
reflected radiances at both 0 ø and 60 ø. The patterns present in
the data at both angles of illumination are well reproduced by
reflectances is, as expected, better at 0 ø of incidence where the hot spot effect is fairly well reproduced.
For both angles of illumination, disagreement occurs at viewing angles between 40 ø and 60 ø, where data display some variations not accounted for by the model. This behavior might be due to the fact that only a few leaves were seen by the sensor, rather than a large ensemble of leaves, and
therefore measured reflectance is more sensitive to the
detailed structure of the leaves in the patch. The general
pattern of the reflectances at 60 ø of incidence is reasonably well predicted. The value of the parameter 2rA, which determines the width of the hot spot phenomenon, has been estimated at 60 ø from the value retrieved at 0 ø, using (55) of part 1. The model overestimates the measured reflectance values either in the hot spot region, or when the viewing angle is equal to -80 ø . Furthermore, when comparing the results of the model inversion on data at 60 ø to those at 0 ø, it
.10 .09 .08 .07 .06
ø0õ
.04 .03 .02 .0! .oo -lOO.-8o. -60. -40. -20. o. 20. 40. 60. 80. lOO.Viewing Angle in the principal plane
Fig 2. Comparison between the bidirectional reflectances mea- sured over a clover patch at 0.448/am and those modeled with (1), using optimally fitted parameters. Pluses indicate data points for illumination at 0 ø zenith angle; open circles are for illumination at
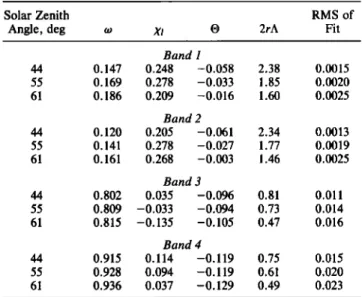
TABLE 3. Values of Parameters as Retrieved From
Observations Over a Soybean Canopy
Solar Zenith RMS of
Angle, deg w Xl • 2rA Fit
Band 1 44 0.147 0.248 -0.058 2.38 0.0015 55 0.169 0.278 -0.033 1.85 0.0020 61 0.186 0.209 -0.016 1.60 0.0025 Band 2 44 0.120 0.205 -0.061 2.34 0.0013 55 0.141 0.278 -0.027 1.77 0.0019 61 0.161 0.268 -0.003 1.46 0.0025 Band 3 44 0.802 0.035 -0.096 0.81 0.011 55 0.809 -0.033 -0.094 0.73 0.014 61 0.815 -0.135 -0.105 0.47 0.016 Band 4 44 0.915 0.114 -0.119 0.75 0.015 55 0.928 0.094 -0.119 0.61 0.020 61 0.936 0.037 -0.129 0.49 0.023
appears that the parameter 2rA is the one that undergoes the
largest relative variation. Since the hot spot is characterized
by a strong and sudden increase in reflectance at small phase
angles, even a slight error in the measurements can lead to a
significantly different values of the parameter controlling the width of this hot spot.
4.2. Ground-Based Measurements: Data Set 2
The measurements of Ranson et al. [1984] over a full-
coveting soybean canopy were also used here because of the
quality and extent of agronomical observations made in addition to the reflectances. The percent ground cover, the
mean height of the plants and the leaf area index were 99%,
104 cm and 2.9 --- 0.4, respectively. Although we used the subset of measurements relative to a full and mature soybean
canopy, the row planting effects are still detectable at low
solar zenith angles. The immediate consequence of this row architecture is a significant azimuthal asymmetry with re- spect to the principal plane. In order to minimize this
alignment effect, we applied our model only to data taken at
solar zenith angles greater than 44 ø . At the remaining three solar angles, the azimuthal asymmetry was small enough to
justify the use of data collected on both sides of the principal
plane as if they had been acquired on the same side. This procedure allowed us to increase the sampling in azimuth.
This latter process was necessary to retrieve the hot spot
component which, depending on the leaf sizes and arrange- ments, occurs on a very narrow range of phase angles.
Since these measurements were taken in situ, the purely bidirectional properties of the surface are smoothed in the data by the contribution of the atmospheric diffuse radiation. Neglecting the contribution due to the multiple interactions between the surface and the atmosphere, the measured bidirectional reflectances R can be expressed following Pinty et al. [1989]: R(Ol, 02, •)= p(Ol, 02, •) + ½)- p(0, (8) where fd(01) = • Ea(O • Et(01)
•0
•'12
•0
2
•'
Ed(00 = ld(O•, 0', •') sin O' cos O' dO' d•'
)(O1, 02, •)= p(O', 02, •')/•(01, 0', •')
d0 d0
ß
sin
0'
cos
0'
dO'
d•'•[Ea(Ol)]
-1
In these equations, • is the relative azimuth between the
incidence and observation planes, and 0' and •' are dummy
integration variables, p is the bidirectional reflectance pre- dicted by (1) for the direct beam, fa is the ratio of diffuse over
total irradiance, I a is the diffuse atmospheric radiance, E a is
the total atmosphe•c d•use i•adiance, E t is the total •adi- ance, and • is the angul• average of the bid•ectional reflec- tance p wei•ted by the d•use i•adiance. Equation (8) can be
easily inte•reted: the obse•ed bid•ectional reflectance R
equals the bid•ectional reflectance for d•ect radiation p when either there is no d•use radiation (fa = 0) or when the surface is Lambe•ian (p = •). When neither of these conditions is
re•ized, the uneven •umination &om d•use sky radiation conta•nates the measurements, and (8) expresses the co•ec- tion needed to account for these effects. In this context, Tanr•
et al. [1983] suggested expressing g as follows:
g(O1, 02, •)= ap(O•, 02, •) + b (9)
where the coefficients a and b are estimated &om radiative
transfer calculations using various realistic surface proper-
ties and typical atmosphe•c conditions. As a first approxi-
mation, and according to the results of Tanr• et al. [1983],
we assumed that the published values of a and b de•ved for savanna at 0.45 •m and 0.85 •m, respectively, were repre-
sentative of values for a vegetation canopy, on both sides of
the 0.7-•m wavelength. The above treatment of the diffuse
•adiance d•ers &om the one previously used by Pin• et al. [1989] and Dickinson et al. [ 1990] where an isotropic behavior was assumed for this atmosphe•c d•use component.
As explained above, the inversion procedure was applied independently for each solar zenith angle and, in each case, the retrieved model parameters were introduced in (1) to regenerate the observed data. Table 3 gives the values of the two optical and of the two geometrical model parameters, leading to a good prediction of the canopy reflectance in the four spectral bands. At a solar zenith angle of 44 ø, and with
bands 3 and 4, some cases of nonconvergence were encoun-
tered in trying to invert the data with the optimization procedure. Since the hot spot parameter value was derived
independently at the two other solar angles, we provided this
information to the inversion procedure which was run again
on the observational data in order to retrieve the values of
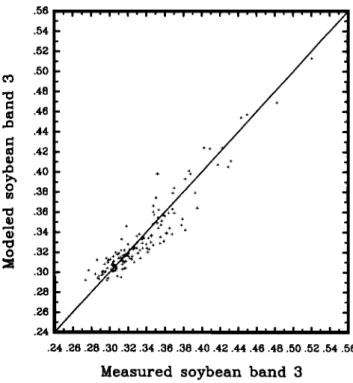
the three remaining model parameters, namely w, Xt, and O. The compa•son between the data and the modeled reflec- tances is shown separately in Figures 3a through 3d for the four spectral bands. The agreement is found to be good (most of the points are within •5% of the reflectance values), even
thou• the bidirectional reflectances v• widely over the
hemisphere. The bulk of the discrepancies can be explained in
11,772 PINTY ET AL.' CANOPY REFLECTANCE, 2 .080 .075 .07O .065 .060 .055 .050 .045 .040 .035 +++ + + + + + + .•. ++ ++ + + + + + + .030 .030 .035 .040 .045 .050 .055 .060 .065 .070 .075 .080
Measured soybean band 1
Fig 3a. Comparison between bidirectional reflectances mea- sured over a soybean canopy in band 1 (0.5-0.6/am) and modeled with (1), using optimally fitted parameters.
assumption of azimuthal symmetry with respect to the princi-
pal plane), or as a result of the correction used to remove the
contribution of the atmospheric diffuse radiation. In the visible
spectral bands, we used the atmospheric data collected by
Ranson et al. [1984] to specify
the value of f,/. In the near
infrared bands, because
atmospheric
data were missing,
we
selected values offd that are consistent both with those in the
visible bands, and with the spectral dependency of the pre-
dicted f,/by models.
o o .56 .54 .52 .50 .48 .46 .44 .42 .40 .38 .36 .34 .32 .30 .28 .26 .24 .24.26.28.30.32.34.36.38.40.42.44.46.48.50.52.54.56
Measured soybean band 3
Fig 3c. Same as Figure 3a, except in band 3 (0.7-0.8/am).
The sensitivity of the results with respect to the parameter
fa was investigated using the data collected in band 1 at 55 ø of illumination. From the results shown in Table 4, it appears
that the best fit to the data is obtained
when f,/ = 0, which
implies that there is no diffuse radiation coming from the sky. Since this result is obviously wrong, we conclude that the analytical expression describing the contribution of the
atmospheric diffuse radiation to the observed bidirectional
reflectances is not good enough. In other words, when the
inversion
procedure
is required
to estimate
the value offa in
.070 .75 .065 .060 .055 .050 .045 .040 .o35 .030 + ** 4- + 4- ++ + + .025 .025 .030 .035 .040 .045 .050 .055 .060 .065 .070
Measured soybean band 2
Fig 3b. Same as Figure 3a, except in band 2 (0.6-0.7/am).
.7o
re .55
.50
: +. + •+
.40
ß 40 .45 .50 .55 .60 .65 .70 .75
Measured soybean band 4
Fig 3d. Same as Figure 3a, except in band 4 (0.8-1.1 /am).TABLE 4. Sensitivity of Model Parameters With Respect to fd Value (01 = 55 ø) f d to ,¾t •9 2rA RMS of Fit 0.0 0.159 -0.136 -0.013 2.66 0.197 x 10 -2 0.1 0.163 -0.004 -0.018 2.35 0.198 x 10 -2 0.2 0.166 0.129 -0.025 2.09 0.200 x 10 -2 0.3 0.169 0.264 -0.032 1.87 0.203 x 10 -2 0.4 0.172 0.407 -0.041 1.69 0.207 x 10 -2 0.5 0.175 0.563 -0.051 1.55 0.213 x 10 -2
addition to the four canopy parameters, the retrieved value offd is zero or very close to zero. Camillo [ 1987] obtained a
similar result. Consequently, the contribution from the dif-
fuse sky radiance must be provided, since its correct value
cannot be derived from the inversion of bidirectional reflec-
tances. The parameters relative to the geometry of the
canopy appear to be the most sensitive to the values of fd
over the range of values considered here. Significant changes
are also likely to occur even with an absolute variation of 0.1
in the fa value. An interesting feature is that the hemispher-
ical reflectance
(that is, the albedo) is increasing
with re.
Although the dependency between the two is not very
strong, one could conceivably provide the measured albedo value and thereby constrain the optimization procedure in
finding the best fa value. The inversion procedure might be
run simultaneously on the bidirectional and the hemispheri-
cal reflectances observed in the field.
4.2.1. Leaf optical properties. In each spectral
band,
the optical parameters of the scattering elements, namely,
the single-scattering albedo w and the phase function param-
eter O, vary within a realistic range. For the visible bands (1 and 2), O is very close to zero, indicating quasi-isotropic scatterers, while the values of w retrieved in the near- infrared bands (3 and 4) exhibit a slight but systematic
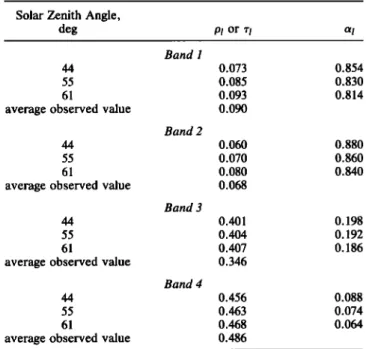
tendency for a backward scattering component. These two optical parameters can be combined to estimate the hemi-
spherical reflectance Pl, transmittance •t, and absorptance •1
of individual leaves. The retrieved values are given in Table 5, along with the values reported by Ranson et al. [1984],
who measured Pl and •t at the same time as the bidirectional
reflectances. For the sake of this comparison, we assumed
that the leaves were isotropic, and the Pl and •t values given
by Ranson et al. were averaged together. The values pre- dicted as indicated above agree quite well with the indepen- dent measurements, the worst case being for band 3 where measured leaf reflectances are about 0.35, while our pre-
dicted value is closer to 0.40. These results clearly demon- strate that the inversion procedure is able to retrieve the basic leaf optical properties with a very good accuracy, and
therefore validate the model developed in part 1, as well as
the parameterization described in section 2. It is imperative to properly account for the hot spot phenomenon. Otherwise the inversion procedure would yield a rather strong and
unrealistic backscattering component in order to compen-
sate for the latter effect. This would lead to unrealistic values
of the hemispherical optical properties of the leaves. The absorption factors we derived show a systematic decrease with increasing solar zenith angle in Table 5. At this point,
and because of a lack of direct measurements of this quantity with a varying illumination angle, it is difficult to know whether the observed variation is genuine or results from a weakness of the inversion procedure we used.
TABLE 5. Comparison Between Retrieved and Measured Optical Parameters on a Soybean Leaf
Solar Zenith Angle,
deg Pl or •'l
Band 1
44 0.073 0.854
55 0.085 0.830
61 0.093 0.814
average observed value 0.090
Band 2
44 0.060 0.880
55 0.070 0.860
61 0.080 0.840
average observed value 0.068
Band 3
44 0.401 0.198
55 0.404 0.192
61 0.407 0.186
average observed value 0.346
Band 4
44 0.456 0.088
55 0.463 0.074
61 0.468 0.064
average observed value 0.486
4.2.2. Canopy geometry. As expressed by (5), Xt de- scribes the average orientation of the leaves in the plant canopy. The values of Xl retrieved in the visible bands differ
significantly from those retrieved in the near-infrared bands:
In the former case, the average value of Xl is equal to 0.248 --+ 0.03 indicating predominance of horizontal leaves, while in the latter case, the average value of -0.009 --+ 0.08
is typical of a quasi-spherical canopy.
Using (5), the actual XI value for the canopy can be estimated from the separate measurements of leaf angle distribution reported by Ranson et al. [1984]. The values of
Xl derived from these measurements show slight variations
with height in the canopy, but are always greater than zero in each canopy layer, and the estimated Xt for the entire canopy is equal to 0.245. This global value matches very well the one
derived independently from the bidirectional reflectances in
bands 1 and 2 and indicates a predominance of horizontal leaves within the soybean canopy. This information appears to be lost or diluted when inferring the value of Xl from the
bidirectional reflectances measured in bands 3 and 4. Vari- ous reasons can be invoked to explain this result. Among
others, one may emphasize the fact that the functions H(x) which describe the multiple scattering in the canopy assume
isotropic scatterers. If there was a significant departure from
this case, the inversion procedure might find a value of Xl
optimized to compensate for this weakness of the model.
Another potential problem is the assumption of a one scat- ter-type canopy, whereas some additional scattering may be due to stems and pods. This latter contribution is relatively more important in spectral regions where high-order multi- ple-scattering events occur.
Table 3 seems to indicate that the parameter 2rA varies
spectrally for a given illumination angle. However, since this
parameter depends only on the morphology of the canopy, one would not expect such a dependency. As expressed in (1), information about the hot spot is only contained in the
singly scattered radiation: adding multiple-scattering effects
11,774 PINTY ET AL.' CANOPY REFLECTANCE, 2
to the total signal. For example, when the solar zenith angle
is 44 ø, the contribution of the function Pv(g) to the total
signal
is between
30% and 40% in band 4, and between
80%
and 97% in band 1. Thus, for near-infrared bands the hot spot parameter is more difficult to infer from the inversion procedure. In order to examine the relative importance of the value given to the 2rA parameter in the near-infrared bands, we performed an additional inversion where 2rA was fixed at the value derived from the visible bands, so that the inversion procedure was optimizing the values for the three remaining model parameters. The values we retrieved in that
way are 0.902, 0.063, and -0.090 for to, •, and ©, respec-
tively. These values are very close to those given in Table 3. Consequently, using the value of 2rA inferred from the visible bands as an input parameter to regenerate the bidi- rectional reflectances observed in band 4 leads to very small differences with the bidirectional reflectances that we gener- ated using Table 3 parameter values. For the particular angular sampling used over the soybean canopy, the mean deviations between the two sets of predicted reflectances are limited to the region where the relative geometry of obser- vation is the most favorable for retrieving the hot spot parameter (g - 8.5ø), but even for this particular set of angles, the reflectances are changed by less than 2%. Be- cause of the undersampling of the reflectance field at phase angles close to zero, it is clear that an underestimation in the measurement less than 5% at small phase angles is sufficient to explain the spectral variations observed in the 2rA.
Assuming that A is constant with depth in the canopy, it was
shown in part 1 that, at a given illumination angle 01, the
parameter 2rA can be related to canopy parameters as follows:
2rA = 2r0 (10)
where r is interpreted as an average value of the radius of the
sun flecks over a finite depth Y t and r0 is the radius of the
hole between the leaves at the top of the canopy. Equation (10) can be used to examine the dependence of 2 r A with
respect to 0•, and it can be easily shown that
IK1]
1/2I
.•.__•11
1/2
(2rA)0,
= (2rA)00
.Z-
(11)
L•AooL•3o,
where (2rA)0
ø expresses
the hot spot
parameter
for a nadir
illumination. When applying (11) to each 2rA value given in
Table 4, it appears
that (2rA)00
is still varying
with 0•,
questioning the validity of (10) and (11) for the particular canopy we study. A careful analysis of the canopy geometry measurements reported by Ranson et al. [1984] reveals that the assumption we made above about a A constant with depth in the canopy is not justified. Indeed, although the plants were overlapping, there was still a macrostructure in the uppermost canopy layers due to the approximate spher-ical shape of the plants. As mentioned earlier in this paper,
this causes a slight but detectable azimuthal asymmetry in the principal plane, but also indicates that some volumes at the top of the canopy are scatterer free. For the same reasons invoked in part 1, the macrostructures in the canopy due to the plant stand geometry should lead to a hot spot phenomenon superimposed on that resulting from the can- opy microstructures defined by the free spaces between the leaves. Consequently, the leaf area density increases with depth, and the typical surface area of sun flecks a decreases
with depth at a rate larger than that assumed in (10). As a first approximation, it appears from the values in Table 3 that the parameter 2rA can be normalized at a nadir illumination
with a simple
cos 0• factor,
in which
case
we find (2r A)00
=
3.3 in the visible spectral bands.
Since data were acquired with a ground resolution larger than the nominal distance between the plant rows (the row spacing was 76 cm), the macrostructures described above participate in the hot spot phenomenon. Using simple geo- metrical considerations, one can verify that the ratio of the typical horizontal distance between the plants to the typical vertical depth free of scatterers between the plants is signif- icantly greater than 1 (in fact the value should be of the order of 3 to 5). Since we showed before that this ratio is related to the value of 2rA, the presence of these macroscale structures may explain the large values inferred from the inversion procedure in bands i and 2. The immediate consequence of such a large value is a very broad hot spot component in the
bidirectional reflectance field. A more detailed discussion of
the value of 2rA would require the consideration of a canopy model with a double-peaked distribution in the parameter r, in order to account for the effects of multiple scales in the canopy morphology. However, the validation of the results would also require additional canopy geometry measure- ments which are difficult to get.
5. GENERAL CONCLUSION
In this work, a model for predicting bidirectional reflec- tance patterns over a semi-infinite and homogeneous me- dium has been developed. Although special emphasis was placed on the case of a vegetation canopy, the model has a broader range of application, including bare soil surfaces. To some extent, the present model is a generalization of the previous model proposed by Hapke [1981, 1986]. The ana- lytical solution which has been derived depends on the intrinsic optical properties of the scatterers and on parame- ters describing the canopy geometry. Basically, the solution is established as a combination of four functions, namely, a generalized Lommel-Seeliger law type, a scatterer phase function, a backward scatter function resulting from the non- independency in the transmissions of the incident and the reflected radiation (it is this function that describes the hot spot phenomenon), and a function describing the contribution due to the multiple scattering occurring inside the medium.
The theoretical expression developed in part 1 has been successfully inverted with laboratory and field bidirectional reflectance data. It was shown in this paper that the inversion procedure is able to retrieve the four model parameters de- scribing both the optical properties of the leaves and their geometrical arrangements within the vegetation canopy. Data set 1 was used to show that the model can fairly well predict the bidirectional reflectance patterns, including a well defined hot spot component. The validation of the values of the optical and geometrical parameters retrieved by the inversion procedure was achieved with data set 2. This was made possible because the average leaf orientations, as well as the leaf reflectance and transmittance factors, were measured simultaneously with the bidirectional reflectances of the canopy.
It has been shown that the optical properties of the scatterers conditioning the spectral variations of the bidirec- tional reflectance of a vegetation canopy can be inferred with good accuracy from remotely sensed data. This conclusion
holds true for the morphological properties of the canopy when using bidirectional reflectances collected at wavelengths shorter than 0.7 tam. Beyond this wavelength, green leaves exhibit a strong reflection factor which adds a significant multiple-scattering contribution to the measured bidirectional reflectance, making the inverse problem poorly conditioned at such wavelengths. Since the information regarding the canopy morphology can be efficiently extracted from the single- scattering component of the signal, we suggest these canopy properties can be retrieved from data taken at short wave- lengths, and then used as an input when performing the inversion with bidirectional reflectances taken at longer wave- lengths. In other words, it appears valuable to have some a priori knowledge about the canopy morphology before invert- ing data at near-infrared wavelengths to retrieve the optical properties of the scatterers.
The simplicity and accuracy of this bidirectional reflec- tance model makes it a good tool for bidirectional reflectance modeling, but also for the physical interpretation of mea- sured bidirectional reflectance fields. Such a model helps define a common model usable by the remote sensing community, as well as by the modeling community. Its application extends to the definition of a "best observing geometry," as well as to the investigation of the "minimum data set needed," which are both crucial in future in situ experiments and spaceborne missions. This model can be easily coupled with an atmospheric radiative transfer scheme to investigate the consequences of the masking effects of the atmosphere on the bidirectional reflectance pattern measured by satellites. With respect to satellite data, a promising result derived from the theory is that the information regarding the canopy geometry is mainly con- tained in the backward angular component of the canopy scattering. To the extent that aerosols obey the Mie scatter- ing theory and exhibit a strong forward scattering compo- nent, the sensitivity in the retrieval of the geometrical model parameters with respect to the aerosol amount and detailed properties should be minimized over the angular domain
where backward reflection occurs.
Because the inversion of remotely sensed data is generally an ill-posed and ill-conditioned problem, in situ measure- ments providing some a prior knowledge on the observed
medium become important. As •Shown throughout this paper,
the field measurements, in addition to the reflectance mea- surements, can be used both for validation and for interpre- tation purposes. For instance, on the one hand, the hemi- spherical reflectance and transmittance leaf factors were
used to validate the to and © values retrieved from the
inversion procedure, and on the other hand, the detailed measurements of leaf area index were used to interpret physically the hot spot parameter in terms of a typical distance between the plant stands. The amount of a prior knowledge about the ecosystems that is desirable depends on the purpose and extent to which satellite data are going to
be interpreted in physical terms. An estimation of the leaf
area index (LAI) would be useful, for instance, for surface energy budget calculations, but for this specific objective, the canopy architecture, as expressed through the hot spot parameter might be useless. As discussed in part 1, the LAI
cannot be retrieved from measurements in the visible and
near-infrared wavelengths, unless the soil reflectance con- tributes to the signal emerging at the top of the canopy, which in turn means that the canopy is not "semi-infinite"
for that spectral band. More work is needed to address the realistic case of heterogeneous media with small LAI values, and the case of sparse vegetation.
The study we presented in part 1 and in this paper constitutes a significant improvement in the quantitative characterization
of surface ecosystems from remotely sensed data, mainly
because the physically based expression we derived can be inverted in a rather economical and efficient way. This is particularly significant because the amount of satellite data will continue to increase in the future, and because there is an urgent need for introducing satellite-derived information in general circulation models in order to address various climate change issues.
Acknowledgments. B. Hapke and D. Ranson kindly provided the laboratory and field data sets mentioned in the paper, respec- tively. We also thank Jeffrey Privette for his help in producing the figures. This research would not have been possible without the financial support of the European Space Agency (ESA), the Centre National pour la Recherche Scientifique (CNRS), and the National Center for Atmospheric Research (NCAR) for B.P. Partial financial support for M.M.V. and R.E.D. was provided by NASA under grant NASA-S-56469. The National Center for Atmospheric Research is operated by the University Corporation for Atmospheric Research under the sponsorship of the National Science Foundation.
REFERENCES
Camillo, P., A canopy reflectance model based on an analytical solution to the multiple scattering equation, Remote Sens. Envi- ron., 23,453-477, 1987.
Dickinson, R. E., B. Pinty, and M. M. Verstraete, Relating surface albedos in GCMs to remotely sensed data, Agric. For. Meteorol., in press, 1990.
Goudriaan, J., Crop micrometeorology: A simulation study, report, Wageningen Cent. for Agric. Publ. and Doc., Wageningen, The Netherlands, 1977.
Hapke, B. W., Bidirectional reflectance spectroscopy, 1, Theory, J. Geophys. Res., 86, 3039-3054, 1981.
Hapke, B. W., Bidirectional reflectance spectroscopy, 4, The ex- tinction coefficient and the opposition effect, Icarus, 67, 264-280,
1986.
Henyey, L. G., and T. L. Greenstein, Diffuse radiation in the galaxy, Astrophys. J., 93, 70-83, 1941.
Kimes, D. S., Modeling the directional reflectance from complete homogeneous vegetation canopies with various leaf orientation distributions, J. Opt. Soc. Am., 1,725-737, 1984.
Pinty, B., M. M. Verstraete, and R. E. Dickinson, A physical model for predicting bidirectional reflectances over bare soil, Remote Sens. Environ., 27, 273-288, 1989.
Ranson, K. J., L. L. Biehl, and C. S. T. Daughtry, Soybean canopy reflectance modeling data sets, Tech. Rep. 07158, 22 pp., Lab. Appl. Remote Sens., Purdue Univ., West Lafayette, Ind., 1984. Tanr6, D., M. Herman, and P. Y. Deschamps, Influence of the atmosphere on space measurements of directional properties, Appl. Opt., 22,733-741, 1983.
Verstraete, M. M., B. Pinty, and R. E. Dickinson, A physical model of the bidirectional reflectance of vegetation canopies, 1, Theory, J. Geophys. Res., this issue.
Woessner, P., A study of the polarization of light scattered by vegetation, M.S. thesis, 91 pp., Univ. of Pittsburgh, Pittsburgh, Pa., 1985.
Woessner, P., and B. Hapke, Polarization of light scattered by clover, Remote Sens. Environ., 21,243-261, 1987.
R. E. Dickinson and B. Pinty, National Center for Atmospheric Research, P.O. Box 3000, Boulder, CO 80307.
M. M. Verstraete, Department of Atmospheric, Oceanic, and Space Sciences, University of Michigan, Ann Arbor, MI 48109.
(Received July 13, 1989; revised December 26, 1989;