HAL Id: hal-00296106
https://hal.archives-ouvertes.fr/hal-00296106
Submitted on 11 Jan 2007
HAL is a multi-disciplinary open access
archive for the deposit and dissemination of
sci-entific research documents, whether they are
pub-lished or not. The documents may come from
teaching and research institutions in France or
abroad, or from public or private research centers.
L’archive ouverte pluridisciplinaire HAL, est
destinée au dépôt et à la diffusion de documents
scientifiques de niveau recherche, publiés ou non,
émanant des établissements d’enseignement et de
recherche français ou étrangers, des laboratoires
publics ou privés.
atmospheric mercury at Ny-Ålesund (79° N), Svalbard,
spring 2002
J. Sommar, I. Wängberg, T. Berg, K. Gårdfeldt, J. Munthe, A. Richter, A.
Urba, F. Wittrock, W. H. Schroeder
To cite this version:
J. Sommar, I. Wängberg, T. Berg, K. Gårdfeldt, J. Munthe, et al.. Circumpolar transport and
air-surface exchange of atmospheric mercury at Ny-Ålesund (79° N), Svalbard, spring 2002. Atmospheric
Chemistry and Physics, European Geosciences Union, 2007, 7 (1), pp.151-166. �hal-00296106�
www.atmos-chem-phys.net/7/151/2007/ © Author(s) 2007. This work is licensed under a Creative Commons License.
Chemistry
and Physics
Circumpolar transport and air-surface exchange of atmospheric
mercury at Ny- ˚
Alesund (79
◦
N), Svalbard, spring 2002
J. Sommar1, I. W¨angberg2, T. Berg3, K. G˚ardfeldt1, J. Munthe2, A. Richter4, A. Urba5, F. Wittrock4, and W. H. Schroeder6
1Department of Chemistry, G¨oteborg University, Kemiv¨agen 4, 41296 G¨oteborg, Sweden 2IVL Swedish Environmental Research Institute, P.O. Box 47086, 40258 G¨oteborg, Sweden 3Norwegian Institute for Air Research (NILU), P.O. Box 100, 2027 Kjeller, Norway
4Institute of Environmental Physics, University of Bremen, NW1, Otto-Hahn-Allee 1, 28359 Bremen, Germany 5Ecological Spectroscopy Laboratory, Institute of Physics, Gostauto 12, 2600 Vilnius, Lithuania
6Environmental Canada: Meteorological Service of Canada, 4905 Dufferin Street, Toronto, Canada
Received: 27 October 2003 – Published in Atmos. Chem. Phys. Discuss.: 19 March 2004 Revised: 5 December 2006 – Accepted: 7 December 2006 – Published: 11 January 2007
Abstract. Mercury in different environmental compartments has been measured at Ny- ˚Alesund (78◦54′N, 11◦53′E) dur-ing an intensive campaign, 17 April to 14 May 2002. Time-resolved speciated determination of mercury in the atmo-sphere and snow was conducted at the Norwegian research station at the Zeppelin mountain, 474 m above the sea level, and at the Italian research facility Dirigibile Italia, 12 m above the sea level. Total Gaseous Mercury (TGM) was present in the range <0.1 to 2.2 ng m−3 during the cam-paign. Three mercury depletion events, identified as periods with decreased TGM concentrations, were observed. At the lower altitude, TGM concentrations following such events were found to exhibit both higher magnitude and larger vari-ability in comparison to results from the Zeppelin station. Oxidised mercury species in air and fall-out with snow as well as mercury attached to particles were also measured and their concentrations were found to be anti-correlated with TGM in air. concentrations of total Hg in snow (Hg-tot) showed a large (∼15×) increase in response to Gaseous El-emental Mercury Depletion Events (GEMDEs, range 1.5– 76.5 ng L−1). Solid evidence for photo-stimulated emissions
of Hg0(g) from the snow pack in conjunction to depletion events were obtained from gradient measurements as well as from flux chamber measurements. Steep diurnal concen-tration variations of Hg0(aq) in surface seawater were also found to concur with changing solar radiation. The con-centration of Hg0(aq) in seawater was found to be in the range 12.2–70.4 pg L−1, which corresponds to supersatura-tion. Hence, the seawater surface constituted a source emit-ting elemental mercury. The concentrations of RGM (reac-tive gaseous mercury), Hg-p (particulate mercury), and BrO
Correspondence to: J. Sommar
(sommar@chem.gu.se)
column densities (detected by DOAS) were very low except for a few individual samples during the major Hg0depletion event. BrO vertical column densities obtained by the remote satellite ESR-2 and trajectory analysis indicate that the air masses exhibiting low Hg0 concentrations originated from areas with high BrO densities.
1 Introduction
Among the metals emitted to the atmosphere from natural, industrial and combustion processes, highly toxic mercury is unique as being mainly released in its gaseous elemen-tal state (Hereafter, assigned Hg0(g) or Gaseous Elemental Mercury, GEM). The semi-volatility of other environmen-tally relevant mercury compounds (e.g. HgCl2, CH3HgCl)
further underlines the atmophilic character of mercury. The latter oxidative state of mercury (e.g. mercuric compounds alternatively denoted HgI I) has moderate residence times
and a higher affinity to condensed phases. The apparently passive pollutant Hg0(g) is distributed on a global scale, ex-hibiting intra-hemispherical and vertical uniformity with a gradient of ∼25% over the inter-hemispherical convergence zone (Schroeder and Munthe, 1998). Monitoring of mercury at global atmospheric watch mid-latitude stations does not currently reveal any consistent trend in tropospheric mercury load and a weak seasonality (Munthe and Palm, 2003). The seasonal cycle of boundary-layer airborne mercury in Polar Regions is however distinctly different from that observed at mid-latitude background sites (Ebinghaus et al., 2002) which has led to a considerable interest during the last 5 years. As tropospheric transport is a major channel for the distribution of mercury (Brosset, 1982; Lindqvist and Rodhe, 1985), the
high level of mercury contamination present in the Arctic en-vironment suggests an enhanced atmospheric sink strength here (e.g. due to the depositional mechanism and/or by the fractional composition of airborne mercury). The possibil-ity that mercury undergoes “global distillation” (Goldberg, 1975) was suggested by Lantzy and MacKenzie (1979) and was further investigated by Mackay et al. (1995). For mer-cury, temperature-driven processes have however been sug-gested to be less important (Lindberg et al., 2002).
Dramatic boundary Ozone Depletion Events (ODEs) oc-cur in the Arctic and Antarctic during and after polar sunrise (Barrie et al., 1988). These events cannot be explained by changing meteorology alone and occur when the atmosphere is in a chemically perturbed condition. The main chemi-cal mechanism of the ODEs is believed to be a halogen-catalysed process. Volatile Br(I) species can be absorbed by fresh, partly frozen sea salt particles at low temperature (<253 K) more efficiently than to aqueous droplets. Ensuing are hydrolytic dark reactions such as hypobrominous-halide disproportionation to volatile diatomic elemental or inter-halogens, which can undergo photo dissociation (Adams et al., 2002). Formation of Br2 is normally prevalent for
rea-sons of thermo-chemical equilibria (Air-water distribution and aqueous complexation) and furthermore its actinic ab-sorption extends out to longer wavelengths than Cl2 and
BrCl. The relative importance of the Br2photo-dissociation
channel for the production of free halogen atoms is thus in-creased at high solar zenith angles. The multi-phase environ-ment required for a “bromine explosion” (Ravishankara and Longfellow, 1999; Wennberg, 1999) suggests elevated con-centrations especially close to relevant frozen surfaces, such as “frost flowers” (Rankin et al., 2002). Ozone is under such circumstances destroyed:
Br(g) + O3(g) → BrO(g) + O2(g) (1)
During daytime, the self-reaction BrO+BrO is competitive to photolysis only at high BrO levels. The latter processes reform Br(g) with unity quantum yield while photolysis and possible cross reactions (e.g. BrO+ Aldehydes/HO2) to
var-ious extent produce reservoir compounds. As long as ozone is not completely depleted, most Br atoms react with ozone sustaining the BrO level to a certain extent.
Simultaneously with the modulation of the atmospheric ozone content, many other trace substances, among these Hg0(g) vary considerably indicating the influence of reac-tive halogen species (Schroeder et al., 1998). Hg0 deple-tions (GEMDEs) cannot be quantitatively explained by the action of atomic chlorine in the gas-phase even if the reac-tion rate is set at diffusion-controlled limit (Sommar, 2001). A recent determination of the Hg+Cl reaction yielded a rate of (1.0±0.2)×10−11cm3s−1 which corresponds to 10% of the diffusion controlled limit (Ariya et al., 2002). Concern-ing the reaction Hg0(g)+BrO(g), H¨onninger (2002) estimated the lower limit for the reaction rate from field experiments to kHg+BrO≥3.7×10⁻¹⁴cm3s−1. Raofie and Ariya (2003)
report further constraints on kHg+BrO≤1 ×10⁻¹³cm3s−1.
Boudries and Bottenheim (2000) postulated from hydrocar-bon “clock” measurements that BrO radicals (x=1) rather than bromine atoms (x=0) oxidise atomic mercury to form molecular mercury products according to Reaction (2). Hg0(g) + BrOx(g) → Products (2)
Assuming prompt formation of HgO(g), reaction (2, x=1) ap-pears improbable using thermo-chemical arguments (Shepler and Peterson, 2003; Sommar, 2001; Tosell, 2003). How-ever, insertion product complexes like HgBrO are strongly bound and therefore feasible products (Balabanov and Pe-terson, 2003). Based on relative rate determinations of the homogeneous gas-phase reaction between Hg0+Br the fol-lowing rate coefficient, k=(3.2±0.5)×10−12cm3s−1was ob-tained (Ariya et al., 2002) and the authors proposed that this reaction may explain Arctic Gas Elemental Mercury Deple-tion Events (GEMDEs). In Malcolm et al. (2003) typical oxi-dation rates of Hg0(g) in the MBL have been listed for a large number of oxidants also including BrO and ClO using previ-ously unpublished kinetic data from Batelle Inc. The impor-tance of the Hg0(g)+ClO(g) reaction in the perturbed Polar
atmosphere and elsewhere suggested by Stutz et al. (2002) have less support in Malcolm et al. (2003). Likewise a the-oretical prediction of the homogeneous rate coefficient for the reaction Hg0+ClO→HgO+Cl at elevated temperatures (400◦K<T<1800◦K; 1 atm) by Xu et al. (2003) resulted in a relatively low value of ∼5×10⁻¹⁹cm3s−1at 273◦K (Arrhe-nius form: k∼2.29×10⁻¹² exp(−4183/T) cm3s−1). Hg0(g) is currently categorised into the families of compounds (e.g. C2H2and ozone) modulated by bromine species as a key
ox-idant during depletions (Bottenheim et al., 2002; Lindberg et al., 2002). Although exhibiting disparate physico-chemical properties, the uniform temporal behaviour of GEM and O3(g) in connection with depletions in the surface layer is
striking. We are aware that during the Antarctic summer, a persistence in elevated concentrations of molecular diva-lent oxidative state mercury products in the gaseous phase (usually denoted RGM; for a discussion see Schroeder et al., 2003) has been reported and suggested to be controlled by HOx classes rather than reactive halogenated species
(Sprovieri et al., 2002; Temme et al., 2003).
GEMDEs have been observed to occur annually often repetitively throughout maritime circumpolar stations: Alert, Ellesmere Island (Schroeder et al., 1998), Barrow, Alaska (Lindberg et al., 2002), Nord, Greenland (Skov et al., 2002), Neumayer, Queen Maud’s Land (Ebinghaus et al., 2002), Ny- ˚Alesund, Spitzbergen (Berg et al., 2003), Terra Nova Bay, Victoria Land (Sprovieri et al., 2002) and apparently in the Siberian Arctic (Golubeva et al., 2003; Steffen and Schroeder, 2002). At sub-polar latitudes, H¨onninger (2002) in co-laboration with Poissant and co-workers presents mea-surements of GEMDEs at 55◦N surrounded by seawater ice in Hudson Bay. Stutz et al. (2002) propose that GEMDEs
take place over saline dry lakes in mid-latitudes. The obser-vations made throughout the Arctic and Antarctica suggest that GEMDEs occur over large spatial scales and can thus be considered as analogues to ozone holes.
The atmosphere-surface partitioning behaviour appears however to be more complex possibly involving physico-chemical controls at the interface. While gradients of ozone are present in surface air/interstitial snow air suggesting a sink mechanism at the boundary between air, ice and water, a reversible red-ox balance may well be in control for mer-cury in snow which will strongly adjust its mobility. HgI I deposited as a result of Hg0depletion events is chemically (photo)labile toward reduction in the snow, hence to a certain extent transformed into Hg0(aq) and ventilated to the atmo-sphere (Lalonde et al., 2002; Schroeder et al., 2003; Steffen et al., 2002). Moreover, GEMDEs correspond to short lived polar night ODEs that have been speculated to derive from local-driven chemistry (Foster et al., 2001). Since air-surface exchange and redox processes occurring in the condensed phase seem to be of prime importance, models describing only gas-phase processes cannot be used to evaluate atmo-spheric mercury budgets over snow-covered surfaces.
Being a high priority toxic element with diametrically op-posite physico-chemical properties of the environmentally relevant oxidative states (e.g. Hg0/HgI I), efforts to
esti-mate its atmospheric mass balance (e.g. perform specia-tion/fractionation of airborne mercury in the field) during GEMDEs are of crucial importance. When comparing re-sults of measurements of airborne mercury species during GEMDEs at different stations, it is evident that a closure of airborne mercury mass balance is not achieved. This is concordant with the strong tendency of RGM or mercury at-tached to existing particles (Hg-p) to undergo physical re-moval during transport. In terms of quantity and composi-tion, the transient mercury groups discussed above tend in Hg0(g)-depleted air masses to be site specific (Lindberg et al., 2002; Lu et al., 2003; Steffen et al., 2002; Temme et al., 2003). In some cases, the air masses are almost truly free from mercury while frequently the transient products are de-tected at elevated mixing ratios composing up to ∼90% of the Total Gaseous Mercury (hereafter abridged TGM, for a definition see below) load present in background air.
In this paper, we report and discuss results from the Nor-wegian high Arctic. The research area at Ny- ˚Alesund is lo-cated about 1300 km from the North Pole (cf. Fig. 1) and was established for long-term monitoring of airborne mer-cury in 1994. In 2000 high-time resolution measurement were started that allowed the identification of mercury de-pletion events (Berg et al., 2001, 2003). In addition, sam-pling of mercury in various other environmental compart-ments has been undertaken (Berg et al., 2001). Pongratz and Heumann (1998) have performed studies of the methylated mercury species (e.g. monomethylmercury, CH3HgX:
here-after Methyl-Hg and dimethylmercury: (CH3)2Hg) produced
in the sea by different macro algae. They proposed that
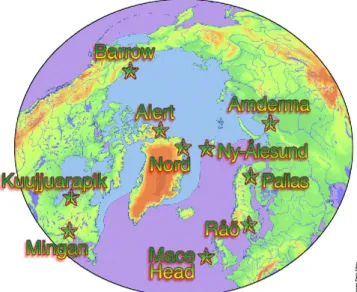
bio-Fig. 1. Some Arctic and sub-Arctic mercury sampling locations
including long-time monitoring, and average distribution of 50% sea ice in April.
genic very toxic (CH3)2Hg can be released from the sea
sur-face and contribute to the polar atmospheric load of mercury (Pongratz and Heumann, 1999). Ozone destruction halogen catalysts XO have been found in mixing ratios up to a few tens of ppt during ODEs at this location since 1995 (X=Cl; e.g. Tuckermann et al., 1997; X=Br; e.g. M¨uller et al., 2002; X=I, e.g. Wittrock et al., 2000). ODEs at Ny- ˚Alesund coin-cide with elevated mixing ratios of XO essentially only for X=Br. The role of X=Cl is much less clear and X=I appar-ently lacking correlation. The corresponding integrated con-centrations of atomic halogens have been estimated during ODEs (Cl∼1010s cm−3 and Br∼1012s cm−3) using
hydro-carbon “clock” measurements (Ramacher et al., 1999; Sol-berg et al., 1996). In a recent historical survey of the tem-poral and spatial occurrence of ODEs, Tarasick and Botten-heim (2002) report the incidence of ODEs an order of mag-nitude lower at Ny- ˚Alesund (together with e.g. Neumayer) compared to Alert. It has been suggested that the relative low frequency of ODEs at Ny- ˚Alesund is to some extent re-lated to its local topography and the presence of open oceanic water (Lorenzen-Schmidt et al., 1998).
The purpose of this study was to provide further quan-titative information on mercury in different environmental compartments including air, snow and seawater during polar spring and extend the database of GEMDEs. To contribute to the knowledge, we have conducted time-resolved speci-ated determination of mercury in the atmosphere and snow at two altitudes. At the sea level, we focused on collecting data for gas-transfer calculations over snow and sea surfaces. In addition, this paper includes an analysis of meteorological and BrO data obtained by using multiple remote platforms (ground-based as well as satellite-based) and an assessment
of how these factors influence the evolution of signatures in various samples collected during the campaign. Information needs/data gaps recognized at the first international Arctic at-mospheric mercury research workshop 26–28 August 2002 will be addressed and discussed (Schroeder et al., 2003).
2 Experimental section 2.1 Sampling location
Experiments were performed during an intensive campaign (17 April to 14 May 2002) in the presence of 24-h daylight at three locations within the Ny- ˚Alesund International Re-search and Monitoring Facility. This establishment (78.9◦N, 11.9◦E) is situated at the southern shore of Kongsfjorden on the West Coast of Spitzbergen in the Norwegian high Arctic (Fig. 1) and is partly surrounded by mountains with peaks of 1000–1500 m altitude. It is situated about 15 km from the northern-most Barents Sea. An offshoot of the waning Gulf Current (West Spitzbergen current) causes ice-free con-ditions along the west coast of Spitzbergen during the entire year. Sea ice was in-turn dominant north of a border approxi-mately demarcated by latitude ∼80◦N and longitude ∼10◦E (Fig. 1). When covered by ice, the local climate is however modulated to be more continental by the adjacent fjord. In connection with low-lying cloud cover, the presence of dis-tant open water was discernible by noticeably darker skies over water. General large-scale circulation is steered by the Iceland low and the high-pressure systems over Greenland and the Arctic Ocean, forcing warm and humid air from the North Atlantic ocean along cyclone tracks to the Barents sea. The large differences in air temperature between air masses of Arctic or Atlantic origin cause large fluctuation in weather conditions at Ny- ˚Alesund. Positive phases of the North At-lantic and Arctic oscillations have recently created warming anomalies of circumpolar continental areas that partly are compensated by cooling over the northern North Atlantic. An overall descending tendency in the thickness and area ex-tent of sea-ice is observed e.g. in the Arctic Ocean’s Atlantic layer. Owing to positive feedbacks, greenhouse warming has been proposed to be amplified in the Arctic yielding season-ally increased precipitation.
Samples of airborne mercury and mercury in snow were taken at the Global Atmospheric Watch monitoring observa-tory operated by the Norwegian Institute for Air Research (NILU) at Zeppelinfjellet (474-m a.s.l). From the Zeppelin mountain Station (ZS, 78◦54′42′′N, 11◦55′30′′E), there is a steep downhill slope to the north towards the settlement situated at 2-km distance. South of ZS is also a slope whereas there are higher mountain peaks in the east and west. This channels the local wind into either of the upslope di-rections, north-northwest and south-southeast (Beine et al., 2001). The station is typically positioned well above fre-quent ground inversion of the fjord valley (Braathen et al.,
1990). Air and snow sampling were also carried out downhill at 12-m a.s.l. close to the Italian Consiglio Nazionale delle Ricerche (CNR) Base Arctica “Dirigibile Italia” (DI). The air sampling at this location comprised vertical gradient mea-surements at two heights and flux chamber meamea-surements on the snow surface. The extensive snow pack in the experi-mental area is seasonal (usually melted by end of June) and has maritime characterisation with numerous layers of aged snow. Surface seawater samples were collected in Kongfjor-den close to or offshore the settlement when manageable by jolly boat.
2.1.1 Sampling and analytical protocols Airborne mercury
Ambient TGM
Ambient air point samples were collected and analysed with automised instruments. In addition to the stationary Tekran (Model 2537A) gas-phase mercury vapour analyser at Zeppelin, two other Tekran (Model 2537A) instruments were employed to measure TGM. The abbreviation TGM refers to gaseous elemental mercury (GEM) and small contributions of other gaseous mercury species (<1% at ambient conditions) that may pass through the sampling line and be detected as Hg0(Schroeder et al., 1995; Temme et al., 2003). The TGM measurements were made according to the well-established method with a 0.45 µm front particle filter. The stationary instrument was also equipped with a heated sampling line.
Prior to moving to other sampling sites the instruments were calibrated using manual injections of known amounts of Hg0(g) from a Tekran 2505 mercury vapour source. The nominal settings of each Tekran’s internal permeation tube were verified within a few %. The internal calibration systems were further used on a daily basis for calibration during the campaign. The instruments were operated in continuous mode at 1.5 L min−1 sample flow rate and with 5 min sampling intervals. The detector response to standards automatically invoked from the internal permeation source showed a high degree of stability from calibration to calibra-tion. Succeeding this exercise, the instruments were in-turn intercalibrated for ambient air with their respective inlet tubes during ∼40 h, spanning over a concentration range from <0.1 ng m−3to ambient background.
Transient mercury fractions RGM and Hg-p
RGM and Hg-p were sampled by collection on KCl-coated denuders (Landis et al., 2002; W¨angberg et al., 2003a; Xiao et al., 1997) and on filters (Berg et al., 2001; W¨angberg et al., 2003b), respectively. An automated unit using sequential sampling of RGM and fine Hg-p (nominal cut-off 3 µm, f-Hg-p) was mounted on the roof of the
Zeppelin station ∼2 m above ground and connected through a heated line to a Tekran 2357A analyser. The transient mer-cury forms were concentrated and analysed with 1.5-h time step after thermal conversion to Hg0(g), enabling separate quantification after transfer to the Tekran instrument. The temperatures and flows through the sampling components in quartz were controlled by a set of furnaces, pumps and fans programmed by a Set point Programmer. The programme was triggered by a signal from a Tekran 1120 Standard Ad-dition Controller. Special attention was payed the reduction of the partitioning of mercury to the walls of the sampling inlet (Ariya et al., 2002; Landis et al., 2002; Sommar et al., 1997) by treating the surfaces with a perhalogenated carbon product. Based on 3σ of the sample blank, the Detection Limit (DL) of RGM and f-Hg-p was estimated to be ∼2 and ∼5 pg m−3, respectively. The fraction of f-Hg-p was typically below the DL and this result will not further be commented. Manual denuders for RGM sampling with lower time resolution were also used. Two manual denuders were used in parallel. The denuders were contained in protective housings thermostatted to 40◦C during sampling. The two sampling systems were identical except that one of the samplers was equipped with Teflon grid inlet. Manual RGM sampling was conducted at ZS in the beginning of the campaign and later moved to DI. Total Hg-p (TPM) was collected at ZS using glass fibre filters according to Berg et al. (2001). Each filter sample was exposed during 1–3 days. All concentrations given are dimensioned to resemble mass of Hg0m−3at STP (0◦C and 1013 hPa). Time reported is in UTC (Co-ordinated Universal Time).
2.1.2 Tropospheric BrO
Daily averaged BrO Vertical Column Densities obtained from the GOME instrument were used to interpret the mercury observations. The GOME is a UV/VIS double monochromator spectrometer with a spectral range of 240– 793 nm and a resolution of 0.2 nm (λ<400 nm) and 0.4 nm (λ>400 nm), respectively. The instrument operates onboard ERS-2, which is on a sun-synchronous orbit since April 1995 (Burrows et al., 1999). BrO columns are retrieved from the measured radiances using the well-known Differential Op-tical Absorption Spectroscopy (DOAS) technique. Details on the BrO retrieval can be found in Richter et al. (1998). Ground-based zenith sky UV/VIS – DOAS measurements are also continuously performed at Ny- ˚Alesund (Wittrock et al., 1996). Since March 2002, the instrument has been up-graded to observe not only the zenith-sky, but also directions close to the horizon. By combining zenith-sky and horizon measurements, some information on the vertical distribution can be retrieved, and the sensitivity to boundary layer BrO explosions is much enhanced (Wittrock et al., 2003). Un-fortunately, the instrument was not operational on 22 April, thereby missing part of the large depletion event observed during the campaign.
2.1.3 Mercury in snow
Snow samples were collected by the removal of the upper-most surface layer of the snow pack with a Teflon funnel on a daily basis and brought indoors where they were al-lowed to melt into acid cleaned 125 ml volume Teflon bot-tles. Moreover, no specific precipitation-segregated sampling was performed. Each sample was preserved by adding 0.5 ml HCl (Merck, Suprapur). All samples were analysed for total mercury (Hg-tot; Bloom and Crecelius, 1983) and a few for methyl-Hg (Lee et al., 1994).
2.1.4 Mercury in seawater
Surface seawater samples from Kongsfjorden were collected from a small boat or from a landing using an acid cleaned Teflon bottle of 1.3 L volume. The bottle consisted of a 1.0 m long tube with 4 cm inner diameter. The container was equipped with a glass frit in the bottom and had two functions, both sample collector and impinger. Each water sample was immediately transported to the nearby labora-tory where 0.5 L of the sample was extracted for Dissolved Gaseous Mercury (hereafter denoted: DGM ≈Hg0(aq)) dur-ing 60 min usdur-ing purified inert gas (0.3 L min−1). The
ex-tracted elemental mercury was collected on an Au-trap con-nected to the outlet at the top of the tube. The Au-trap was heated to 40◦C to avoid condensation of moisture. The Au traps were analysed using the standard dual amalgamation and CVAFS detection technique. Detailed information about the procedure, its efficiency and reproducibility is found in G˚ardfeldt et al. (2002).
In some cases part of the seawater were transferred into 125 ml volume acid cleaned Teflon bottles before DGM extraction. The samples were preserved with HCl (see Sect. 2.2.3.) and transferred to IVL in Sweden for analysis of Hg-tot.
2.1.5 Methods for mercury flux estimations Gas-exchange model
A gas-exchange model (Wanninkhof, 1992) was used to estimate mercury evasion fluxes from the sea. The model requires TGM and DGM concentrations and water temperature and wind speed as the input parameters. Further parameterisation was made following the principles reported in G˚ardfeldt et al. (2003).
Vertical gradient measurements and flux chamber mea-surements of TGM
Vertical gradient concentration measurements of TGM were performed at 20 and 180 cm above the snow sur-face. A teflonised three-way magnetic valve synchronised with the instrument’s preconcentration cycle was used
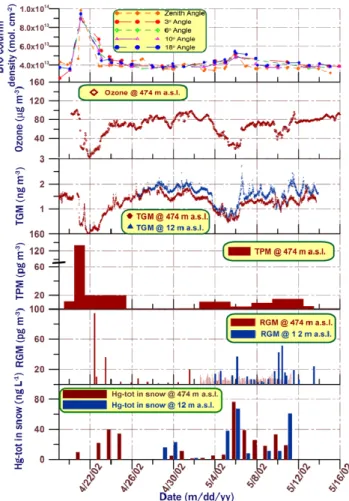
Fig. 2. Temporal trend of column densities of tropospheric BrO (a),
concentrations of ozone at 474-m a.s.l. (b) and of fractions of mer-cury at two altitudes in different environmental compartments (c–f). Time-intervals without samples are present in the lower (d–f) Pan-els. The whole duration of a TPM sample is included in panel (d), while the column bars in (e–f) are centred at the mid-time for a sample. All measurements are shown. The BrO column density measurements from ground-based platform successfully captured the very on-set of the major GEMDE and its early recovery phase but unfortunately were non operational during the incidence of the truly GEM depleted air (Hg0(g)<0.1 ng m−3).
enabling periodic alternate sampling from each level with a Tekran 2537A instrument.
Flux chamber measurements were made over the snow surface adjacent to the gradient measurements. The dynamic flux chamber (DFC) was made of FEP Teflon after a proto-type from Oak Ridge National Laboratories (Kim and Lind-berg, 1995). An external aluminium frame supported the rectangular, open-bottom chamber 60×20×20 cm3. The flux was estimated using Eq. (3):
F=Qx(Cout−Cin)/A (3)
where Q is the total airflow rate pulled trough the chamber by means of a pump connected to the chamber wall. The inlet
air enters 20 cm above the snow surface through a port oppo-site to the pump side of the chamber. A is the snow surface covered by the chamber. Coutand Cincorresponds to the Hg
concentration leaving and entering into the chamber, respec-tively. These two concentrations were measured in sequence using one Tekran 2537A operating in continuous mode with sampling intervals of 5 min. The measurements were initi-ated by a blank check where the chamber was placed on a FEP Teflon film. After some time when sufficiently low Cout
-Cin values were obtained the measurement was started by
putting the chamber on a flat snow plot. The blank procedure was repeated twice during the measurements after which the chamber was relocated on a fresh snow surface. The temper-ature in the ambient surface snow as well as that within the DFC was probed with embedded thermocouples in the snow. The sensors were connected to a mini meteorological logger (Skye Datahog 2 type SDL 5360).
2.1.6 Meteorological parameters
Meteorological parameters and surface ozone at ZS were measured by NILU (accessible via the Norwegian Institute for Air Research, see http://www.nilu.no/niluweb/services/ zeppelin/). Extensive sets of meteorological data collected adjacent to DI and vertical profiles of ozone and tempera-ture above Ny- ˚Alesund were kindly provided by the German Alfred-Wegener Institute for Polar and Marine Research. The temporal behaviour of TGM and ozone were investi-gated by calculating (1[X]/1t) ratios. Relative removal rates were calculated using Eq. (4), where [X]1denotes the
concen-tration of TGM at time t1etc.
1 log[X] 1t =
log([X]2/[X]1)
t2−t1
(4) Back trajectories were obtained using the Hybrid single-particle lagrangian integrated trajectory (HYSPLIT) model. The calculations were made interactively using the FNL meteorological datasets, which is provided on the web by Air Resources Laboratory, National Oceanic & Atmospheric Administration after permission (http://www.arl.noaa.gov/ ready/hysplit4.html). The stability of the back trajectories was verified by expanding the starting area or by calculating at different ending heights.
3 Results and discussion
3.1 Variability of local point ozone and local vertically re-solved point TGM observations
Time-series of TGM measured at two altitudes are shown in Fig. 2c. Two depletion events (GEMDEs) are clearly de-picted. The first and major episode was only measured from ZS, while the following GEMDEs were sampled at both ZS and DI. TGM dropped to undetectable levels in the first and
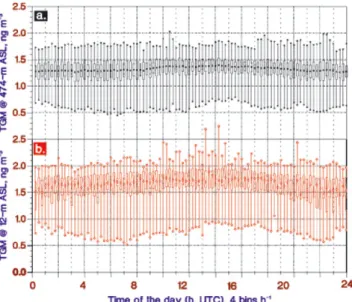
Fig. 3. Diurnality of TGM concentrations measured at Zeppelin
Station (a) and Dirigibile Italia (b). The assemblies include the overlapping TGM data-sets shown in Fig. 2c. The mean, the upper and lower 95% confidence intervals and extremes are shown for 15 min per bin diurnally integrated samples.
major event and below 0.5 and 0.9 ng m−3, respectively, dur-ing two minor events. The major depletion is characterised by a very fast decrease in TGM; within 24 h the concentration changed from ∼1.6 ng m−3to <10 pg m−3. It is obvious that there also exist other significant spike-dip-like features in the TGM record in-between depletions. During the period be-tween the polar sunrise 2002 and the start of the campaign, no major GEMDE was recorded with the stationary instrument at Zeppelinfjellet. As shown in Fig. 3a, the corresponding probability distribution of TGM is strongly left-skewed by events of low GEM influencing the arithmetical mean con-centration (1.15 ng m−3). The annual TGM mean at the site is 1.4–1.5 ng m−3as derived from measurements made dur-ing recent years (Berg et al., 2001, 2003).
In addition to TGM, ozone was also measured at ZS. The complete ozone concentration-time series is shown in Fig. 2b while Fig. 4a displays the data confined to the major ODEs. The TGM and ozone data sets were compared as 709 paired hourly mean values. They were found to be correlated with maximum positive cross-correlation (R>0.9) for a time lag of <1 h. For ambient air data measured by two autonomous instruments, the correlation is very high, but a similar re-semblance has been obtained at other polar sites (Schroeder et al., 1997; Temme et al., 2003). By solely including the depletion periods even higher positive 1-h correlation coef-ficient was obtained (R∼0.98). The Zeppelin station is situ-ated over or at least at the top of the marine boundary layer. The time series of the TGM measurements at 12 m a.s.l. and 474 m a.s.l. are altogether highly correlated as one can
antic-[t]
Fig. 4. Local surface meteorological and chemical composition data
for the major mercury depletion event.
ipate. Conversely to invariant gradients generally observed during GEMDE’s, considerable concentration difference be-tween the stations was often observed successive to deple-tions (Fig. 2c). During the period 6–8 May the TGM values at DI exhibit a more than fivefold higher variance in com-parison to that of ZS. The substantially larger variability in TGM data from DI is illustrated in Fig. 3, where the diur-nal variation in TGM at DI and ZS is depicted in a Box and Whiskers diagram. The mean, the upper and lower 95% confidence intervals and extremes are shown for 15 min per bin diurnally integrated samples. The assembled data for DI shows a further distinct maximum around noon, which is in-fluenced by a few days of TGM concentration peaks well above 2.0 ng m−3. Usually no time lag in the concentration variations was monitored. However during the observed de-pletions, the recovery phase appear to start earlier at the sea level. The vertical spatial gradient in TGM and its tempo-ral development is likely to be due to re-emission of mer-cury from the snow surface, an effect that is enhanced by
Fig. 5. Diel resemblance in shortwave global solar radiation as well
as of Dissolved Gaseous Mercury (DGM) in seawater. The blue extended line represents the saturation level of DGM at sub-zero water temperature and a TGM concentration of ∼1.6 ng m−3.
restricted mixing of air on a micrometeorological scale. Sim-ilar seasonal and altitudinal ozone measurements have been performed by Lorenzen-Schmidt et al. (1998). In contrast to TGM, there is no evidence for emission from the snow-pack to the atmosphere concerning ozone.
3.2 Compositional change of mercury during and after in-cidence of GEM depletions
3.2.1 Airborne transient mercury fractions
Concentration-time series of RGM at two altitudes and TPM at ZS are shown in Figs. 2e and d, respectively. The concen-trations measured were in the range <2–95 pg m−3for RGM and <1–140 pg m−3for TPM. Except for a few samples dur-ing GEMDEs the concentrations of these fractions generally were very low (median mixing ratios present in the sub-ppq (parts-per 1015)). The highest values were measured in
con-nection to the first depletion. The sum of RGM and TPM cor-responds to 16% of the TGM loss inferred. During GEMDEs year 2000, elevated levels of RGM and TPM also were ob-served in ozone-depleted air masses received at ZS. The cor-responding concentrations extended to 12 and 47 pg m−3, re-spectively, but corresponded only to up to a few percent of TGM normally present in ambient air. The previous mea-surements also showed that RGM and TPM generally are low at ZS with concentrations often below 10 pg m−3(Berg et al., 2001, 2003; Lu et al., 2003).
Within the week of 6 to 12 May, during the two minor GEM depletion events, matching RGM measurements at two altitudes were undertaken. The RGM measured at the higher altitude showed a modest variability around typical back-ground concentrations while the parallel variance was signif-icantly (F-test, P <0.01) larger at DI and the anti-correlation with TGM during GEMDEs more substantial.
3.2.2 Mercury in snow and seawater
The result from mercury analysis of snow samples, collected at two altitudes (ZS and DI), is shown in Fig. 2f. While Methyl-Hg was consistently undetectable (<0.06 ng L−1)
during the period, time series of total mercury (Hg-tot) presents a moderate maximum during the major GEMDE and becomes highly episodic during the minor events with peaks as high as 77 ng L−1. The strong peaks during the period 5 to 11 May are related to snowfall events. The highest values were obtained during the second depletion in conjunction to snowfall, which started in the late afternoon of 5 May. Two snow samples were collected that day, as shown in Fig. 2f. The ZS sample was collected before the snowfall started and contained small amounts of mercury. The DI sample was collected approximately one hour after the snowfall started and contained high amounts of mercury (∼15-fold increase). Hence, this observation clearly indicates that the mercury ar-rived with the snow.
Some surface water samples from Kongsfjorden were col-lected during 10–11 May and analysed for Hg-tot. Quite high Hg-tot arithmetic mean concentrations were determined (2.1±1.5 (1σ ) ng L−1, n=5). This value can be compared with 0.8 ng L−1as reported as the corresponding mean for filtered water samples (0.45 µm pore size) collected at the same site during summer (Pongratz and Heumann, 1998). It is likely that the high concentrations observed here are due to deposition of snow enriched in mercury originating from GEMDEs. Only a few other Hg-tot data for Arctic waters have been published (Coquery et al., 1995, “Arctic coastal waters of northern Siberia”).
Surface water samples for analysis of dissolved gaseous mercury (DGM) were also collected at Kongsfjorden. Time series of the DGM concentration during 8–14 May is shown in Fig. 5. A strong diurnal concentration variation is dis-played; ranging from 12 to 70 pg L−1. The variation in DGM is clearly linked to solar radiation, which suggests photolytic reduction of oxidised mercury species in the surface water. The DGM values correspond to a supersaturation of 40– 480% as estimated using Henry’s Law coefficients valid at low water temperatures (G˚ardfeldt et al., 2003).
3.2.3 Evasion of volatile mercury from snow and water sur-faces
As discussed above in Sect. 3.1., the observations of di-urnal patterns in the surface TGM concentration indicates a light-dependent evasional flux from condensed surfaces. These processes were further investigated by flux measure-ments using the DFC technique as well as vertical gradi-ent measuremgradi-ents over snow plots outside DI. As shown in Fig. 6b, an accumulation of TGM was generally reached in the air passing through the DFC. This corresponds to mid-day peak emissions of up to 70 ng m−2h−1 as calculated from Eq. (3). Elevated fluxes were observed contiguous to
Fig. 6. Comparison of (a) surface snow temperature within and
out-side the DFC, respectively, and (b) TGM concentrations in ambient air and air passing through the DFC, respectively.
enhanced deposition events during the two latter GEMDEs. The average DFC-flux obtained is ∼8 ng m−2h−1. It should be noted that blank tests and repositioning of the cham-ber was concurrent with periods of enhanced mercury de-position. As shown in Fig. 6, a discernable diurnal vari-ation in snow surface temperature exists with temperature maximum during mid-day. When directly sunlit the DFC creates a greenhouse effect that strongly influences the en-closed surface’s temperature. Gillis and Miller (2000) and Wallschl¨ager et al. (1999) have examined the feasibility of DFCs in order to measure mercury gas exchange and found it significantly biased by physical constraints such as turnover rates and the degree of exposure to ambient wind. In papers by Lindberg and co-workers (Lindberg and Zhang, 2000; Zhang et al., 2002) it was established that a high-limit flux is attained when the enclosure is sufficiently ventilated. This limit steady-state is however not directly comparable either in time or in quantity with e.g. micrometeorological ap-proaches. The highest emission rates are concurrent with surface snow temperatures inside the DFC around 0◦C indi-cating that reduction and emission occurs mainly in melting snow. Thus, these results may not be significant for ambient snow temperatures (i.e. T<0◦C).
The vertical two level TGM measurements over snow at DI generally displayed very small concentration differ-ences (<0.1–0.2 ng m−3) during the period of sampling (3–
13 May). They were frequently insignificant if taking the instrumental precision into consideration. Given the position of each intake, the invariant gradients are in accordance with results from Alert reported by Steffen et al. (2002). However, during one event, solid evidence for photo-stimulated emis-sions of Hg0(g) from the snow pack was obtained. Results from this period are shown in Fig. 7. The TGM gradients
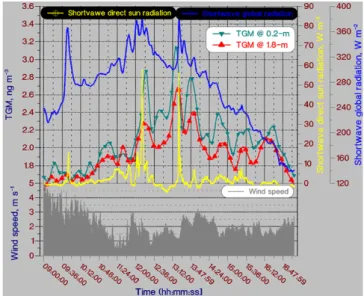
rep-Fig. 7. Vertical 5′measurements of TGM at z1=1.8 m and z2=0.2 m over snow pack during 6 May following the major mercury fall-out episode in snow.
resents 9 h following a snowfall during which a large increase in Hg-tot in snow was observed in consecutive samples on 5 and 6 May (see Fig. 2f). The snow episode ended at ∼09:30 the 6 May and was followed by calm winds, a stable temper-ature at −10◦C and mostly overcast skies. During this period with low wind speeds (<1–3 m s−1at 2 m above the ground) and strong pulses of short-wave direct solar radiation, a pe-riod of frequently significant TGM vertical gradients were observed. Multiple reflections and scattering of shortwave radiation between the surface and the atmosphere enhances the solar flux over the high albedo surface (≥80%). Single TGM measurements yielded a difference of 30 to 50% be-tween the lower and higher sampling heights. Rapid photo-induced production of GEM in the snow followed by gas-transfer from interstitial air to the overlying air is thus im-plied.
The magnitude of the corresponding fluxes during the pe-riod was estimated by applying a basic dispersion model (Olofsson et al., 2001). The upwind fetch of the gradi-ent measuremgradi-ents, a snow-covered relatively flat plain with-out obstacles, was assumed to exhibit homogeneous source strength and surface properties. The contribution from sources at each level sampled (z1=1.8 m and z2=0.2 m) was
described by the Gaussian plume dispersion equation. If assuming neutral stability and an aerodynamic roughness length of 1.5 cm, the vertical concentration gradient obser-vations are consistent with peak fluxes in the range 20– 40 ng m−2h−1. This interval compares satisfactorily with the figures derived from the present DFC measurements. The model predictions are also consistent with the low range emissions (<10 ng m−2h−1) obtained by the DFC and the
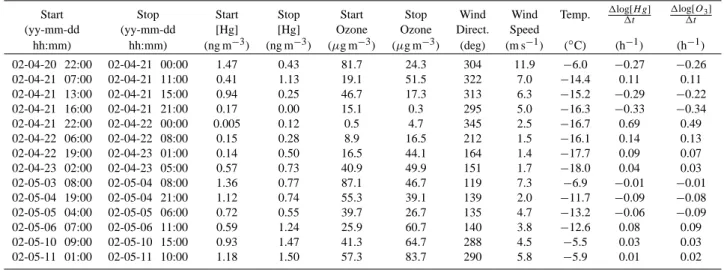
Table 1. TGM and ozone depletion temporal ascent and descent rates at 474 m a.s.l. during 2002 depletion events.
Start Stop Start Stop Start Stop Wind Wind Temp. 1log[H g]1t 1log[O3] 1t
(yy-mm-dd (yy-mm-dd [Hg] [Hg] Ozone Ozone Direct. Speed
hh:mm) hh:mm) (ng m−3) (ng m−3) (µg m−3) (µg m−3) (deg) (m s−1) (◦C) (h−1) (h−1) 02-04-20 22:00 02-04-21 00:00 1.47 0.43 81.7 24.3 304 11.9 −6.0 −0.27 −0.26 02-04-21 07:00 02-04-21 11:00 0.41 1.13 19.1 51.5 322 7.0 −14.4 0.11 0.11 02-04-21 13:00 02-04-21 15:00 0.94 0.25 46.7 17.3 313 6.3 −15.2 −0.29 −0.22 02-04-21 16:00 02-04-21 21:00 0.17 0.00 15.1 0.3 295 5.0 −16.3 −0.33 −0.34 02-04-21 22:00 02-04-22 00:00 0.005 0.12 0.5 4.7 345 2.5 −16.7 0.69 0.49 02-04-22 06:00 02-04-22 08:00 0.15 0.28 8.9 16.5 212 1.5 −16.1 0.14 0.13 02-04-22 19:00 02-04-23 01:00 0.14 0.50 16.5 44.1 164 1.4 −17.7 0.09 0.07 02-04-23 02:00 02-04-23 05:00 0.57 0.73 40.9 49.9 151 1.7 −18.0 0.04 0.03 02-05-03 08:00 02-05-04 08:00 1.36 0.77 87.1 46.7 119 7.3 −6.9 −0.01 −0.01 02-05-04 19:00 02-05-04 21:00 1.12 0.74 55.3 39.1 139 2.0 −11.7 −0.09 −0.08 02-05-05 04:00 02-05-05 06:00 0.72 0.55 39.7 26.7 135 4.7 −13.2 −0.06 −0.09 02-05-06 07:00 02-05-06 11:00 0.59 1.24 25.9 60.7 140 3.8 −12.6 0.08 0.09 02-05-10 09:00 02-05-10 15:00 0.93 1.47 41.3 64.7 288 4.5 −5.5 0.03 0.03 02-05-11 01:00 02-05-11 10:00 1.18 1.50 57.3 83.7 290 5.8 −5.9 0.01 0.02
TGM fluxes obtained at Alert during spring 2002 using DFC and micrometeorological methods yielded similar values. At Point Barrow, highly variable emission rates were observed by DFC during snowmelt 2002 ranging up to 0.6 µg m−2h−1 (Schroeder et al., 2003).
The mechanism behind the formation of volatile mercury in the sunlit snow is not well understood. The reactions are presumably abiotic and involve reactants present on the ice crystal surface. In a study by Lalonde et al. (2003), it was indicated that newly deposited mercury was highly la-bile in snowpacks due to Hg(II) photoinduced reduction to volatile Hg0. The environmental feasibility of aqueous re-duction mechanism of mercuric species was investigated and discussed by G˚ardfeldt et al. (2003). It was concluded that Hg0is not formed through consecutive one-electron reduc-tions under aerated condireduc-tions. However, formation of Hg0 can occur for example via fragmentation of an organic ligand bound to Hg(II) under actinic radiation.
The seawater in Kongsfjorden was supersaturated in re-spect to DGM as mentioned above, which suggests ree-mission of mercury from the water surface as well. Gas-exchange model calculations yielded flux values from 0.1 to 7 ng m−2h−1. It should, however, be mentioned that the bay was partly covered by ice which limited the wave field. The flux values obtained are therefore likely to be overestimated. 3.3 Surface depletions, occurrence of tropospheric BrO
and the influence of transport
3.3.1 Local boundary-layer chemical and meteorological observations
Both ODEs and GEMDEs have recently been assumed to be a result of halogen chemistry as mentioned above. The occur-rence of BrO is frequently used as a tracer for such processes. As can be seen in Fig. 2b, ground based DOAS BrO
mea-surements at Ny- ˚Alesund revealed incidence of elevated BrO column densities simultaneous to the periods of low Hg0and O3surface levels. This initial signature hints that air parcels
at this receptor may exhibit an augmented oxidation capac-ity. In order to evaluate the role of transport and transforma-tion, various regimes of the TGM/O3concentration-time
se-ries were evaluated. Features in composition change are gen-erally reproduced for both gas-phase constituents but during May the patterns became increasingly less correlated. Events of concurrent significant variations in TGM and ozone con-centration are given in Table 1 together with corresponding meteorological information. Shift in meteorological parame-ters is frequently encountered during the on-set of depletions and most utterly marked during the most intense depletion (see Fig. 4c–f). The on-set of the first depletion is associated with falling temperature and raising wind speed (1T≈−15
◦C and 1u≈10 m s−1 during a few hours) and rapid shift
in wind direction from SE to N-NW indicating intrusion of an Arctic airmass. It should be noticed that the local wind-direction during phases of the most distinct changes in TGM were strictly in-between WNW and NNW. This repre-sents a sector almost entirely free from adjacent land masses (Fig. 1). In correspondence to observations made by Solberg et al. (1996) covering ODE’s at Ny- ˚Alesund during 1988– 1993, the on-set of the present GEMDEs is associated with a cold boundary layer. Contrary to the suggestions given by Lu et al. (2001), depletions at Ny- ˚Alesund appear not to be re-stricted to stagnant synoptic situations (Solberg et al., 1996; Tuckermann et al., 1997). The major depletion episode in-deed concurred under strong winds as shown in Fig. 4.
The temporal descents in TGM and O3 (1[X]/1t) were
during the on-set of the major GEMDE in the order of
∼−0.5 ng m−3h−1and ∼−30µg m−3h−1, respectively. The latter value exceeds the most rapid variation features of ODEs reported previously for this site. The very fast drop
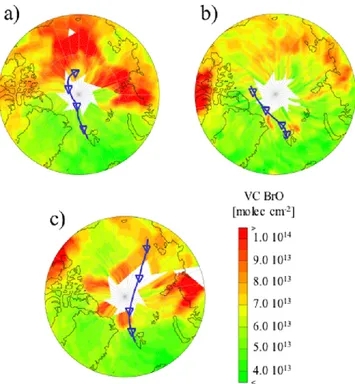
Fig. 8. BrO maps showing the average BrO column on (a) 18 April, (b) 21 April and (c) 2 May, respectively. 96 h back trajectory ending
at 12:00 UTC at Ny- ˚Alesund on (a) 22 April, (b) 24 April and (c) 5 May, respectively. Triangles denote 24 h intervals.
may be interpreted as a combination of halogen chemistry and fast advection of an airmass extending to the surface that has already been affected by depletion for an extensive period of time. The relative variations of O3and TGM were
evalu-ated by calculating 1log[X]/1t ratios for the relevant period of time (see Table 1). It is evident that there exists a near 1:1 relationship between O3and TGM in most of the cases. This
suggests a common meteorological influence by e.g. advec-tion or turbulent dispersion. Nevertheless, due to the pres-ence of moderately elevated BrO concentrations (a few ppt), bromine chemistry forming BrO must have occurred in the air mass. It is however not certain that ozone is a limiting factor.
3.3.2 Remote-sensing circumpolar BrO observations, tra-jectory and sea-ice intersect analysis
To further test whether the low TGM concentrations ob-served might be a result of transport of air masses already depleted from mercury, back trajectories were calculated and compared with daily average BrO vertical column density maps obtained from the GOME satellite. The results from this investigation regarding the first and the second depletion are shown in Fig. 8. The air received at Ny- ˚Alesund the 22 April (the day with maximum depletion) arrived via a north-north-west path as shown in Fig. 8a. The trajectory is of four days length and originates from the Western High Arctic Sea.
Fig. 9. Surface layer ozone (1-h average) and TGM (12 samples
h−1) and Zenith slant columns of BrO intermittently sampled over
Ny- ˚Alesund together with indexed (integrated 6-h average) sea-ice transect of 72-h backward trajectories ending at Ny- ˚Alesund 06:00, 12:00, 18:00 and 24:00 UTC.
BrO vertical column densities mapped in Fig. 8a are from 18 April, the starting day of the trajectory. According to the GOME BrO maps related to the days in-between the 18 to 22 April the trajectory was not passing though areas with el-evated BrO. Hence, this would suggest that the air mass with depleted mercury originated far from Ny- ˚Alesund. However, although not observed by the GOME satellite (BrO GOME data directly above Ny- ˚Alesund are not available from the 22 April) the ground based BrO measurements proved that the air mass actually contained elevated concentrations of BrO.
The climax of BrO concentrations concurrent with the very intrusion of the cold air mass indicates a sustained chemical oxidation of Hg0(g). This implies that the tran-sition phase with active oxidation of GEM must have hap-pened close to Spitzbergen. Conversely, physical removal of the majority of the airborne mercuric products onto snow and ice is a process requiring some time which therefore sug-gests that most of the GEM must have been oxidised quite far from Ny- ˚Alesund. Figure 8b shows a back trajectory end-ing at Ny- ˚Alesund at the 24 April. The GEM concentration was subsequently almost back to normal and as shown the air received does not originate from areas with elevated BrO. According to the back trajectories calculated there is no air transport between Ny- ˚Alesund and the area with high BrO column densities seen north west of Greenland. The next episode with low GEM concentrations occurred in the begin-ning of May, with a GEM minimum at the 5 May, see Fig. 8c. According to the BrO maps from this period, the low GEM concentration also seems to be a consequence of transport of an air mass depleted from mercury. However, considerable
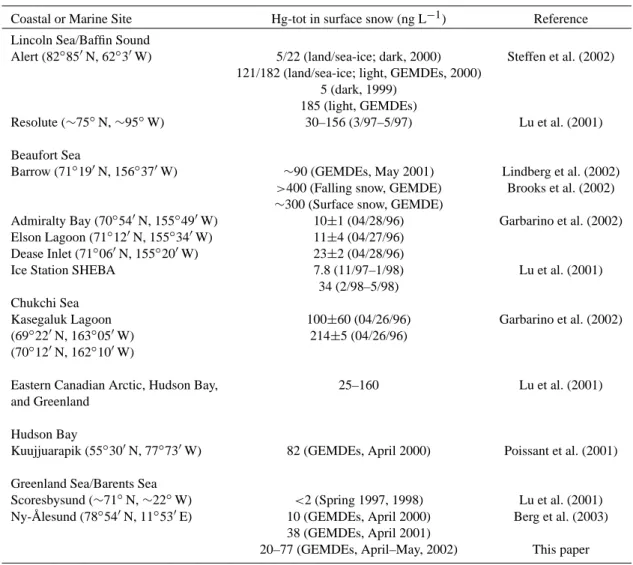
Table 2. Observations of Hg-tot in snow for some Arctic coastal and marine sites (see Fig. 1 for some of the locations).
Coastal or Marine Site Hg-tot in surface snow (ng L−1) Reference Lincoln Sea/Baffin Sound
Alert (82◦85′N, 62◦3′W) 5/22 (land/sea-ice; dark, 2000) Steffen et al. (2002) 121/182 (land/sea-ice; light, GEMDEs, 2000)
5 (dark, 1999) 185 (light, GEMDEs)
Resolute (∼75◦N, ∼95◦W) 30–156 (3/97–5/97) Lu et al. (2001) Beaufort Sea
Barrow (71◦19′N, 156◦37′W) ∼90 (GEMDEs, May 2001) Lindberg et al. (2002)
>400 (Falling snow, GEMDE) Brooks et al. (2002)
∼300 (Surface snow, GEMDE)
Admiralty Bay (70◦54′N, 155◦49′W) 10±1 (04/28/96) Garbarino et al. (2002) Elson Lagoon (71◦12′N, 155◦34′W) 11±4 (04/27/96)
Dease Inlet (71◦06′N, 155◦20′W) 23±2 (04/28/96)
Ice Station SHEBA 7.8 (11/97–1/98) Lu et al. (2001) 34 (2/98–5/98)
Chukchi Sea
Kasegaluk Lagoon 100±60 (04/26/96) Garbarino et al. (2002) (69◦22′N, 163◦05′W) 214±5 (04/26/96)
(70◦12′N, 162◦10′W)
Eastern Canadian Arctic, Hudson Bay, 25–160 Lu et al. (2001) and Greenland
Hudson Bay
Kuujjuarapik (55◦30′N, 77◦73′W) 82 (GEMDEs, April 2000) Poissant et al. (2001) Greenland Sea/Barents Sea
Scoresbysund (∼71◦N, ∼22◦W) <2 (Spring 1997, 1998) Lu et al. (2001) Ny- ˚Alesund (78◦54′N, 11◦53′E) 10 (GEMDEs, April 2000) Berg et al. (2003)
38 (GEMDEs, April 2001)
20–77 (GEMDEs, April–May, 2002) This paper
amounts of oxidised mercury were transported to the mea-surement area via snow, as mentioned above.
Following the approach of Temme et al. (2003), 3-day backward trajectories were interactively generated to de-scribe diurnal (12-h interval separated) transport of air masses to Ny- ˚Alesund during the entire period. The trans-port denoted by twelve 6-h interval positions for each trajec-tory were indexed by the degree of sea ice coverage if such were available. The weight factors were obtained from the ice charts of the US-National Ice Center (http://www.natice. noaa.gov/index.htm). In Fig. 9, the concentration/density-time series of TGM, O3and BrO are spread above the surface
of the summed-up 6-h resolved index (6 ice coverage, base unit 10%). It gives an unambiguous signal that the on-set of measured GEMDE’s coincides with the arrival of air masses with high degree of sea-ice transect.
The sea-ice transport index is surprisingly constant in the slow recovery phase of Hg0(g) during the major GEMDE’s. The apparent recovery phase (22 April–) is associated with
local transport over the barren interior of Spitzbergen Is-land that may well include mixing of air-masses (mixing-in from above with mercury-rich air from the free tropo-sphere). Analogous to ODEs, the influence from local ty-pography may thus obscure the perception of the scale of the phenomenon, making local GEMDEs at Ny- ˚Alesund display shorter duration and lower magnitude (Solberg et al., 1996).
4 Concluding remarks
The measurements made during spring 2002 strongly sug-gest that the observed GEMDEs were caused by transport of air already depleted from mercury rather than the action of solely atmospheric chemistry in the air at Ny- ˚Alesund. One of the findings proposing transport is that the GEMDEs occurred in conjunction with weather changes. The major depletion for example, was initiated when the wind direc-tion changed from south to north and a cold air mass with wind speeds above 10 m s−1was received. Since some time
is needed for an air mass to become depleted from oxidised forms of mercury via deposition of RGM and the particu-late fraction to ice and snow surfaces, the low content of airborne oxidised mercury constitutes an additional evidence for transport. During the major depletion the Total Airborne Mercury (TAM=6(GEM, RGM, TPM)) corresponded to less than 20% of the normal background value of TGM, indicat-ing a >80% loss of airborne mercury. This is considerably lower in comparison to observations made at Nunavut and Alaskan sites (Steffen and Schroeder, 2002; Lindberg et al., 2002) where TAM values corresponding to 70–90% of the background TGM concentration have been observed. With marked referral to the publications by Brooks et al. (2002), Garbarino et al. (2002), Lindberg et al. (2002a) and Lu et al. (2001) respectively covering the American Arctic, Table 2 hints that the deposition pattern here appears to be stronger after Polar sunrise. The GOME BrO maps and back trajec-tories (Fig. 8) also support transport. The ground based BrO data indicate that elevated BrO concentrations can be sus-tained in an ozone depleted air mass. Low ozone values are large compared to BrO concentrations (a few ppt at most) possibly implying that ozone concentrations are just not the limiting factor for BrO formation.
As Hg0(g) generally exhibit a uniform distribution in the polar lower atmosphere, its VCD below a height of z
Z z
0
c(z) dz.
can readibly be estimated. The VCD of TAM lost during MDEs relative to an initial standard background atmosphere ought to be in the interval 0.1–1 µg m−2(Banic et al. 2003; Lindberg et al. 2002). The specific atmospheric profile mea-surements of mercury at Ny- ˚Alesund during MDE 2002 im-ply the lost VCDs to be in the upper range. Assuming peak Hg-tot concentration in surface snow (∼60 ng/L, density 0.4) derived from a single MDE, the conservation of mass is at-tained roughly in a depth interval of 5–10 cm. However, in order to quantitatively address the dynamic cycling of mer-cury at this site in a credible way, a more rigorous sampling protocol is required than that exercised during this campaign. This should at least involve temporally and spatially resolved speciated measurements in boundary layer troposphere as well as in the snow-pack. Still by observing a quick decline of Hg-tot in surface snow and a discrepancy in TGM between the ZI and DI stations in the aftermath of a GEMDE, we can conclude that a significant part of the oxidised mercury de-posited onto snow is quickly re-emitted back to the atmo-sphere as elemental mercury. Here we report evidence for a similar process occurring in seawater. The concentration of DGM in the surface water in Kongsfjorden showed a pro-nounced daily variation well correlated with solar radiation. Hence, it seems like a significant part of the oxidised mercury deposited onto snow and water surfaces is quickly re-emitted back to the atmosphere as elemental mercury. The ratio be-tween deposition and re-emission is an important parameter
that determines the impact of mercury depletion in the Arctic environment. It is now clear that GEMDEs constitute a phe-nomenon of large geographical scale in Polar Regions. More research is needed to improve our understanding of this spec-tacular aspect of environmental mercury cycling.
Acknowledgements. We would like to acknowledge financial
sup-port from the Ny- ˚Alesund Large Scale Facility Program (Contract LSF NILU #71/2001), the Norwegian Research Council (T. Berg) and the Norwegian State Pollution Control Authority (T. Berg). We wish to thank Italian CNR for allowing access to Base Arctica CNR Dirigibile Italia. Additionally, we would like to thank the staff at the Norwegian Polar Institute and Kings Bay A/S, Ny- ˚Alesund for support during the campaign. Special thanks to M. Olofsson from Department of Chemistry, G¨oteborg University for flux calculation from gradient measurements. Alfred Wegener Institute for Polar and Marine Research generously provided meteorological data. GOME lv1 data have been provided by ESA through DFD-DLR Oberpfaffenhofen. Thanks to E. Malcolm for her fruitful comments on the paper.
Edited by: W. Asher
References
Air Resources Laboratory, National Oceanic & Atmospheric Administration (NOAA): HYbrid Single-Particle Lagrangian Integrated Trajectory Model, http://www.arl.noaa.gov/ready/ hysplit4.html, 2003.
Adams, J. W., Holmes, N. S., and Crowley, J. N.: Uptake and re-action of HOBr on frozen and dry NaCl/NaBr surfaces between 253 and 233 K, Atmos. Chem. Phys., 2, 79–91, 2002,
http://www.atmos-chem-phys.net/2/79/2002/.
Ariya, P. A., Khalizov, A., and Gidas, A.: Reactions of gaseous mercury with atomic and molecular halogens: Kinetics, product studies, and atmospheric implications, J. Phys. Chem. A, 106, 7310–7320, 2002.
Balabanov, N. B. and Peterson, K. A.: Mercury and Reactive Halo-gens: The Thermochemistry of Hg+{Cl2, Br2, BrCl, ClO, and
BrO}, J. Phys. Chem. A, 107, 7465–7470, 2003.
Banic, C. M., Beauchamp, S. T., Tordon, R. J., Schroeder, W. H., Steffen, A., Anlauf, K. A., and Wong, H. K. T.: Ver-tical distribution of gaseous elemental mercury in Canada, J. Geophys. Res.-Atmos., 108(D9), 4264, ACH 6: 1–14, doi:10.1029/2002JD002116, 2003.
Barrie, L. A., Bottenheim, J. W., Schnell, R. C., Crutzen, P. J., and Rasmussen, R. A.: Ozone Destruction and Photochemical-Reactions at Polar Sunrise in the Lower Arctic Atmosphere, Na-ture, 334, 138–141, 1988.
Beine, H. J., Argentini, S., Maurizi, A., Mastrantonio, G., and Viola, A.: The local wind field at Ny- ˚Alesund and the Zeppelin moun-tain at Svalbard, Meteorol. Atmos. Phys., 78, 107–113, 2001. Berg, T., Bartnicki, J., Munthe, J., Lattila, H., Hrehoruk, J., and
Mazur, A.: Atmospheric mercury species in the European Arctic: measurements and modelling, Atmos. Environ., 35, 2569–2582, 2001.
Berg, T., Sekkesæter, S., Steinnes, E., Valdal, A.-K., and Wibetoe, G.: Arctic springtime depletion of mercury in the European Arc-tic as observed at Svalbard, Sci. Tot. Environ., 304, 43–51, 2003.
Bloom, N. S. and Crecelius, E. A.: Determination of Mercury in Seawater at Sub-Nanogram Per Liter Levels, Mar. Chem., 14, 49–59, 1983.
Bottenheim, J. W., Fuentes, J. D., Tarasick, D. W., and Anlauf, K. G.: Ozone in the Arctic lower troposphere during winter and spring 2000 (ALERT2000), Atmos. Environ., 36, 2535–2544, 2002.
Boudries, H. and Bottenheim, J. W.: Cl and Br atom concentrations during a surface boundary layer ozone depletion event in the Canadian high Arctic, Geophys. Res. Lett., 27, 517–520, 2000. Braathen, G. O., Hov, Ø., and Stordal, F.: Arctic atmospheric
re-search station on the Zeppelin mountain (474 m a.s.l.) near Ny-˚
Alesund on Svalbard (78◦54′29′′N, 11◦52′53′′E), Report, OR 85/90, NILU, Lillestrøm, Norway, 1990.
Brooks, S., Lindberg, S. E., Goodsite, M., Skov, H., Larsen, M., Scott, K., Southworth, G., Meyers, T., and McConville, G.: Bar-row atmospheric chemical conversion and speciation of atmo-spheric mercury pollution, Paper presented at the Second AMAP International Symposium on Environmental Pollution of the Arc-tic, Rovaniemi, Finland, 2002.
Brosset, C.: Total Airborne Mercury and Its Possible Origin, Water Air Soil Pollut., 17, 37–50, 1982.
Burrows, J. P., Weber, M., Buchwitz, M., Rozanov, V., Ladst¨atter-Weißenmayer, A., Richter, A., DeBeek, R., Hoogen, R., Bram-stedt, K., Eichmann, K.-U., Eisinger, M., and Perner, D.: The Global Ozone Monitoring Experiment (GOME): Mission con-cept and first scientific results, J. Atmos. Sci., 56, 151–175, 1999. Coquery, M., Cossa, D., and Martin, J. M.: The Distribution of Dis-solved and Particulate Mercury in three Siberian Estuaries and Adjacent Arctic Coastal Waters, Water Air Soil Pollut., 80, 653– 664, 1995.
Ebinghaus, R., Kock, H. H., Temme, C., Einax, J. W., Lowe, A. G., Richter, A., Burrows, J. P., and Schroeder, W. H.: Antarc-tic springtime depletion of atmospheric mercury, Environ. Sci. Technol., 36, 1238–1244, 2002.
Foster, K. L., Plastridge, R. A., Bottenheim, J. W., Shepson, P. B., Finlayson-Pitts, B. J., and Spicer, C. W.: The role of Br2 and BrCl in surface ozone destruction at polar sunrise, Science, 291, 471–474, 2001.
Garbarino, J. R., Snyder-Conn, E., Leiker, T. J., and Hoffman, G. L.: Contaminants in arctic snow collected over northwest Alaskan sea ice, Water Air Soil Pollut., 139, 183–214, 2002.
G˚ardfeldt, K., Horvat, M., Sommar, J., Kotnik, J., Fajon, V., W¨angberg, I., and Lindqvist, O.: Comparison of procedures for measurements of dissolved gaseous mercury in seawater per-formed on a Mediterranean cruise, Analyt. Bioanalyt. Chem., 374, 1002–1008, 2002.
G˚ardfeldt, K.: Transformation of Mercury Species in the Aqueous Phase, Doctoral Thesis, pp. 59, Division of Inorganic Chemistry, Department of Chemistry, G¨oteborg University, G¨oteborg, 2003. G˚ardfeldt, K., Sommar, J., Ferrara, R., Ceccarini, C., Lanzillotta, E., Munthe, J., Wangberg, I., Lindqvist, O., Pirrone, N., Sprovieri, F., Pesenti, E., and Stromberg, D.: Evasion of mercury from coastal and open waters of the Atlantic Ocean and the Mediter-ranean Sea, Atmos. Environ., 37, 73–84, 2003.
Gillis, A. and Miller, D. R.: Some potential errors in the measure-ment of mercury gas exchange at the soil surface using a dynamic flux chamber, Sci. Tot. Environ., 260, 181–189, 2000.
Goldberg, E. D.: Synthetic organohalides in the sea, Proceedings of
the Royal Society of London Series B-Biological Sciences, 189, 277–289, 1975.
Golubeva, N., Burtseva, L., and Matishov, G. G.: Measurements of mercury in the near-surface layer of the atmosphere of the Russian Arctic, The Science of the Total Environment, 306, 3–9, 2003.
H¨onninger, G.: Halogen Oxide Studies in the Boundary Layer by Multi Axis Differential Optical Absorption Spectroscopy and Active Longpath-DOAS., Doctoral Thesis, pp. 262, Institute of Environmental Physics, University of Heidelberg, Heidelberg, 2002.
Kim, K. H. and Lindberg, S. E.: Design and Initial Tests of a Dynamic Enclosure Chamber for Measurements of Vapor-Phase Mercury Fluxes over Soils, Water Air Soil Pollut., 80, 1059– 1068, 1995.
Lalonde, J. D., Poulain, A. J., and Amyot, M.: The role of mercury redox reactions in snow on snow-to-air mercury transfer, Envi-ron. Sci. Technol., 36, 174–178, 2002.
Landis, M. S., Stevens, R. K., Schaedlich, F., and Prestbo, E. M.: Development and characterization of an annular denuder methodology for the measurement of divalent inorganic reac-tive gaseous mercury in ambient air, Environ. Sci. Technol., 36, 3000–3009, 2002.
Landis, M. S. and Stevens, R. K.: Comment on “Measurements of Atmospheric Mercury Species at a Coastal Site in the Antarctic and over the South Atlantic Ocean during Polar Summer”, Envi-ron. Sci. Technol., 37, 3239–3240, 2003.
Lantzy, R. J. and Mackenzie, F. T.: Atmospheric Trace-Metals – Global Cycles and Assessment of Mans Impact, Geochim. Cos-mochim. Acta, 43, 511–525, 1979.
Lee, Y.-H., Munthe, J., and Iverfeldt, ˚A.: Experiences with the ana-lytical procedures for the determination of methylmercury in en-vironmental samples, Appl. Organometallic Chem., 8, 659–664, 1994.
Lindberg, S. E. and Zhang, H.: Air/water exchange of mercury in the Everglades II: measuring and modeling evasion of mercury from surface waters in the Everglades Nutrient Removal Project, Sci. Total Environ., 259, 135–143, 2000.
Lindberg, S. E., Brooks, S., Lin, C. J., Scott, K. J., Landis, M. S., Stevens, R. K., Goodsite, M., and Richter, A.: Dynamic oxida-tion of gaseous mercury in the Arctic troposphere at polar sun-rise, Environ. Sci. Technol., 36, 1245–1256, 2002.
Lindqvist, O. and Rodhe, H.: Atmospheric Mercury – a Review, Tellus Series B-Chemical and Physical Meteorology, 37, 136– 159, 1985.
Lorenzen-Schmidt, H., Wessel, S., Unold, W., Solberg, S., Ger-nandt, H., Stordal, F., and Platt, U.: Ozone measurements in the European Arctic during the ARCTOC 1995 campaign, Tellus Se-ries B-Chemical and Physical Meteorology, 50, 416–429, 1998. Lu, J. Y., Schroeder, W. H., Barrie, L. A., Steffen, A., Welch, H.
E., Martin, K., Lockhart, L., Hunt, R. V., Boila, G., and Richter, A.: Magnification of atmospheric mercury deposition to polar regions in springtime: the link to tropospheric ozone depletion chemistry, Geophys. Res. Lett., 28, 3219–3222, 2001.
Lu, J. Y., Schroeder, W. H., and Keeler, G.: Field intercomparison studies for evaluation and validation of the AESminiSamplR™ technique for sampling and analysis of total particulate mercury in the atmosphere, Sci. Tot. Environ., 304, 115–125, 2003. Malcolm, E. G., Keeler, G. J., and Landis, M. S.: The