HAL Id: hal-00301882
https://hal.archives-ouvertes.fr/hal-00301882
Submitted on 27 Oct 2005HAL is a multi-disciplinary open access
archive for the deposit and dissemination of sci-entific research documents, whether they are pub-lished or not. The documents may come from teaching and research institutions in France or abroad, or from public or private research centers.
L’archive ouverte pluridisciplinaire HAL, est destinée au dépôt et à la diffusion de documents scientifiques de niveau recherche, publiés ou non, émanant des établissements d’enseignement et de recherche français ou étrangers, des laboratoires publics ou privés.
Studies of aerosol at a coastal site using two aerosol
mass spectrometry instruments and identification of
biogenic particle types
M. Dall’Osto, R. M. Harrison, H. Furutani, K. A. Prather, H. Coe, J. D. Allan
To cite this version:
M. Dall’Osto, R. M. Harrison, H. Furutani, K. A. Prather, H. Coe, et al.. Studies of aerosol at a coastal site using two aerosol mass spectrometry instruments and identification of biogenic particle types. Atmospheric Chemistry and Physics Discussions, European Geosciences Union, 2005, 5 (5), pp.10799-10838. �hal-00301882�
ACPD
5, 10799–10838, 2005Studies of aerosol using two aerosol mass spectrometers M. Dall’Osto et al. Title Page Abstract Introduction Conclusions References Tables Figures J I J I Back Close
Full Screen / Esc
Print Version
Interactive Discussion
EGU Atmos. Chem. Phys. Discuss., 5, 10799–10838, 2005
www.atmos-chem-phys.org/acpd/5/10799/ SRef-ID: 1680-7375/acpd/2005-5-10799 European Geosciences Union
Atmospheric Chemistry and Physics Discussions
Studies of aerosol at a coastal site using
two aerosol mass spectrometry
instruments and identification of biogenic
particle types
M. Dall’Osto1, R. M. Harrison1, H. Furutani2, K. A. Prather2, H. Coe3, and J. D. Allan3
1
Division of Environmental Health and Risk Management, School of Geography, Earth and Environmental Sciences, University of Birmingham, Edgbaston, Birmingham B15 2TT, UK
2
Department of Chemistry and Biochemistry, Scripps Institution of Oceanography, University of California, San Diego, La Jolla, CA 92093-0314, USA
3
School of Earth, Atmospheric and Environmental Sciences (SEAES) University of Manchester, PO Box 88, Manchester M60 1QD, UK
Received: 25 May 2005 – Accepted: 23 August 2005 – Published: 27 October 2005 Correspondence to: R. M. Harrison ([email protected])
ACPD
5, 10799–10838, 2005Studies of aerosol using two aerosol mass spectrometers M. Dall’Osto et al. Title Page Abstract Introduction Conclusions References Tables Figures J I J I Back Close
Full Screen / Esc
Print Version
Interactive Discussion
EGU Abstract
During August 2004 an Aerosol Time-of-Flight Mass Spectrometer (TSI ATOFMS Model 3800-100) and an Aerodyne Aerosol Mass Spectrometer (AMS) were deployed at Mace Head during the NAMBLEX campaign. Single particle data (size, positive and negative mass spectra) from the ATOFMS were imported into ART 2a, a neural
net-5
work algorithm, which assigns individual particles to clusters on the basis of their mass spectral similarities. Results are very consistent with previous time consuming man-ual classifications (Dall’Osto et al., 2004). Three broad classes were found: sea-salt, dust and carbon-containing particles, with a number of sub-classes within each. The Aerodyne (AMS) instrument was also used during NAMBLEX, providing online, real
10
time measurements of the mass of non-refractory components of aerosol particles as function of their size.
The ATOFMS detected a type of particle not identified in our earlier analysis, with a strong signal at m/z 24, likely due to magnesium. This type of particle was detected during the same periods as pure unreacted sea salt particles and is thought to be
15
biogenic, originating from the sea surface. AMS data are consistent with this interpre-tation, showing an additional organic peak in the corresponding size range at times when the Mg-rich particles are detected. The work shows the ATOFMS and AMS to be largely complementary, and to provide a powerful instrumental combination in studies of atmospheric chemistry.
20
1. Introduction
During August and September 2002 the North Atlantic Marine Boundary Layer Ex-periment (NAMBLEX) took place at Mace Head. The aims of the campaign were to study the oxidation processes, atmospheric chemistry and composition of a number of species primarily in the marine boundary layer. The NAMBLEX experiment is described
25
ACPD
5, 10799–10838, 2005Studies of aerosol using two aerosol mass spectrometers M. Dall’Osto et al. Title Page Abstract Introduction Conclusions References Tables Figures J I J I Back Close
Full Screen / Esc
Print Version
Interactive Discussion
EGU particle mass spectrometers Aerosol Mass Spectrometer (AMS-Aerodyne Research,
Inc.) and Aerosol Time-of-Flight Mass Spectrometer (ATOFMS, model 3800; TSI Inc.) were deployed.
The ATOFMS provides information on a polydisperse aerosol, acquiring precise aerodynamic diameter (±1%) and individual particle positive and negative mass
spec-5
tral data in real time (Gard et al., 1997; Dall’Osto et al., 2004). The AMS provides online, real time measurements of the mass of non-refractory components of aerosol particles as function of their size (Jayne et al., 2000; Allan et al., 2003a, b; Jimenez et al., 2003). The purpose of this study was to run the two different particle mass spec-trometers at a remote marine site, and to compare their results. To our knowledge, this
10
is the first study in which the two most widespread commercially available instruments (not prototypes) are compared.
The generally employed method of collecting size-fractionated airborne particles re-lies on using multistage impactors prior their chemical analysis (McMurry, 2000). How-ever, these methods do not provide any information on the extent of internal or external
15
chemical mixing of the aerosols sampled and furthermore they suffer from a very poor time resolution. The advent of techniques of particle mass spectrometry offers great insights into the source apportionment and atmospheric chemistry of aerosols (Prather et al., 1994; Johnston and Wexler, 1995; Suess and Prather, 1999).
The global mass emission of sea-salt particles is more than 20 times the combined
20
emissions of organics, black carbon, sulphate, nitrate and ammonium in the atmo-sphere (Raes et al., 2000). Marine aerosol therefore contributes significantly to the global aerosol load and consequently it is important to understand its physical and chemical properties. Moreover, the role of organic compounds in the remote marine aerosol remains uncertain, mainly because of the lack of quantitative measurements
25
of their size-dependent composition.
Recently, O’Dowd et al. (2004) found that during plankton blooms, organic material arising from the sea surface microlayer and generated during bubble bursting con-tributes 63% to the submicrometre aerosol mass (about 45% is water-insoluble and
ACPD
5, 10799–10838, 2005Studies of aerosol using two aerosol mass spectrometers M. Dall’Osto et al. Title Page Abstract Introduction Conclusions References Tables Figures J I J I Back Close
Full Screen / Esc
Print Version
Interactive Discussion
EGU about 18% water-soluble). The report of these types of particles has created great
interest in the scientific community. The main reason is the fact that size-dependent chemical composition is considered a critical parameter in defining aerosol properties pertinent to radiative effects. Specifically the large organic content of submicron marine aerosol will greatly alter the cloud nucleating properties of the particles and hence
af-5
fect the cloud droplet number in marine stratiform clouds (Novakov and Penner, 1993; Kleefeld et al., 2002; O’Dowd et al., 2004).
In order to better understand the speciation of organic marine aerosol, improved aerosol chemical instrumentation is required. In this study we present detailed infor-mation on aerosol sampled at Mace Head with state-of-the-art instrumentation
show-10
ing how the combined use of two different aerosol mass spectrometers can enhance knowledge of ambient aerosols.
This paper however has a multiple aim intending to present how:
– TSI ATOFMS (TSI Model 3800) data are for the first time successfully imported
into YAADA (Yet Another ATOFMS Data Analyzer), a software toolkit to analyse
15
single particle mass spectral data collected with ATOFMS.
– Single particles with similar mass spectra are classified with an artificial
intelli-gence algorithm (ART-2a), showing similar results to previous manual classifica-tion (Dall’Osto et al., 2004).
– A unique, probably biogenic type of particle is also found at Mace Head. 20
– The complementary nature of ATOFMS and AMS instruments is demonstrated by
describing this unique type of particle, thought to be of biogenic origin.
2. Experimental
The Mace Head research station is located on the west coast of Ireland (53◦190N, 9◦540W) at close to sea level on a peninsula, which is surrounded by coastline and
ACPD
5, 10799–10838, 2005Studies of aerosol using two aerosol mass spectrometers M. Dall’Osto et al. Title Page Abstract Introduction Conclusions References Tables Figures J I J I Back Close
Full Screen / Esc
Print Version
Interactive Discussion
EGU tidal areas except for a small sector between 20◦ and 40◦. The nominal clean sector
lies between 180◦ and 300◦ (Jennings et al., 1997). Further information can be found in Heard et al. (2005).
The Aerosol Mass Spectrometer (AMS) sampled throughout the whole month of August 2002 during NAMBLEX. However, due to instrument failure, no data were
avail-5
able between 13–19 August 2002. The Aerosol Time-of-Flight Mass Spectrometer (ATOFMS) was operated almost continuously at Mace Head Atmospheric Station be-tween 1–21 August 2002. The temporal overlap of the two particle mass spectrometers was therefore 1–13 August 2002. In this paper we describe the full period when the ATOFMS was operating, with particular emphasis on the part of the period when the
10
two mass spectrometers were operating. A detailed overview of the AMS results can be found in Coe et al. (2005)1 whilst a detailed analysis of the ATOFMS data can be found elsewhere (Dall’Osto et al., 2004).
An isokinetic inlet system was attached to the sampling tower available at the Mace Head Atmospheric Research Station, and delivered ambient air to an air-conditioned
15
container van in which the two particle mass spectrometers were housed. The sam-pling height of the inlet was alternated between 7 and 22 m hourly by switching a valve in the pipe at 7 m height. The inlet system is described in detail in Coe et al. (2005)1. Data analysis showed no significant differences in the particle populations sampled at the two heights for particles in the size range 30 nm to 3 µm diameter (Coe et al.,
20
20051). 1
Coe, H., Allan, J. D., Alfarra, M. R., Bower, K. N., Flynn, M. J., McFiggans, G. B., Topping, D. O., Williams, P. I., O’Dowd, C. D., Dall’Osto, M., Beddows, D. C. S., and Harrison, R. M.: Chemical and Physical Characteristics of Aerosol Particles at a remote coastal location, Mace Head, Ireland, during NAMBLEX, Atmos. Chem. Phys. Discuss., submitted, 2005.
ACPD
5, 10799–10838, 2005Studies of aerosol using two aerosol mass spectrometers M. Dall’Osto et al. Title Page Abstract Introduction Conclusions References Tables Figures J I J I Back Close
Full Screen / Esc
Print Version
Interactive Discussion
EGU 2.1. Instruments
The general techniques and history of online particle mass spectrometers were re-viewed recently by Suess and Prather (1999). The basic principle of an aerosol mass spectrometer is to introduce airborne particles into the instrument, vaporise and ionise the material. Once the ions are formed, they are analysed by mass spectrometry.
5
There are few studies in which different particle mass spectrometers have been de-ployed simultaneously. During August 1999 the Atlanta Supersite Project took place in Atlanta, GA and four particle mass spectrometers were operated for the first time (Middlebrook et al., 2003). During this study the ATOFMS TSI prototype (Prather et al., 1994) and an Aerodyne’s AMS were compared for the first time with other single
10
particle mass spectrometers.
In Europe, during the MINOS campaign (Crete, August 2001), an Aerodyne Aerosol Mass Spectrometer and a single particle mass spectrometer (SPLAT) were run to-gether (Schneider et al., 2004), although the preliminary state of development of the SPLAT did not allow a full comparison.
15
The most widespread commercially available particle mass spectrometers are the Aerosol Mass Spectrometer (AMS-Aerodyne Research, Inc.) and Aerosol Time-of-Flight Mass Spectrometer (ATOFMS, model 3800-TSI Inc.) and a brief overview of these instruments is given in the next subparagraphs.
2.1.1. TSI model 3800 Aerosol Time-of-Flight Mass Spectrometer (ATOFMS)
20
The ATOFMS provides continuous, real-time detection and characterization of single particles from polydisperse samples, providing information on particle size and compo-sition (Prather et al., 1994; Gard et al., 1997). Briefly, air is introduced into a vacuum system region through a converging nozzle and two skimmers create a narrow col-limated particle beam. The particles then travel through a sizing region where the
25
aerodynamic diameter of individual particles is determined by detecting scattered light from two timing lasers positioned at known distance apart. After being sized, the
par-ACPD
5, 10799–10838, 2005Studies of aerosol using two aerosol mass spectrometers M. Dall’Osto et al. Title Page Abstract Introduction Conclusions References Tables Figures J I J I Back Close
Full Screen / Esc
Print Version
Interactive Discussion
EGU ticles enter the mass spectrometer source region where a pulse from a Nd:YAG laser
(frequency quadrupled, λ=266 nm) is triggered at the appropriate time – based on the transit time of the particle measured in the sizing region – to desorb and ionise material from the sized particle. The mass-to-charge ratios of both positive and negative ions of single particles are then determined simultaneously in two time-of-flight reflectron
5
mass spectrometers. The sampling efficiency of the ATOFMS is roughly proportional to the third power of the diameter (Allen et al., 2000).
During NAMBLEX, an Aerodynamic Particle Sizer (APS; Model 3320, TSI Inc. Shore-view, MN) and a Micro-Orifice Uniform Deposit Impactor (MOUDI; MSP Corporation, Minneapolis, Minnesota, USA) were deployed concurrently with the ATOFMS. A
com-10
parison between ATOFMS, APS and MOUDI measurements can provide a better knowledge of the ATOFMS particle detection efficiency in a remote marine environ-ment such as Mace Head (Dall’Osto, 2005), submitted to Environenviron-mental Science and Technology). Briefly, it was found that the response of the ATOFMS follows a power law dependency in the range 0.53–1.9 µm, and is affected by a substantial matrix effect
15
in the super-micron size mode depending on the chemical composition of the aerosol sampled at the time, which is reflected in variations in the hit-rate of particles with the main desorption-ionization laser as they enter the sensing zone of the instrument. It is currently a matter of debate whether this effect is due to the inherent absorptive properties of the particles, or due to the hygroscopic properties and a low hit rate for
20
solution droplets (Dall’Osto et al., 20052; Moffet et al., 2004).
However, the laser ablation technique can provide quantitative information on an ensemble of particles of a similar matrix (Gross et al., 2000; Bhave et al., 2002). The unique feature of the ATOFMS is it can provide information on real-time changes in the size-resolved mixing state (internal/external) of the single particle sampled. The
25
instrument used in this study is able to measure the size and the chemical composition 2
Dall’Osto, M., Harrison, R. M., Beddows, D. C. S., Freney, E. J., Heal, M. R., and Donovan, R. J.: Single particle detection efficiencies of aerosol time-of-flight mass spectrometry during the NAMBLEX marine boundary layer experiment, Environ. Sci. Technol., submitted, 2005.
ACPD
5, 10799–10838, 2005Studies of aerosol using two aerosol mass spectrometers M. Dall’Osto et al. Title Page Abstract Introduction Conclusions References Tables Figures J I J I Back Close
Full Screen / Esc
Print Version
Interactive Discussion
EGU of individual airborne particles in the size range roughly between 0.3 and 3.0 µm (TSI
model 3800).
2.1.2. Aerodyne Aerosol Mass Spectrometer (AMS)
The Aerodyne Aerosol Mass Spectrometer (AMS) (Jayne et al., 2000; Jimenez et al., 2003; Allan et al., 2003a) provides online, real time measurements of the mass of
non-5
refractory components of aerosol particles as a function of their size. Briefly, the AMS draws sample air into a high vacuum through a critical orifice and focuses particles with an aerodynamic lens. The particle diameter is measured by the same principle used in the ATOFMS which is time-of-flight. A chopper wheel delivers a slug of particles into the time of flight vacuum region, where their speed is proportional to their size. The
10
particle beam is then delivered onto a heated surface, maintained at 500◦C, at a vac-uum pressure of 10−8torr, which is located in the centre of an electron impact ioniser. Here the particles are deposited on the hot surface and the volatile and semi-volatile components of the aerosol are vaporised. The mass collection efficiency is almost 100% for spherical particles with aerodynamic diameters between 60 and 600 nm. The
15
molecules are then ionised by electron impact (70 eV) and analysed by quadrupole mass spectrometry. The AMS alternates between two data acquisition modes: the “Time-of-flight” (ToF) mode and the “Mass Spec” (MS) mode (Jimenez et al., 2003; Alfarra et al., 2004). In the ToF mode the quadrupole mass spectrometer is set to scan pre-selected fragment ions and measure their mass as a function of the particle size.
20
In the MS mode the averaged chemical composition of the non-refractory aerosol com-ponents is determined by scanning the full mass spectrum (1–300 m/z units) with the quadrupole mass spectrometer. In this mode the AMS measures the ambient submi-cron aerosol ensemble.
The AMS can quantify the size resolved organic carbon, sulphate, ammonium and
25
nitrate mass loadings of aerosol in the size range between 60 and 600 nm. However, it cannot detect refractory material such as elemental carbon, dust and sea salt par-ticles. The standard quadrupole version of the AMS cannot resolve single particle
ACPD
5, 10799–10838, 2005Studies of aerosol using two aerosol mass spectrometers M. Dall’Osto et al. Title Page Abstract Introduction Conclusions References Tables Figures J I J I Back Close
Full Screen / Esc
Print Version
Interactive Discussion
EGU composition, and therefore cannot explicitly determine the chemical mixing state of the
particles. However, an AMS fitted with a time of flight mass spectrometer is currently being developed and will overcome this limitation.
The ATOFMS can provide mass spectral information on a single particle basis and therefore information on the mixing state of single particles. Furthermore, it is sensitive
5
to refractory material and so can probe sea salt, dust and elemental carbon, as well as more volatile components. The commercial version of the ATOFMS (without an aerodynamic lens system which is now available – TSI 3800-030) has a size dependent sampling efficiency and samples far fewer particles per unit time than the AMS.
The complementarity of the two particle mass spectrometers is a very powerful
com-10
bination for characterising ambient particles as shown herein. 2.2. Data collection, processing and analysis
The ATOFMS is controlled by the TSI operational software called MS-control. It is a Windows®-based, C++ program that controls instrument operation. MS-control also displays particle size, mass spectra, and time of detection for each individual particle in
15
real time and saves all this information in raw data, which can be written in a database (Microsoft® Access 2000 based) by another software called MS-analyse. To qualify a mass/charge (m/z) ratio as a peak, a spectrum value had to be 20 units above a user-selected baseline, contain 20 square units of area and represent at least 0.005 as fraction of the total peak area of its spectrum.
20
In the AMS, mass loadings are retrieved from the ion signal and mass spectral infor-mation produced based on algorithms described in Allan et al. (2003a); these will not be described in full here, but rely on ammonium nitrate calibrations to provide the main method of mass calibration. The AMS gives different information on the aerosols sam-pled, but a much reduced amount of data compared to the ATOFMS. The data analysis
25
is more user-friendly and this is one of the main reasons for its more widespread use by the global scientific community. At the moment the ratio between AMS and ATOFMS
ACPD
5, 10799–10838, 2005Studies of aerosol using two aerosol mass spectrometers M. Dall’Osto et al. Title Page Abstract Introduction Conclusions References Tables Figures J I J I Back Close
Full Screen / Esc
Print Version
Interactive Discussion
EGU instrument uptake by the global scientific community is roughly 3 (TSI, personal
com-munication).
The TSI ATOFMS dataset is usually analysed by “query and search” methods, which assign each particle to groups predetermined by the user (Beddows et al., 2004; Dall’Osto et al., 2004; Yadav et al., 2004). This method requires much time and is
5
strongly affected by the marker chosen to define a specific type of single particle mass spectrum.
YAADA (Yet Another ATOFMS Data Analyzer) is a software toolkit to analyze single particle mass spectral data including data collected with Aerosol Time-of-Flight Mass Spectrometer (ATOFMS) instruments. (J. O. Allen, 2001, software tool kit manual,
10
http://www.yaada.org). The software has been widely used in the prototype version of
the ATOFMS (Pastor et al., 2003; Moffet et al., 2004; Wenzel and Prather, 2004). The newest version of YAADA (v 1.30) is an object-oriented toolbox written in the Matlab programming (minimum Matlab version 6.5 required) and is able to import also TSI-ATOFMS datasets. Once imported, TSI TSI-ATOFMS dataset can be analysed with the
15
powerful ART-2a tool. ART-2a is an artificial intelligence algorithm that sorts single particle mass spectra into specific particle type or clusters (Song et al., 1999; Allen et al., 2000; Pastor et al., 2003).
The main parameters involved are the vigilance factor (VF), learning rate (LR) and number of iterations though which the algorithm runs. An Art-2a cluster can be
repre-20
sented as an area (that varies with VF), around the weight vector that contains similar single particle mass spectra. Further details of the method can be found elsewhere (Song et al., 1999; Allen et al., 2000; Pastor et al., 2003).
3. Results
A comparison between the two real time particle mass spectrometers at Mace Head
25
during NAMBLEX was not straightforward. The two instruments were operating at the same time only for a limited period of the campaign (1–13 August 2002). AMS
ACPD
5, 10799–10838, 2005Studies of aerosol using two aerosol mass spectrometers M. Dall’Osto et al. Title Page Abstract Introduction Conclusions References Tables Figures J I J I Back Close
Full Screen / Esc
Print Version
Interactive Discussion
EGU can quantify the size resolved organic carbon, sulphate, ammonium and nitrate mass
loading of aerosol in the size range between 60 and 600 nm. However, it cannot detect refractory material such as elemental carbon, dust and sea salt particles. During the overlap period the air masses were generally clean (not influenced by anthropogenic sources) and the mass loading of chemical species detected by the AMS was generally
5
low. In contrast, the ATOFMS can detect both refractory and non-refractory material, although not in such a easily quantifiable way as the AMS.
The analysis presented here is based mainly upon ATOFMS results. AMS data are discussed when an overlap between the two instrument is helpful. For more detailed information regarding the AMS dataset, the reader is referred to Coe et al. (2005)1.
10
The reader is invited to refer also to Dall’Osto et al. (2004), where detailed analysis of the ATOFMS data obtained by manual classification of single particle mass spectra can be found.
In Aerosol Time-of-Flight Mass Spectrometry (ATOFMS) particles for which both size and mass spectra (positive and/or negative) are collected are classified as “hit”.
Parti-15
cles which are sized but did not produce a mass spectrum are classified as “missed”. In all, during NAMBLEX 1 410 145 particles were recorded of which 191 504 were clas-sified as hits. By running ART-2a (learning rate 0.05, vigilant factor 0.85, 20 iterations) 244 clusters were found. 90% of the particles were classified within the top 27 clus-ters. The top 50 clusters were able to describe 96.5% of the particles sampled at Mace
20
Head during NAMBLEX.
The number of clusters was further reduced. Some of the top 50 clusters were very similar to each other. The main differences were due to the peak area or to the noise level. The clusters considered needed to meet the following criteria in order to be merged together: they had to present a similar temporal trend, size distribution
25
and similar mass spectra in order to be merged. By merging similar clusters, the total number of clusters describing the NAMBLEX database was reduced to 17 clusters, as shown in Table 1.
selec-ACPD
5, 10799–10838, 2005Studies of aerosol using two aerosol mass spectrometers M. Dall’Osto et al. Title Page Abstract Introduction Conclusions References Tables Figures J I J I Back Close
Full Screen / Esc
Print Version
Interactive Discussion
EGU tion rules as in Dall’Osto et al. (2004), and in Table 2 information from both
classifica-tions can be found. The rigid manual classification leaves 29% of the particles sampled unclassified, whilst the neural network algorithm ART-2a apportion the whole dataset. The two main classes Carbon-containing and Dust particles (class number 1 and 2 in Table 2, respectively) are very similar in estimated percentage abundances. Class 3
5
(sea-salt particles) are quite different in estimated abundance and the reason will be explained in Sect. 3.1. However, the comparison between the two methods shows that ART-2a provides more detailed results (but similar to the manual classification) in a shorter amount of time.
3.1. Inorganic classes
10
As expected, sea salt was the main class, accounting for 69.2% of the particles gen-erating mass spectra. It is important to note that the efficiency of the ATOFMS is very different for different types of particles. For example, a carbon-containing particle is more detectable (sized, desorbed and ionised by the ATOFMS) than a pure sea-salt particle by at least 1 order of magnitude (Dall’Osto et al., 20052). Therefore, without
15
scaling applied, the percentages of the clusters are not representative of actual abun-dance and reflect the number of particles detected by the ATOFMS and not the real source apportionment of the classes present in the ambient air sampled. However, they are reported as qualitative information. The issue of quantification is addressed elsewhere (Dall’Osto et al., 20052).
20
Pure sea salt (1A) represented the main sub-class, with 22.3% of the total particles sampled. A detailed description of different types of sea salt particles and several examples of single particle mass spectra are given in Dall’Osto et al. (2004). The results obtained with the ART-2a algorithm are similar to those described in Dall’Osto et al. (2004), where a time consuming manual classification was required in order to
25
classify different single particle mass spectra.
Sea-salt aerosols can react with HNO3to form nitrate and release hydrogen chloride to the gas phase (Harrison and Pio, 1983; Harrison et al., 1994; Pakkanen, 1996;
ACPD
5, 10799–10838, 2005Studies of aerosol using two aerosol mass spectrometers M. Dall’Osto et al. Title Page Abstract Introduction Conclusions References Tables Figures J I J I Back Close
Full Screen / Esc
Print Version
Interactive Discussion
EGU Gard et al., 1998). Cluster 1C is characterised by NaxClyNOz peaks whilst cluster 1F
shows NaxNOyclusters. The temporal trends of these classes are in line with the ones presented in Dall’Osto et al. (2004), where a detailed analysis of the types of single particle mass spectra belonging to these clusters can be found.
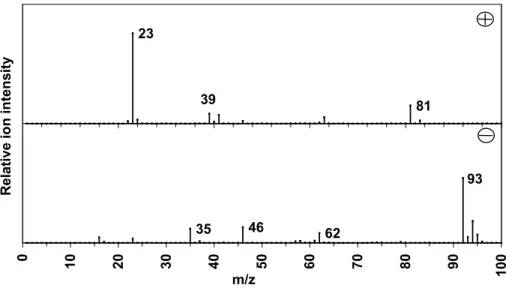
Cluster 1D (9%) (Fig. 1) shows a strong peak at m/z −93 (NaCl−2) together with
5
peaks characteristic of the nitrate ion (m/z=46 and 62) and correlates with polluted episodes. This class correlates with classes 1C and 1F, most likely due to pollution events. Cluster 1B (19.3%) presents only positive ion mass spectra (very similar to the positive spectra of cluster 1A) with no information on the negative one. This could be due to the negative data acquisition board overheating or another type of sea salt
10
particle. The difference in percentage of the main sea-salt class (class number 1 in Table 2) between the two different classifications is mainly due to this cluster. Due to the lack of the negative spectra, this cluster was put into the unclassified part of the manual classification. Further studies need to be carried out in order to understand the origin of this type of particle. However, it is important to note that cluster 1A, 1C and 1F
15
(pure, mixed and aged sea-salt particles, respectively) presented very similar temporal trends as the same classes described in Dall’Osto et al. (2004).
Relative humidity might be expected to have some influence on the ionisation pro-cess through the hygroscopicity of the particles. Inorganic aqueous aerosols typically have higher ionisation thresholds and produce lower ion currents (Neubauer et al.,
20
1997). Moffet et al. (2004) recently found lower ATOFMS efficiency during episodes of high RH, causing condensation of water on particle surfaces. The relative humidity of the inlet was not controlled during our study. The RH of ambient air sampled dur-ing NAMBLEX was 87±16% whilst the ambient temperature was 15±4◦C (95% con-fidence). However, part of the sampling line was inside the air conditioned container
25
van housing the aerosol time-of-flight mass spectrometer. The container van housed several other instruments measuring different atmospheric aerosol properties which generated heat, keeping the temperature of the van always high, roughly at 30±3◦C. Air with 87% relative humidity at 15◦C will have an RH of 35% at 30◦C, whilst in the
ACPD
5, 10799–10838, 2005Studies of aerosol using two aerosol mass spectrometers M. Dall’Osto et al. Title Page Abstract Introduction Conclusions References Tables Figures J I J I Back Close
Full Screen / Esc
Print Version
Interactive Discussion
EGU extreme case of air saturated at 20◦C, the RH at 30◦C will be only 55%. We
there-fore consider it unlikely that particles entered the ATOFMS as solution droplets, and therefore consider that chemical matrix effects influencing absorption of the LDI laser are the most probably explanation of the lower hit rates encountered in clean air. We recognise, however, that both explanations remain viable, and that this matter remains
5
controversial.
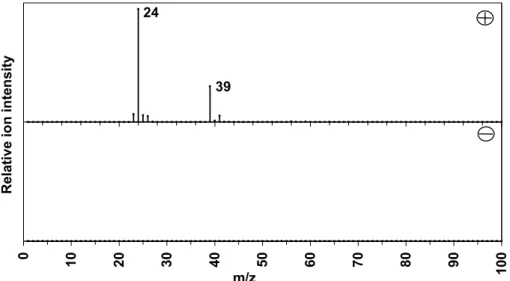
Cluster 1E (Fig. 2) is characterised by strong signal at m/z 24 and its temporal trend over the entire ATOFMS operational period is shown in Fig. 3. The positive ion mass spectrum shows other peaks at m/z 25 and m/z 26, due to the isotopic distribution of magnesium. The peak at m/z 23 is due to sodium, whilst the peaks at m/z 39
10
and m/z 41 are due to potassium. As already discussed in Dall’Osto et al. (2004), the maximum pure sea salt production occured when air was coming from the clean sector (180–250◦) at high wind speed. The Mg-rich particle type was also detected only during periods of fresh sea salt particle production. The size distribution of this unique type of particle is similar to the pure sea salt particles, showing a mono-modal
15
distribution peaking at 1.6 µm (as determined amongst the hit particles detected by the instrument) which remains at around 1.6 µm when a sensitivity scaling factor is applied to the data over the range 0.5–2.8 µm (Dall’Osto et al., 20052). This class is thought to be a biogenic particle. Chlorophyll, which is an essential component of marine phytoplankton is comprised of a cyclic organic structure, co-ordinated to a central atom
20
of magnesium.
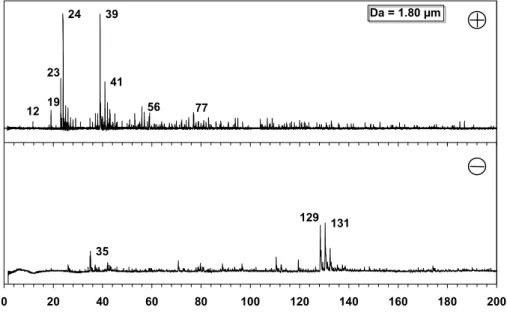
A further single particle mass spectrum belonging to this class is shown in Fig. 4. It has a strong [Mg]+ signal at m/z 24 and [MgCl3]− at m/z −129 with the Cl iso-topic distribution. There is a weak peak due to carbon at m/z 12 and m/z 36. There are indications of m/z 56, perhaps due to iron, an important ion present in biogenic
25
particles. A weak peak at m/z 77 could be an indication of the presence of aromatic compounds ([C6H5]+). About 5% of particles in this class showed the enhanced spec-trum exemplified by Fig. 4; the majority were more similar to Fig. 2. Due to its proba-ble biogenic origin, this class will be further described in the next section, along with
ACPD
5, 10799–10838, 2005Studies of aerosol using two aerosol mass spectrometers M. Dall’Osto et al. Title Page Abstract Introduction Conclusions References Tables Figures J I J I Back Close
Full Screen / Esc
Print Version
Interactive Discussion
EGU organic-containing particle types. The AMS results will help to provide further insight
into this class.
Two types of dust particles were found during the campaign (3A and 3B in Table 1), one Ca-rich due to a more local source and with little temporal variation, and the other Al-Si rich due to Saharan dust particles with a strong peak on 6/12/13/14 August 2002
5
when back trajectories revealed transport from the Sahara. Again, further detailed information can be found in Dall’Osto et al. (2004).
3.2. Organic classes
3.2.1. Local isolated episodes
A local episode of carbon rich-particles was recorded on 5 August between 01:00 and
10
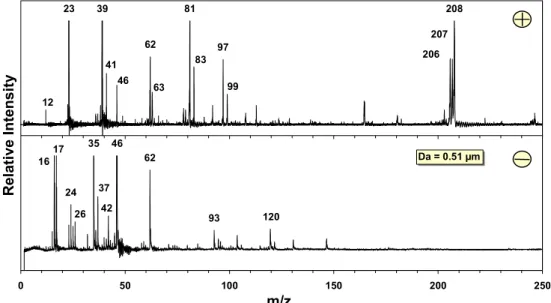
02:00 h (cluster 2E in Table 1). A single particle mass spectrum of this specific class is shown in Fig. 5. Peaks due to NaCl (m/z 23, m/z 81 and m/z −93), KCl (m/z 97 and m/z 113) and lead (m/z 208) can be seen. On further analysis of these single mass spectra, an association with carbon was also found (m/z 12 and m/z −24). These particles were the only lead-containing particles detected during the campaign and
15
they might have been generated from a combustion source near the site. Surprisingly, these particles exhibited a size distribution mode around 700 nm, which may be the reason that the AMS did not see any difference during this period. The AMS would have seen a small mode in the organic size distribution and an aliphatic mass spectral signature if combustion particles were present. It would not have seen supermicron
20
particles, but a combustion source would have a significant sub-100 nm mode, unless aged highly.
The AMS nevertheless, on 10 August 2002 between 18:00 and 19:00 h detected a notable excursion of the organic mass concentration which leapt from less than 1 µg m−3 to around 4 µg m−3. At this time, the inlet was set to sample at 7 m and a casual
25
observation was made that some motorboats were operating a short distance off the coast. The ATOFMS detected a small spike of organic-containing particles during the
ACPD
5, 10799–10838, 2005Studies of aerosol using two aerosol mass spectrometers M. Dall’Osto et al. Title Page Abstract Introduction Conclusions References Tables Figures J I J I Back Close
Full Screen / Esc
Print Version
Interactive Discussion
EGU same hour.
Three other types of carbon clusters are listed in section 2D of Table 1. They rep-resent Na-EC, NaCl-SOx and NaCl-C. The spectra are characterized by sodium with elemental carbon (Na-EC; main peaks m/z 12, 23, 36 and m/z −24, −36, −48), sodium chloride with sulphate (NaCl-SOx; main peaks 23, −35 and −96) and sodium chloride
5
with carbon (NaCl-C; main peaks m/z 12, 23, 36 and −35). These three clusters did not present strong temporal trends and few particles were apportioned to them, mainly within polluted episodes as described in the next section. The average spectra, not shown, present a broad monomodal size distribution between 1.5 and 2.0 µm. Ox-carbon (cluster 4C) is another specific type of spectrum characterized by m/z 27 and
10
m/z 43, which we attribute to [C2H+3] and [C2H3O+], respectively, although other inter-pretations are possible. This cluster did not occur very often, and only during polluted episodes.
3.2.2. General carbon classes
Three broad classes of carbon-containing particles were apportioned during
15
NAMBLEX. Clusters 2A, 2B and 2C represent carbon-containing particles and carbon/sulphate-containing particles and elemental carbon (EC), respectively. The cor-relation between them is very good (R2>0.85) and their temporal trends are shown in
Fig. 6. EC apportions for a much smaller fraction (1.6%) in comparison to cluster 2A and 2B, but the spikes of this type of particle were correlated with the other types of
20
carbon-containing particles.
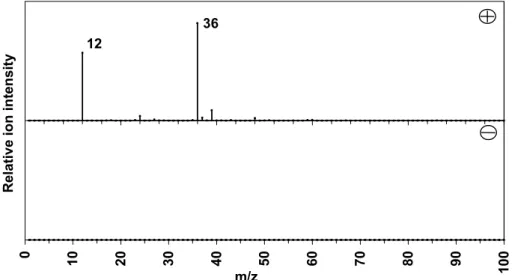
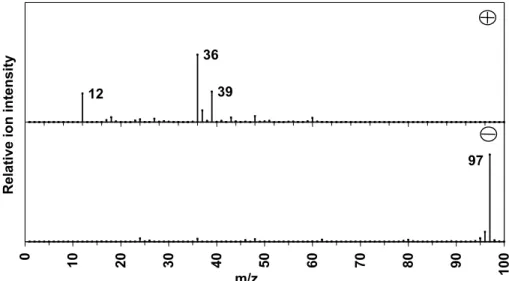
The broad containing particles class comprises two main clusters: carbon-containing particles and carbon/sulphate-carbon-containing particles and their spectra can be found in Figs. 7 and 8. It is important to note that no significant signal was recorded above m/z 100. The first type presents only two peaks at m/z 12 and m/z 36, whilst the
25
second presents a more complex signature, with sulphate (m/z −97). The peak at m/z 39 is probably due to the organic fragment (C3H3)+, but could be due to potassium too. Whilst the former exhibits a monomodal distribution centred at 0.6 µm in the unscaled
ACPD
5, 10799–10838, 2005Studies of aerosol using two aerosol mass spectrometers M. Dall’Osto et al. Title Page Abstract Introduction Conclusions References Tables Figures J I J I Back Close
Full Screen / Esc
Print Version
Interactive Discussion
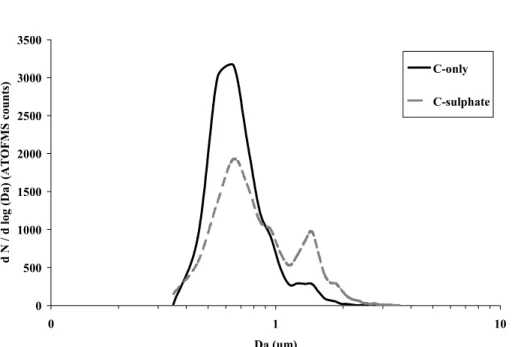
EGU size distribution, the latter shows a bimodal distribution peaking at 0.6 and 1.4 µm. The
size distributions of clusters 2A and 2B are shown in Fig. 9.
Meteorological conditions were divided into three main distinct periods (as explained in Coe et al., 20051, and Norton et al., 2005). The first five days (1–5 August 2002) were characterised by polluted air from Europe, with a stationary low pressure
posi-5
tioned over Ireland and the site experiencing NE winds, which were often light; recir-culating weak fronts were present on several days. The second period (5–12 August 2002) was characterised by the Azores high extended further towards Ireland and the winds became westerly to north westerly, The third ATOFMS period (12–21 August 2002) was mainly characterised by air coming from the clean sector (not influenced by
10
anthropogenic activity).
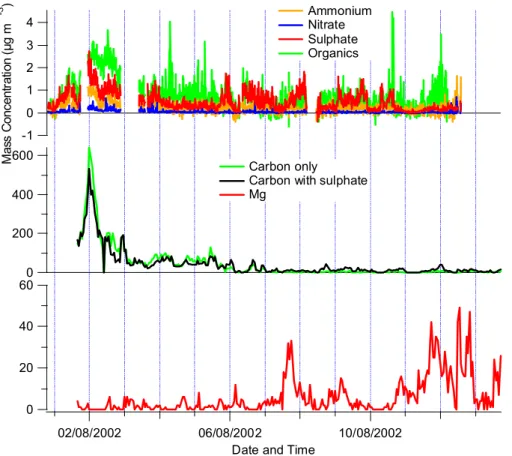
The ATOFMS observations are supported by the AMS results, as shown in Fig. 10. The overall behavior of the particles was largely very similar to the other MBL experi-ments conducted with the AMS (Allan et al., 2004; Topping et al., 2004), in that sulphate and organics dominated the loadings roughly equally overall with mean concentrations
15
of 0.56 and 0.65 µg m−3, respectively, and there was only a very small contribution from nitrate, at an average of 0.05 µg m−3. Ammonium is present at an average of 0.18 µg m−3, but does not always completely neutralise the sulphate. However, the overall loadings were smaller compared to the other studies. The highest concentra-tions occurred around 1–5 August, when the calculated back trajectory arrived from
20
the east, across Ireland, England and mainland Europe. In the first period (1–5 August 2002) there is more organic carbon than sulphate. In the second period (5–12 August 2002) the situation is reversed, with the sulphate load higher than carbonaceous mate-rial. It is important to remember that during the first period also the ATOFMS detected the highest number of carbon containing particles (cluster 2A), as already described
25
ACPD
5, 10799–10838, 2005Studies of aerosol using two aerosol mass spectrometers M. Dall’Osto et al. Title Page Abstract Introduction Conclusions References Tables Figures J I J I Back Close
Full Screen / Esc
Print Version
Interactive Discussion
EGU 3.2.3. Biogenic particles
As introduced in Sect. 3.1, cluster 1E (Fig. 2) is characterised by strong signal at m/z 24 which is due to magnesium. This particle type was detected only during periods of fresh sea salt particle production. Recent studies conducted at University of Califor-nia (San Diego) have reported a unique type of magnesium-rich particle found only
5
in biologically productive environments based on simultaneous DMS and seawater chlorophyll measurements (Prather, 20053). However, Prather (2005)3 reports a de-tection efficiency-corrected mode in the size distribution of <1 µm, whilst in our data the diameter mode is at around 1.6 µm, and only 2% of the unscaled particles are sub-micrometer. When the ATOFMS counts are scaled (Allen et al., 2000; Wenzel, 2003;
10
Dall’Osto, 2005), the size distribution of this unique type of Mg-rich particle still peaks at around 1.6 µm, but the contribution to the sub-micrometer fraction increases. This clus-ter (1E) of Mg-rich particles represents a significant fraction of the sub-micron mode (60%) detected with the ATOFMS during the clean periods and thus could be mak-ing some contribution to the biogenic sub-micrometer organics reported by O’Dowd et
15
al. (2004). However, there are uncertainties attached to the size distribution inferred in our study which result from the extreme inefficiency of the ATOFMS standard inlet at very small particle size (which makes the scaling factor uncertain) and which would be resolved by the use of an aerodynamic lens inlet (Su et al., 2004).
AMS results were compared in order to better understand this unique type of particle
20
detected a Mace Head during NAMBLEX. This is taken from three periods when both instruments were operating. As seen in Fig. 11, around 1000 nm diameter, there is an enhancement of the organic content compared to the sulphate in the two clean cases, which would be consistent with the hypothesis that Mg is an indicator of the presence of organic species in the sea salt particles.
25
The contrast is that both in clean marine periods where Mg was not observed by 3
Prather, K. A.: Atmospheric enrichment of ocean-derived biogenic particles: Single particle composition correlations with traditional indicators of biogenic activity, in preparation, 2005.
ACPD
5, 10799–10838, 2005Studies of aerosol using two aerosol mass spectrometers M. Dall’Osto et al. Title Page Abstract Introduction Conclusions References Tables Figures J I J I Back Close
Full Screen / Esc
Print Version
Interactive Discussion
EGU the ATOFMS, and polluted periods, the organic and sulphate mass size distributions
as measured by the AMS are very similar above 200 nm, displaying a single broad accumulation mode centred at 350 nm and showing little signal above 600 nm. In the polluted case, a large organic mode below 200 nm is evident, characteristic of recently emitted pollution aerosol as has been seen in many urban locations previously (Allan
5
et al., 2003b; Alfarra et al., 2004). However, when Mg-rich particles are observed by the ATOFMS, the organic mass distributions measured by the AMS show enhanced loading in the 600 nm to 1000 nm size range. As the transmission efficiency of the lens used in the AMS falls away above 600 nm and is close to zero at 2 µm (Jayne et al., 2000), it is likely that a significant fraction of the organic loading in this mode is in the
10
coarse mode above 1 µm.
This can also be seen in Fig. 12. The top chart shows the AMS coarse (600–1000 nm aerodynamic diameter) to fine (less than 600 nm) mass ratio for organics and sulphate. It should be noted that this ratio is not an absolute measure because the transmission of coarse particles though the aerodynamic lens is poor. However, this chart can
pro-15
vide useful qualitative information. At most times the organic fraction is similar to the sulphate fraction. However, when the ATOFMS detects Mg-rich particles, the organic coarse fraction increases whereas the sulphate coarse fraction does not. This result supports the idea that Mg-rich particles detected with the ATOFMS contain organic matter.
20
Apparent differences between our observations and those of O’Dowd et al. (2004) may have a number of explanations. Firstly, the NAMBLEX campaign was not char-acterised by a high level of marine biogenic activity (C. D. O’Dowd, personal commu-nication) and also did not experience a high frequency of wind directions in the clean maritime sector.
25
Moreover, two main instrumental issues need to be kept in mind:
1. ATOFMS efficiency for the finest size fractions (0.06–0.25 µm) reported by O’Dowd et al. (2004) is very low, meaning that most of the particles in this size range are missed. The deployment of an ATOFMS with an aerodynamic lens
ACPD
5, 10799–10838, 2005Studies of aerosol using two aerosol mass spectrometers M. Dall’Osto et al. Title Page Abstract Introduction Conclusions References Tables Figures J I J I Back Close
Full Screen / Esc
Print Version
Interactive Discussion
EGU would solve this limitation, because the efficiency in the sub-micron mode would
be substantially increased (Su et al., 2004).
2. The mass loading of this biogenic particle type is not high enough to be discrimi-nated above the background level of organic aerosols detected by the AMS during NAMBLEX having the same accumulation mode size distributions as sulphate,
5
likely to be due to long range transport of air pollutants.
These particles may contribute significantly to the total number of particles in the sub-micron mode, but they were missed by the ATOFMS (due its poor efficiency in low particle size ranges). The solid line on Fig. 11 shows the mass loading of carbon for the clean period with the presence of Mg-rich particles. The mass loading in the
10
200–400 µm range is roughly double that of the sulphate. It could be that this car-bon contribution is due to the biogenic particles, but because of the limitation of the ATOFMS efficiency and the absence of single particle information from the AMS, it is not possible to draw conclusions on this. Further studies need to be carried out in the same location during periods of high biogenic activity.
15
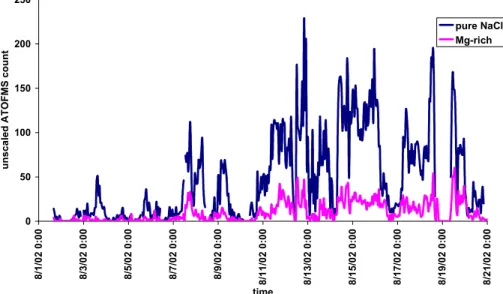
This Mg-particle type was found to be more abundant during episodes of heavy rain, suggesting the bubble-bursting processes could perhaps be enriched by rain droplets falling on the ocean surface as shown in Fig. 13. The highest concentrations of Mg-rich particles (relative to the total number of fresh sea salt particles) were recorded during period of intense rain, regardless of the wind speed.
20
In order to better understand the importance of the Mg-rich particles, ART 2a was run only on particles with m/z 24. 89 902 particles presented a peak at m/z 24, representing 47% of the particles detected. The peak at m/z 24 can be due either to Mg+ and/or [C2]+. 90% of the particles were classified within the top 15 clusters. Because of the frequent occurrence of the peak at m/z 24, most of the classes are similar to the ones
25
obtained by considering all the peaks. Three clusters presented a strong Mg signal and the Mg rich type particles again correlate very well with the pure NaCl particles. Two of the clusters were essentially the same, with only a small difference in the intensity
ACPD
5, 10799–10838, 2005Studies of aerosol using two aerosol mass spectrometers M. Dall’Osto et al. Title Page Abstract Introduction Conclusions References Tables Figures J I J I Back Close
Full Screen / Esc
Print Version
Interactive Discussion
EGU of the potassium signal. Class 10 presents a strong signal due to Mg, associated
with a strong Na signal. This class did not correlate with pure sea salt. Instead, it seems to correlate with the total number of particles detected, most of which was apportioned to the main sea-salt class. Only the Mg-rich particles with a weak signal due to sodium correlated with fresh sea salt particles. The available evidence suggests
5
that these particles derive from photosynthetic organisms, presumably arising from the sea surface
3.3. Minor classes
The minor classes show very little temporal trends, mostly correlated with periods of anthropogenic episodes. Vanadium correlates with polluted episodes. This is very
10
a specific cluster due the high ATOFMS response to vanadium (m/z 51 and m/z 67) (Song et al., 1999; Allen et al., 2000; Pastor et al., 2003; Dall’Osto et al., 2004).
Amines are another type of cluster that present characteristic peaks, such as m/z 58 and m/z 86 (Angelino et al., 2001). This type of particle was detected only when Saharan dust particles were also detected. This correlation is unexplained.
15
The majority of the unclassified particles (cluster 4D) presented only one or two dis-tinguishable m/z signals (m/z 23 [Na]+ and/or m/z 39 [K]+) in the positive spectrum and none in the negative. These particles correlated with the total number of parti-cles detected during NAMBLEX. The ATOFMS is very sensitive to alkali metal cations (Gross et al., 2000), and since sodium and potassium are present in large abundance
20
in sea-salt particles, it is not surprising that these are the only peaks visible in some spectra.
4. Conclusion
The ATOFMS data analysis in this project has tested the abilities of the ART-2a algo-rithm versus the very laborious use of selection rules which we applied in our earlier
ACPD
5, 10799–10838, 2005Studies of aerosol using two aerosol mass spectrometers M. Dall’Osto et al. Title Page Abstract Introduction Conclusions References Tables Figures J I J I Back Close
Full Screen / Esc
Print Version
Interactive Discussion
EGU paper (Dall’Osto et al., 2004). Reassuringly, the two very different techniques provide
a very similar set of particle categories based on the three major groups of sea salt derived, carbon-based and dust particles. With these main categories a number of distinct minor categories are identifiable. The ATOFMS is a powerful instrument for determining the extent of chemical processing of marine aerosol particles as well as
5
identifying carbonaceous and dust particles from distinct source categories.
In this paper we report a type of particle not identified in our earlier data analysis. Following pioneering work by Prather et al. (2005)3 we identify a magnesium-rich par-ticle type which appears to derive from photosynthetic plankton suspended from the sea surface. Valuable complementary data supporting the ocean as a source of this
10
particle type derives from the AMS instrument. Together, these provide a very powerful combination for characterising airborne particulate matter.
Further studies need to be carried out at the same location during period of high biological activity in order to better understand the properties of these particles.
Acknowledgements. The authors are grateful to the Natural Environment Research Council for
15
funding this work as part of the NAMBLEX Consortium project coordinated by D. Heard (Uni-versity of Leeds). They also thank D. C. S. Beddows (Uni(Uni-versity of Wales, UK), R. P. Kinnersley (Environment Agency, UK) and M. Flynn (University of Manchester, UK) for sampling at Mace Head during NAMBLEX. Last, but not least, S. Toner (USCD) and J. O. Allan (Arizona State University) for helping in importing and analyzing TSI ATOFMS data.
20
References
Alfarra, M. R., Coe, H., Allan, J. D., et al.: Characterization of urban and rural organic particulate in the lower Fraser valley using two aerodyne aerosol mass spectrometers, Atmos. Environ., 38(34), 5745–5758, 2004.
Allan, J. D., Alfarra, M. R., Bower, K. N., et al.: Quantitative sampling using an Aerodyne
25
aerosol mass spectrometer: 2. Measurements of fine particulate chemical composition in two UK cities, J. Geophys. Res., 108(D9), art. no. 4284, 2003a.
ACPD
5, 10799–10838, 2005Studies of aerosol using two aerosol mass spectrometers M. Dall’Osto et al. Title Page Abstract Introduction Conclusions References Tables Figures J I J I Back Close
Full Screen / Esc
Print Version
Interactive Discussion
EGU Allan, J. D., Jimenez, J. L., Williams, P. I., et al.: Quantitative sampling using an Aerodyne
aerosol mass spectrometer: 1. Techniques of data interpretation and error analysis, J. Geo-phys. Res., 108(D9), art. no. 4283, 2003b.
Allen, J. O., Fergenson, D. P., Gard, E. E., et al.: Particle detection efficiencies of aerosol time of flight mass spectrometers under ambient sampling conditions, Environ. Sci. Technol., 34(1),
5
211–217, 2000.
Angelino, S., Suess, D. T., and Prather, K. A.: Formation of aerosol particles from reactions of secondary and tertiary alkylamines: Characterization by aerosol time-of- flight mass spec-trometry, Environ. Sci. Technol., 35(15), 3130–3138, 2001.
Beddows, D. C. S., Donovan, R. J., Harrison, R. M., et al.: Correlations in the chemical
com-10
position of rural background atmospheric aerosol in the UK determined in real time using time-of-flight mass spectrometry, J. Environ. Monit., 6(2), 124–133, 2004.
Bhave, P. V., Allen, J. O., Morrical, B. D., et al.: A field-based approach for determining ATOFMS instrument sensitivities to ammonium and nitrate, Environ. Sci. Technol., 36(22), 4868–4879, 2002.
15
Dall’Osto, M., Beddows, D. C. S., Kinnersley, R. P., et al.: Characterization of individual air-borne particles by using aerosol time-of-flight mass spectrometry at Mace Head, Ireland, J. Geophys. Res., 109(D21), art. no. D21302, 2004.
Gard, E., Mayer, J. E., Morrical, B. D., et al.: Real-time analysis of individual atmospheric aerosol particles: Design and performance of a portable ATOFMS, Anal. Chem., 69(20),
20
4083–4091, 1997.
Gard, E. E., Kleeman, M. J., Gross, D. S., et al.: Direct observation of heterogeneous chemistry in the atmosphere, Science, 279(5354), 1184–1187, 1998.
Gross, D. S., Galli, M. E., Silva, P. J., and Prather, K. A.: Relative sensitivity factors for alkali metal and ammonium cations in single particle aerosol time-of-flight mass spectra, Anal.
25
Chem., 72(2), 416–422, 2000.
Harrison, R. M., Msibi, M. I., Kitto, A. M. N., and Yamulki, S.: Atmospheric Chemical-Transformations of Nitrogen-Compounds Measured in the North-Sea Experiment, Septem-ber 1991, Atmos. Environ., 28(9), 1593–1599, 1994.
Harrison, R. M. and Pio, C. A.: Size-Differentiated Composition of Inorganic Atmospheric
30
Aerosols of Both Marine and Polluted Continental Origin, Atmos. Environ., 17(9), 1733– 1738, 1983.
ACPD
5, 10799–10838, 2005Studies of aerosol using two aerosol mass spectrometers M. Dall’Osto et al. Title Page Abstract Introduction Conclusions References Tables Figures J I J I Back Close
Full Screen / Esc
Print Version
Interactive Discussion
EGU size and composition analysis of submicron particles, Aerosol Sci. Technol., 33(1–2), 49–70,
2000.
Jennings, S. G., Geever, M., McGovern, F. M., et al.: Microphysical and physico-chemical char-acterization of atmospheric marine and continental aerosol at Mace Head, Atmos. Environ., 31(17), 2795–2808, 1997.
5
Jimenez, J. L., Jayne, J. T., Shi, Q., et al.: Ambient aerosol sampling using the Aerodyne Aerosol Mass Spectrometer, J. Geophys. Res., 108(D7), art. no. 8425, 2003.
Johnston, M. V. and Wexler, A. S.: On the Cover – Ms of Individual Aerosol-Particles, Anal. Chem., 67(23), A721–A726, 1995.
Kleefeld, S., Hoffer, A., Krivacsy, Z., and Jennings, S. G.: Importance of organic and black
10
carbon in atmospheric aerosols at Mace Head, on the West Coast of Ireland (53 degrees 190 N, 9 degrees 540W), Atmos. Environ., 36(28), 4479–4490, 2002.
McMurry, P. H.: A review of atmospheric aerosol measurements, Atmos. Environ., 34(12–14), 1959–1999, 2000.
Middlebrook, A. M., Murphy, S. M., Lee, S. H., et al.: A comparison of particle mass
spectrom-15
eters during the 1999 Atlanta Supersite Project, J. Geophys. Res., 108(D7), art. no. 8424, 2003.
Moffet, R., Shields, L., Berntsen, J., et al.: Characterization of an Ambient Coarse Particle Con-centrator Used for Human Exposure Studies: Aerosol Size Distributions, Chemical Compo-sition, and Concentration Enrichment, Aerosol Sci. Technol., 38(11), 1123–1137, 2004.
20
Neubauer, K. R., Johnston, M. V., and Wexler, A. S.: On-line analysis of aqueous aerosols by laser desorption ionization, Int. J. Mass Spectrom., 163(1–2), 29–37, 1997.
Norton, E. G., Vaughan, G., Methven, J., et al.: Boundary layer structure and decoupling from synoptic scale flow during NAMBLEX, Atmos. Chem. Phys. Discuss., 5, 3191–3223, 2005,
SRef-ID: 1680-7375/acpd/2005-5-3191.
25
Novakov, T. and Penner, J. E.: Large Contribution of Organic Aerosols to Cloud-Condensation-Nuclei Concentrations, Nature, 365(6449), 823–826, 1993.
O’Dowd, C. D., Facchini, M. C., Cavalli, F., et al.: Biogenically driven organic contribution to marine aerosol, Nature, 431(7009), 676–680, 2004.
Pakkanen, T. A.: Study of formation of coarse particle nitrate aerosol, Atmos. Environ., 30(14),
30
2475–2482, 1996.
Pastor, S. H., Allen, J. O., Hughes, L. S., et al.: Ambient single particle analysis in River-side, California by aerosol time-of-flight mass spectrometry during the SCOS97-NARSTO,
ACPD
5, 10799–10838, 2005Studies of aerosol using two aerosol mass spectrometers M. Dall’Osto et al. Title Page Abstract Introduction Conclusions References Tables Figures J I J I Back Close
Full Screen / Esc
Print Version
Interactive Discussion
EGU Atmosp. Environ., 37(2), 239–258, 2003.
Prather, K. A., Nordmeyer, T., and Salt, K.: Real-Time Characterization of Individual Aerosol-Particles Using Time-of-Flight Mass-Spectrometry, Anal. Chem., 66(9), 1403–1407, 1994. Raes, F., Van Dingenen, R., Vignati, E., et al.: Formation and cycling of aerosols in the global
troposphere, Atmos. Environ., 34(25), 4215–4240, 2000.
5
Schneider, J., Borrmann, S., Wollny, A. G., et al.: Online mass spectrometric aerosol measure-ments during the MINOS campaign (Crete, August 2001), Atmos. Chem. Phys., 4, 65–80, 2004,
SRef-ID: 1680-7324/acp/2004-4-65.
Song, X. H., Hopke, P. K., Fergenson, D. P., and Prather, K. A.: Classification of single particles
10
analyzed by ATOFMS using an artificial neural network, ART-2A, Anal. Chem., 71(4), 860– 865, 1999.
Su, Y. X., Sipin, M. F., Furutani, H., and Prather, K. A.: Development and characterization of an aerosol time-of-flight mass spectrometer with increased detection efficiency, Anal. Chem., 76(3), 712–719, 2004.
15
Suess, D. T. and Prather, K. A.: Mass spectrometry of aerosols, Chem. Rev., 99(10), 3007– 3035, 1999.
Topping, D., Coe, H. McFiggans, G., et al.: Aerosol chemical characteristics from sampling conducted on the Island of Jeju, Korea during ACE Asia, Atmos. Environ., 38(14), 2111– 2123, 2004.
20
Wenzel, R. J., Liu, D.-Y., Edgerton, E. S., and Prather, K. A.: Aerosol time-of-flight mass spec-trometry during the Atlanta Supersite Experiment: 2. Scaling procedures, J. Geophys. Res., 108(D7), art. no. 8427, 2003.
Wenzel, R. J. and Prather, K. A.: Improvements in ion signal reproducibility obtained using a homogeneous laser beam for on-line laser desorption/ionization of single particles, Rapid
25
Commun. Mass Spectrom., 18(13), 1525–1533, 2004.
Yadav, R., Saoud, K., Rasouli, F., et al.: Study of cigarette smoke aerosol using time of flight mass spectrometry, J. Anal. Appl. Pyrolysis, 72(1), 17–25, 2004.
ACPD
5, 10799–10838, 2005Studies of aerosol using two aerosol mass spectrometers M. Dall’Osto et al. Title Page Abstract Introduction Conclusions References Tables Figures J I J I Back Close
Full Screen / Esc
Print Version
Interactive Discussion
EGU
Table 1. Main ATOFMS clusters obtained using ART-2a.
Cluster number cluster type %
1 SEA SALT 69.2
1A pure NaCl 22.3
1B NaCl only positive 19.3
1C mixed NaClxNOy 14.5 1D NaCl strong −93 9 1E Mg-rich 2.6 1F Aged (NaNO3) 2.5 2 CARBON 20.6 2A Carbon (m/z 12, 36) 7.8 2B Carbon (m/z 12, 36 and −97) 8 2C EC 1.6
2D Na-EC, NaClSOx, NaCl-C 3.0
2E Combustion 0.2 3 DUST 4.8 3A AlSiOx 4.5 3B Ca-rich 0.3 4 OTHER 5.4 4A Amines 0.2 4B vanadium 0.2 4C Ox-carbon 0.3 4D unclassified 4.7
ACPD
5, 10799–10838, 2005Studies of aerosol using two aerosol mass spectrometers M. Dall’Osto et al. Title Page Abstract Introduction Conclusions References Tables Figures J I J I Back Close
Full Screen / Esc
Print Version
Interactive Discussion
EGU
Table 2. Comparison of ART-2a analysis with previous manual analysis of the ATOFMS dataset
obtained during NAMBLEX.
Class Class of particles Dall’Osto et al. (2004) This study Number (manual classification, %) (ART-2a classification, %)
1 Carbon 18 20.6
2 Dust 5.5 4.8
3 Sea-salt 47.5 69.2
4 Others 0 5.4
ACPD
5, 10799–10838, 2005Studies of aerosol using two aerosol mass spectrometers M. Dall’Osto et al. Title Page Abstract Introduction Conclusions References Tables Figures J I J I Back Close
Full Screen / Esc
Print Version
Interactive Discussion
EGU
29 Figure 1: ART-2a cluster (1D) positive (plus) and negative (minus) ion mass spectra of particles attributed to sodium chloride-rich with strong peak at m/z – 93, likely to be sea salt particles reacted with nitric acid. Note ART-2a spectra omit minor peaks which are presented in full spectra in Dall’Osto et al. (2004).
Figure 2: ART-2a cluster (1E) positive (plus) and negative (minus) mass spectra of particles attributed to Mg- rich particles
24 39 m/z Relative io n in ten sity 0 10 20 30 40 50 60 70 80 90 100 81 23 39 62 35 46 93 m/z Relative io n in ten sity 0 10 20 30 40 50 60 70 80 90 100
Fig. 1. ART-2a cluster (1D) positive (plus) and negative (minus) ion mass spectra of particles
attributed to sodium chloride-rich with strong peak at m/z −93, likely to be sea salt particles reacted with nitric acid. Note ART-2a spectra omit minor peaks which are presented in full spectra in Dall’Osto et al. (2004).
ACPD
5, 10799–10838, 2005Studies of aerosol using two aerosol mass spectrometers M. Dall’Osto et al. Title Page Abstract Introduction Conclusions References Tables Figures J I J I Back Close
Full Screen / Esc
Print Version
Interactive Discussion
EGU 29
Figure 1: ART-2a cluster (1D) positive (plus) and negative (minus) ion mass spectra of particles attributed to sodium chloride-rich with strong peak at m/z – 93, likely to be sea salt particles reacted with nitric acid. Note ART-2a spectra omit minor peaks which are presented in full spectra in Dall’Osto et al. (2004).
Figure 2: ART-2a cluster (1E) positive (plus) and negative (minus) mass spectra of particles attributed to Mg- rich particles
24 39 m/z Relative io n in ten sity 0 10 20 30 40 50 60 70 80 90 100 81 23 39 62 35 46 93 m/z Relative io n in ten sity 0 10 20 30 40 50 60 70 80 90 100
Fig. 2. ART-2a cluster (1E) positive (plus) and negative (minus) mass spectra of particles
ACPD
5, 10799–10838, 2005Studies of aerosol using two aerosol mass spectrometers M. Dall’Osto et al. Title Page Abstract Introduction Conclusions References Tables Figures J I J I Back Close
Full Screen / Esc
Print Version
Interactive Discussion
EGU
30 Figure 3: Hourly average temporal trends of Mg-rich particles (Mg) with pure sea salt particles (NaClx). The correlation between the two types of particles is R2 =0.8
Figure 4: Aerosol time-of-flight mass spectrometry (ATOFMS) single-particle positive (plus) and negative (minus) ion mass spectra of a particle attributed to Mg-rich particles (cluster 1E).
12 19 23 24 39 41 56 77 35 131 129 0 20 40 60 80 100 120 140 160 180 200 Da = 1.80 µm 0 50 100 150 200 250 8/1/02 0:00 8/3/02 0:00 8/5/02 0:00 8/7/02 0:00 8/9/02 0:00 8/11/02 0:00 8/13/02 0:00 8/15/02 0:00 8/17/02 0:00 8/19/02 0:00 8/21/02 0:00 time unscaled A T OFMS count pure NaCl Mg-rich
Fig. 3. Hourly average temporal trends of Mg-rich particles (Mg) with pure sea salt particles
(NaClx). The correlation between the two types of particles is R2=0.8.
ACPD
5, 10799–10838, 2005Studies of aerosol using two aerosol mass spectrometers M. Dall’Osto et al. Title Page Abstract Introduction Conclusions References Tables Figures J I J I Back Close
Full Screen / Esc
Print Version
Interactive Discussion
EGU 30
Figure 3: Hourly average temporal trends of Mg-rich particles (Mg) with pure sea salt particles (NaClx). The correlation between the two types of particles is R2 =0.8
Figure 4: Aerosol time-of-flight mass spectrometry (ATOFMS) single-particle positive (plus) and negative (minus) ion mass spectra of a particle attributed to Mg-rich particles (cluster 1E).
12 19 23 24 39 41 56 77 35 131 129 0 20 40 60 80 100 120 140 160 180 200 Da = 1.80 µm 0 50 100 150 200 250 8/1/02 0:00 8/3/02 0:00 8/5/02 0:00 8/7/02 0:00 8/9/02 0:00 8/11/02 0:00 8/13/02 0:00 8/15/02 0:00 8/17/02 0:00 8/19/02 0:00 8/21/02 0:00 time unscaled A T OFMS count pure NaCl Mg-rich
Fig. 4. Aerosol time-of-flight mass spectrometry (ATOFMS) single-particle positive (plus) and
ACPD
5, 10799–10838, 2005Studies of aerosol using two aerosol mass spectrometers M. Dall’Osto et al. Title Page Abstract Introduction Conclusions References Tables Figures J I J I Back Close
Full Screen / Esc
Print Version
Interactive Discussion
EGU
31 Figure 5. Single particle positive (plus) and negative (minus) ion mass spectra of a particle of 1.06 µm detected during a polluted event
Figure 6: ATOFMS hourly average temporal trends of pure carbon, carbon with sulphate and elemental carbon particles
208 207 206 99 97 83 81 63 62 46 41 39 12 23 120 93 62 46 42 37 35 26 24 17 16 m/z R ela tiv e In te n sity 0 50 100 150 200 250 Da = 0.51 µm 0 100 200 300 400 500 600 700 8/1/02 0: 00 8/2/02 0: 00 8/3/02 0: 00 8/4/02 0: 00 8/5/02 0: 00 8/6/02 0: 00 8/7/02 0: 00 8/8/02 0: 00 8/9/02 0: 00 8/10/02 0: 00 8/11/02 0: 00 8/12/02 0: 00 8/13/02 0: 00 8/14/02 0: 00 8/15/02 0: 00 8/16/02 0: 00 8/17/02 0: 00 8/18/02 0: 00 8/19/02 0: 00 8/20/02 0: 00 time unscaled A T O F M S count s pure-carbon carbon-sulphate EC
Fig. 5. Single particle positive (plus) and negative (minus) ion mass spectra of a particle of
1.06 µm detected during a polluted event.