HAL Id: hal-00295358
https://hal.archives-ouvertes.fr/hal-00295358
Submitted on 12 Nov 2003
HAL is a multi-disciplinary open access
archive for the deposit and dissemination of
sci-entific research documents, whether they are
pub-lished or not. The documents may come from
teaching and research institutions in France or
abroad, or from public or private research centers.
L’archive ouverte pluridisciplinaire HAL, est
destinée au dépôt et à la diffusion de documents
scientifiques de niveau recherche, publiés ou non,
émanant des établissements d’enseignement et de
recherche français ou étrangers, des laboratoires
publics ou privés.
design and application to clear sky and broken cloud
conditions
E. Eckstein, D. Perner, Ch. Brühl, T. Trautmann
To cite this version:
E. Eckstein, D. Perner, Ch. Brühl, T. Trautmann. A new actinic flux 4p-spectroradiometer:
instru-ment design and application to clear sky and broken cloud conditions. Atmospheric Chemistry and
Physics, European Geosciences Union, 2003, 3 (6), pp.1965-1979. �hal-00295358�
Chemistry
and Physics
A new actinic flux 4π -spectroradiometer: instrument design and
application to clear sky and broken cloud conditions
E. Eckstein1, D. Perner1, Ch. Br ¨uhl1, and T. Trautmann2
1Max-Planck-Institut f¨ur Chemie, Mainz, Germany 2Institut f¨ur Meteorologie, Universit¨at Leipzig, Germany
Received: 23 August 2002 – Published in Atmos. Chem. Phys. Discuss.: 11 November 2002 Revised: 17 February 2003 – Accepted: 19 February 2003 – Published: 12 November 2003
Abstract. A new 4π -spectroradiometer was developed for measuring actinic flux especially under cloudy conditions based on a fixed grating imaging spectrograph and a CCD-detector leading to a simultaneous measurement of the spec-trum. The new instrument incorporates a novel optical head with a 4π -field of view independent of angle of incidence. Comparisons with the actinic flux spectroradiometer of the Institute of Atmospheric Chemistry of Forschungszentrum J¨ulich showed a very good agreement within the limit of the uncertainties of the two instruments. Our spectroradiome-ter was applied to investigate the effects of broken clouds on the actinic flux and photolysis frequencies on the ground during the BERLIOZ campaign. Reductions as well as en-hancements compared to the clear sky case were seen, both effects are larger in the UV-A than the UV-B spectral region. Furthermore the new instrument was used for simultaneous measurements in different altitudes on a tower to study the transmission and attenuation of actinic flux in low clouds. A correlation of attenuation with the simultaneously measured liquid water content of the cloud was found.
1 Introduction
Photodissociation processes driven by solar radiation at ul-traviolet and visible wavelengths play a fundamental role in the chemistry of the atmosphere. As a consequence, precise determination of an in situ photolysis frequency is often as important as accurate measurement of the ambient mixing ratios of trace species. The simulation of photolysis frequen-cies is often used in atmospheric chemical models. For sta-ble cloud-free and clean air, photolysis frequencies can be modeled quite well. Theoretical investigations of the pho-tochemical relevant (“actinic”) radiation (Madronich, 1987;
Correspondence to: E. Eckstein
van Weele and Duynkerke, 1993; Ruggaber et al., 1994; Matthijsen et al., 1998; Reuder and Schwander, 1999; Liao et al., 1999) partially describe effects of clouds and aerosols but measurements are rare. For cloudy conditions radiation transfer models become quite complex, so that measurements for comparison purposes are greatly needed. The radiative parameter that determines the photolysis frequencies is the actinic flux F (λ), defined as the incident radiance integrated over all solid angles:
F (λ) = Z
L(λ, θ, φ)d (1)
where L(λ, θ, φ) denotes the spectral photon radiance. Knowing the wavelength dependent actinic flux F (λ) and also the absorption coefficient σAB(λ)of a molecule AB and
the quantum efficiency φAB→A+B(λ) of a certain reaction
path AB→A + B, the photolysis frequency JAB→A+B can
be calculated from JAB→A+B=
Z
F (λ)·σAB(λ)·φAB→A+B(λ)dλ. (2)
The techniques mostly used for measuring photolysis fre-quencies are filter radiometry (Junkermann et al., 1989; Brauers and Hofzumahaus, 1992; van Weele et al., 1995; Crawford et al., 1999) and chemical actinometry (Bahe et al., 1979; Dickerson et al., 1982; Parrish et al., 1983; Barai and Stedman, 1992; Shetter et al., 1992; Kelley et al., 1995). Chemical actinometers consist of a quartz glass tube contain-ing a gas mixture which is exposed to solar radiation. The photolysis frequency can then be determined from the mea-sured rate of change in the chemical gas composition. Filter radiometers measure the actinic flux integrated over a wave-length interval corresponding to a certain photolysis process, and are usually calibrated by comparison with chemical acti-nometers. Both techniques are suitable for only one particu-lar process. Most often the photolysis frequency J (NO2)and
a complete description of the chemistry of the atmosphere many more photolysis frequencies are needed which can be derived easily based on the relatively new third method of actinic flux spectroradiometry. The principle of this method is to measure a relevant spectrum of the actinic flux and then calculate the photolysis frequency by Eq. (2). With this method photolysis frequencies of any molecule can be deter-mined, as long as the species molecular parameters, i.e. the absorption coefficient and the quantum yield, are known and a suitable wavelength range is measured. As yet there are just two instruments described in the literature (Hofzuma-haus et al., 1999; Shetter and M¨uller, 1999). Both of these use an entrance optic for a 2π -field of view and a double monochromator combined with a photomultiplier for detec-tion of the actinic spectrum. This method is very good for measurements under stable conditions. However, for mea-surements under cloudy conditions, particularly where the extent of cloud cover is changeable, scanning the spectrum can lead to problems detecting different conditions for each wavelength interval: a distorted spectrum results. To avoid this problem we have developed a new actinic flux spectro-radiometer using a single monochromator, which detects the whole spectrum from 300 nm to 660 nm simultaneously. The new instrument incorporates a novel optical head with a 4π -field of view independent of angle of incidence, which is especially necessary for measurements in clouds or above snow, when the intensity of the upward radiation can be of the same order as that of the downward radiation. Another interesting and novel feature of our instrument is the possi-bility of measuring at three points concurrently, for example at different altitudes on a tower. Another application of this feature could be, for example, the determination of the ac-tinic flux at different heights in a forest.
The next section gives a detailed description of the in-strument, including calibration procedures and spectrome-ter stray-light correction, followed by a section where the uncertainties are summarized. Section 4 presents a com-parison of the measured actinic fluxes and photolysis fre-quencies with the double-monochromator-spectroradiometer of the Research Center J¨ulich for clear sky conditions and different solar zenith angles. Section 5 shows typical re-sults obtained with the new instrument during the BERLIOZ campaign for conditions with broken clouds. In this section wavelength-dependent attenuations and enhancements of the actinic flux near the ground by broken clouds are demon-strated. In the last section before the conclusions an example for the application of the instrument for simultaneous mea-surements at different altitudes in a cloud on a tower, accom-panied by measurements of cloud properties, is given.
2 Details of the spectroradiometer
For calculating photolysis frequencies the actinic flux over a 4π -field of view is required. Existing systems for measuring
actinic flux use optical heads for a 2π -field of view and usu-ally only measure the downward actinic flux. For ground-based measurements in the UV-B range (300–320 nm) the albedo is very small in most cases, but with increasing wave-length the albedo increases, so that the upward actinic flux may no longer be neglected. For measurements in clouds the upward component can be large. Existing actinic flux spec-troradiometers detect a wavelength range from 280–420 nm, but some atmospheric molecules are also photolysed in the visible wavelength range. In addition, for comparison with model calculations and to study the effects of clouds on the actinic flux, it is necessary to measure a large wavelength range very rapidly and simultaneously. Using a single grat-ing monochromator and a CCD-camera, the spectroradiome-ter described in this paper fulfills these requirements over the wavelength range 300–660 nm. The use of a CCD-camera for measuring spectral irradiance is also described by Harri-son et al. (1999).
2.1 Optical Collector
The optical collector is based on the principle of multiple scattering in a teflon sphere. The diameter of the diffusing sphere is 30 mm. Photons that enter the sphere lead to an isotropic radiation field, after a large number of scattering processes. The teflon sphere is screwed onto a small verti-cal metal tube (diameter 3 mm) housing a quartz glass fiber. Through this fiber a small part of the diffuse radiation field is lead into the spectrograph described below. The fibers (BTO and Ceram Optics) used had a 600 µm quartz core, a doped quartz cladding and an outer coating of polyamide. For pro-tection against mechanical damage and weather abrasion the fibers were housed inside a flexible metal or PVC tube. The best position of the end of the fiber in the sphere was de-termined experimentally using a goniometer. The collector was positioned in the middle of the axis of a rotating arm on which a lamp is mounted. During the development of the in-strument, measurements at different angle positions (steps of θ =5◦) of the lamp were carried out, which gave the relative response function Zp with respect to the position on top of
the collector, just opposite the exit of the fiber. The best po-sition found was approximately 3 mm below the center point of the sphere.
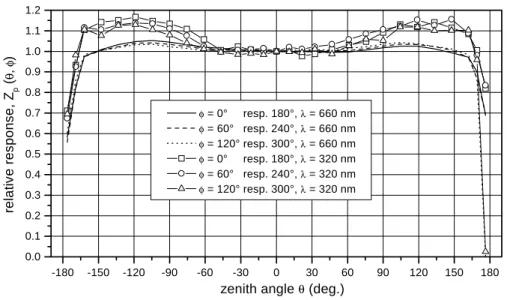
Figure 1 shows the relative response function Zpof one of
the collectors as a function of zenith angle θ . Zpwas found
to be independent of azimuth angle φ, which is clearly shown in the figure. The deviation of Zpfrom the ideal case of unity
increases strongly for polar angles |θ |>165◦because of the
shadow of the collector mounting. In the range |θ |<165◦ the angle dependence for 660 nm varies less than 5% from the ideal case. For 320 nm on the other hand the discrepancy from the ideal value of one increases up to 15% for |θ |=120◦. Thus there is an increasing dependence of Zpon polar angle
θwith decreasing wavelength. For correction of the angular and wavelength dependency of Zpa procedure was used to
-180 -150 -120 -90 -60 -30 0 30 60 90 120 150 180 0.0 0.1 0.2 0.3 0.4 0.5 0.6 0.7 0.8 0.9 1.0 1.1 1.2 φ = 0° resp. 180°, λ = 660 nm φ = 60° resp. 240°, λ = 660 nm φ = 120° resp. 300°, λ = 660 nm φ = 0° resp. 180°, λ = 320 nm φ = 60° resp. 240°, λ = 320 nm φ = 120° resp. 300°, λ = 320 nm re lat iv e r e sponse, Z p ( θ, φ )
zenith angle θ (deg.)
Fig. 1. Goniometrically determined relative response of the collector as a function of zenith angle θ at different azimuth angles. The negative
zenith angles correspond to the opposite azimuth angle, for example, the values of negative zenith angles for azimuth 8 = 0◦correspond to the azimuth angle 8=180◦.
transform the response function Zp(λ, θ ) into a correction
function ZH(λ, θ0)which depends on wavelength and on the
solar zenith angle, θ0. This transformation procedure was
introduced by Hofzumahaus et al. (1999) for an optical head for a 2π -field of view, where Zpis a function of solar zenith
angle but not of wavelength. For the new instrument this transformation was altered to allow for a 4π -field of view and a wavelength dependence of Zp(λ, θ ). This procedure
uses a simple model of atmospheric radiance L(λ, θ, φ) near the ground and is described in detail in Sect. 2.5.2.
2.2 The Monochromator
The CP200, a 0.2 m fixed grating imaging spectrograph for array detectors, in combination with a CCD-camera, forms the basis of the optical instrumentation. It is small, portable and robust, with no moving parts in the basic in-strument. Four different aberration-corrected concave holo-graphic gratings can be used with this spectrograph. With the grating used (200 g/mm), a spectrum from 190–820 nm with a length of 25 mm can be achieved. The width of the entrance slit can be varied from 50 µm to 150 µm. Using the 50 µm slit with a height of 8 mm a resolution between 1.8 nm and 2.8 nm can be achieved. With the CCD-camera the spec-tral range from 280 nm to 760 nm can be measured. Using the CCD-detector we are able to connect three quartz glass fibers to the spectrograph, so that three spectra from three op-tical collectors can be measured simultaneously. Three short fibers (length 12 cm) are aligned one on top of the other at the entrance slit. The distance between two fibers was set at 0.9 mm, to take maximum advantage of the height of the CCD-chip (4.6 mm). Each of these short pieces is connected
300 400 500 600 700 0 50 100 150 200 250 T rans m is s ion BG24A counts [a.u.] wavelength λ [nm] 0.0 0.2 0.4 0.6 0.8 1.0
Fig. 2. Effects of the filter and the optical collector: (—-) without
either filter or optical collector, (- - -) with filter BG24A (Fa. Schott) but without optical collector; (· · · · ·) with filter BG24A, optical collector and baffle; (−· − ·−) transmission of the filter. The spectra are scaled to approximately the same maximum value in the visible ranges for better illustration of the relation of the UV with equal dynamic range of the CCD.
with a fiber of an optical collector using a FSMA-coupling. The length of the fibers of the collectors varies between 30 and 70 m.
The intensity of the visible light in the solar spectrum is much higher than that in the UV range. To be able to mea-sure both in the same spectrum with a sufficient signal in-tensity within the dynamical range of the CCD, we equipped our spectrograph with a filter (BG24A, Schott, thickness d = 0.5 mm) to reduce the intensity of the visible light. The filter
87.2E4 51.7E4 30.8E4 18.3E4 10.8E4 6.4E4 3.8E4 2.3E4 counts 1000 800 600 400 200 Ro ws Wavelength / nm
3
2
1
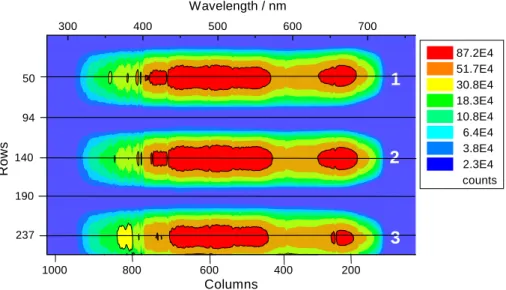
50 94 140 190 237 Columns 300 400 500 600 700Fig. 3. Image of the CCD-chip when three optical collectors are connected. Rows number 94 und 190 are used as spectrometer stray-light
spectra.
was mounted directly at the rear of the slit. Its maximum transmission is at 300 nm. The largest reduction of the inten-sity of about 80% is at ca. 580 nm. For longer wavelengths the transmission increases with increasing wavelength; Con-sequently, the light of wavelengths λ > 660 nm was dimmed mechanically. The performance of the filter and the optical collector are shown in Fig. 2. The solid line in the figure shows the spectrum obtained without either the filter or the collector. Using the filter (dashed line), a much higher sig-nal is obtained in the UV-range, but with the same maximum intensity in the visible range. The spectrum with filter, col-lector and baffle (dotted line) shows a change of the spectral intensity distribution compared to the spectrum without col-lector and baffle.
The spectrograph is mounted together with the CCD-camera on a steelplate. To prevent wavelength shifts because of thermal expansion the spectrograph is housed inside a sty-rodur box which is temperature stabilized at 35◦C.
2.3 The detector
As mentioned previously the detector is a CCD-camera (EG & G). The camera uses a CCD-chip provided by Thomson CSF, Modell THX-7885M, which is a matrix of 1024×256 quadratic pixels of width 19 µm, resulting in a surface of 19.456×4.864 mm2. It has a dynamical range of 18 bits. The exposure time is controlled with a shutter in front of the chip. For protection against mechanical damage, condensation of water vapor and chemical reactions, the CCD-chip is her-metically enclosed in a quartz glass container. A three-step peltier-cascade on its rear face transports excess heat to a liq-uid cooling system. Using water as coolant it is possible to achieve chip temperatures of −64◦C, leading to a very small dark current. The quantum efficiency of ordinary CCD-chips
drops to very low values for wavelength <400 nm. To im-prove the quantum efficiency, a luminescence layer was ap-plied to the CCD surface in the production process. Thereby the quantum efficiency in the UV is about 0.2 compared to 0.2–0.37 in the visible wavelength range.
2.4 Data processing
For measurement and data processing from the CCD out-put an extended version of the program “MFC” (Heismann, 1996) was used. This program offers the possibility to save the whole picture (intensity of every pixel), single rows or sums of several rows of the CCD.
Figure 3 shows the intensity distribution on the CCD-chip using three optical collectors simultaneously. The image of one collector covers about 50 rows. Ten rows in the range of the maximum intensity of these 50 rows are summed in a single spectrum to achieve the highest signal-to-noise-ratio. For three connected collectors three spectra are obtained; in addition, two single rows (row 94 and 190) are saved with each measurement. These two rows are located in the middle between the images of two collectors and are used for trometer stray-light correction (see Sect. 2.4.1). The spec-tra are recorded automatically; one measurement usually in-corporates several scans to improve the signal-to-noise-ratio. The exposure time is calculated using the exposure time of the previous spectrum and the intensity in the wavelength range 500–600 nm. The average signal value of this wave-length range is compared with a target value and determines the exposure time of the following spectrum. In most cases the number of scans is chosen in such a way that the total ex-posure time is between 30 s and 60 s. At sunrise and sunset the total exposure time is increased to a maximum of 300 s or 900 s. During daylight hours exposure times of 3 s are
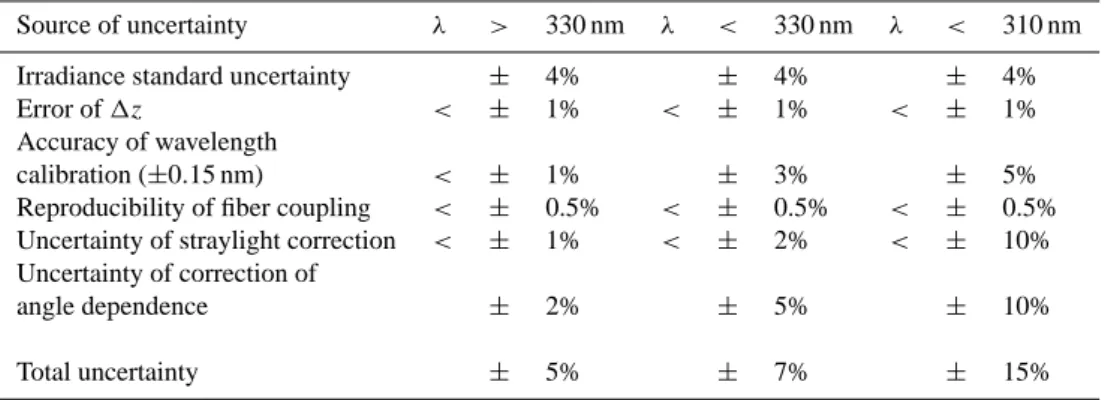
Table 1. Maximum Errors of the measured actinic fluxes
Source of uncertainty λ > 330 nm λ < 330 nm λ < 310 nm
Irradiance standard uncertainty ± 4% ± 4% ± 4%
Error of 1z < ± 1% < ± 1% < ± 1%
Accuracy of wavelength
calibration (±0.15 nm) < ± 1% ± 3% ± 5%
Reproducibility of fiber coupling < ± 0.5% < ± 0.5% < ± 0.5% Uncertainty of straylight correction < ± 1% < ± 2% < ± 10% Uncertainty of correction of
angle dependence ± 2% ± 5% ± 10%
Total uncertainty ± 5% ± 7% ± 15%
possible for θ0<45◦, based on just one scan. However,
sev-eral scans are usually combined to give a better signal-to-noise-ratio.
The electronic offset and dark current were determined by leaving the shutter closed for a range of exposure times. The offset was nearly the same in every pixel, with an average value of 1246± 4 counts per pixel. The additional dark cur-rent originating from thermal exitation was determined to be 0.09±0.002 counts s−1.
2.4.1 Spectrometer stray-light
This section describes the analysis done to characterize the spectrometer stray-light, which has to be corrected for espe-cially in the UV wavelength range because of the small inten-sities involved. If we imagine the stray-light to be distributed homogeneously over the CCD-chip then stray-light should be a constant value for every pixel depending only on the in-coming light intensity. Unfortunately, this was not the case. In the area of the image of each collector two different contri-butions of stray light are observed, first, stray light from the collector itself; second, from the other two collectors. From measurements with different edge filters and connected sin-gle collectors we found that rows 94 and 190 between the images of the collectors describe the existing stray-light dis-tribution reasonably well (Eckstein, 2001).
The stray light was accounted for in the following way. The stray-light spectrum was scaled in the wavelength range 270–290 nm to the average value of the spectrum of the lector in the same range, and then substracted. For the col-lector which was connected on the top (SRM-1) row 94 was used as the stray-light spectrum, for the collector connected in the middle (SRM-2) the average of row 94 and 190 was used, and for the collector connected on the bottom (SRM-3) row 190 was used as stray-light spectrum. This correc-tion lead to an overestimacorrec-tion of the straylight in the wave-length range λ>700 nm, but this range was not used in fur-ther data processing. The proportion of stray light in the to-tal signal is less than 1% in the wavelength range λ>330 nm,
but increases strongly for wavelengths λ<330 nm. The stray-light correction is therefore very sensitive in this region. The stray-light correction described gives uncertainties in the ac-tinic flux values as specified in Table 1. The stray-light uncer-tainty and, as a consequence the unceruncer-tainty in the correction of the angle dependence of the collector are the largest error sources for wavelengths λ<310 nm.
2.5 Calibration
2.5.1 Wavelength calibration
For wavelength calibration two different low-pressure halo-gen lamps were used. For the wavelength range λ<550 nm spectra of a Hg-lamp and for the range λ>550 nm spectra of an Ar-lamp (Type ‘Pen Ray, LOT) were measured. Eight emission lines (Hg-lines: 296.73, 302.15, 312.57, 365.02, 404.66, 435.84, 546,07 nm; Ar-line: 696.54 nm) were as-signed to their measured peak position. The pairs of points determined in this way were fitted to a third-order poly-nomial function for the total measured wavelength range. The distances of the pixels arising from this procedure were nearly equidistant in the range between 0.47 and 0.49 nm. For constant and stable temperature conditions the repro-ducibility of the emission-lines was ±0.03 nm. Wavelength shifts arose due to temperature fluctuations during field mea-surements. However, these could be corrected by correlat-ing the Fraunhofer structure of the spectra to a reference so-lar spectrum measured at the same time as the wavelength calibration was performed. The resulting uncertainty in the wavelength assignment, determined from several wavelength calibration measurements during one year, was ±0.15 nm. Comparison of the positions of the measured Fraunhofer lines with a high resolution extraterrestrial solar spectrum of Van Hoosier (ftp://susim.nrl.navy.mil/pub/atlas3), convo-luted with our instrumental response function, showed very good agreement, with a deviation of less than ±0.1 nm.
2.5.2 Actinic flux calibration
The concept of the actinic flux calibration is similar to the method presented by Hofzumahaus et al. (1999) and is thefore discussed here only in brief. In theory the spectral re-sponse function D(λ, θ, φ) should be determined for every steradian element d= sin θ dθ dφ. In the atmosphere, the relation between the measured signal I (λ) and the collected radiation is given by
dI (λ) = D(λ, θ, φ) · L(λ, θ, φ) d (3)
=D0(λ) · Zp(λ, θ, φ) · L(λ, θ, φ) d. (4)
D0(λ)is the response function for θ =0◦and Zp(λ, θ, φ)
describes the relative sensitivity of the collector with respect to the direction θ =φ=0◦, for which Z
p=1. In Sect. 2.1 we
described the dependence of Zpon wavelength and polar
an-gle θ . During field measurements the collector integrates the radiation over all angles of incidence, so that
I = D0(λ)
Z
4π sr
Zp(λ, θ ) L(λ, θ, φ) d. (5)
The correction function ZH(λ, θ0)is introduced in the
fol-lowing way: I (λ) = D0(λ) ZH(λ, θ0) F (λ,4π sr), (6) ZH(λ, θ0) = 1 F (λ,4π sr) Z 4π sr Zp(λ, θ ) L(λ, θ, φ) d (7)
Using Eqs. (13)–(16) of Hofzumahaus et al. (1999) and the proportions of the direct F0, the downward F ↓ and the
upward F ↑ diffuse flux to the total actinic flux F (4π sr),
α = F0 F0+F ↓ +F ↑ = F0 F (4π sr), (8) β = F ↑ F0+F ↓ +F ↑ = F ↑ F (4π sr), (9) γ = F ↓ F0+F ↓ +F ↑ = F ↓ F (4π sr) (10) we obtain ZH =αZp+ γ 2π Z U H Zpd + β 2π Z LH Zpd (11)
where UH means upper hemisphere and LH means lower hemisphere. ZH, Zp, α, β and γ are all dependent on λ
and θ0. α, β and γ were determined from model
simula-tion using a δ-4-stream method (Fr¨uh et al., 2000). A stan-dard ozone profile of midlatitude summer (McClatchey et al., 1971) was used in the calculations, which was scaled in each vertical layer to yield an ozone column of 300 DU in total. The albedo was determined from measurements at a height of 100 m on the Charit´e building in Berlin, and was found to be
between about 1% at 300 nm up to 18% at 660 nm. Aerosol effects were neglected. Model simulations were carried out for solar zenith angles in the range 0–80◦in steps of 5◦. With
these assumptions ZH(λ)was calculated in steps of δθ0=5◦,
which was then used for the following parameterisation:
ZH(λ, θ0) =
n=5
X
n=0
An(λ) · θ0n. (12)
The assumption of isotropic diffuse sky radiation lead to deviations in ZH of less than ±2% when compared with a
nonisotropic distribution of radiation (Hofzumahaus et al., 1999). For θ0>90◦and total cloud cover α is zero. In these
cases ZH is independent of θ0, and the resulting error in ZH
is smaller than ±3%.
Knowing the correction function ZHthe actinic flux is
de-termined from the measured signal I (λ) from
F (λ) = I (λ)
ZH(λ, θ0) · D0(λ)
. (13)
It follows, therefore, that an absolute calibration is still re-quired, namely the system response function D0(λ)at θ =0◦.
Because of the equivalence of the actinic flux and the irradi-ance at θ =0◦, D0can be determined with an irradiance
stan-dard. However, the problem arises of deciding what distance to choose between the collector and the standard, since the collector is not a plane but rather a sphere, without a unique basing point. Considering different planes of the collector perpendicular to the optical axis (sphere-standard), the sur-face elements have differing distances to the standard and therefore receive different irradiance intensities. A virtual plane must therefore be found, which can be used to adjust the distance to the irradiance standard. After Hofzumahaus et al. (1999) we make use of the fact that the irradiance is proportional to the inverse square of the distance. Therefore, measurements were carried out in a dark laboratory at vary-ing distances from the top of the collector to a quartz halo-gen lamp. The resulting intensities I−1/2were proportional to the distance in the range 10–90 cm for all wavelength as expected. The x-value at which the extrapolated linear fit curves of I−1/2, plottet against the distance, intersect the
x-axis, is the distance |1z| of the virtual plane which behaves like a plane irradiance receiver optic. For our collectors the mean values for |1z| were 32±2 mm (SRM-1), 30±2 mm (SRM-2) and 30±3 mm (SRM-3).
The absolute calibration was carried out in a labora-tory of the Institute of Atmospheric Chemistry of the Forschungszentrum J¨ulich (Germany). There a calibrated 1000 W irradiance standard (Fa. Gigahertz Optik) was op-erated at a constant current, as specified in the lamp certifi-cate. The fluctuations of the current were within ±15 ppm of the certified value (for details see Hofzumahaus et al., 1999). The distance between the virtual plane of our detector and the lamp was 700 mm, as prescribed by the lamp certificate.
The observed response function, D0, of one of the collectors
is shown in Fig. 4.
Because of decreasing transmission of the fiber and the collector, D(λ, θ0) also decreases for λ<400 nm with
smaller wavelength. The response functions of the other collectors were found to be similar. However because of transmission inefficiencies the response function becomes smaller with increasing length of the fiber.
3 Uncertainties
The sources of uncertainty in the actinic flux measurements are listed in Table 1. The two largest error terms are the uncertainty of the irradiance standard and the spectrometer stray-light correction. From a comparison of various irradi-ance standards Hofzumahaus et al. (1999) estimated an un-certainty of ±4%. The spectrometer stray-light correction error has a strong spectral dependence, and it is relatively greatest at short wavelengths, where signal intensity is low-est. The uncertainty of stray-light correction can reach up to 10% for λ<305 nm for midday values on clear-sky days. For wavelengths λ<300 nm the signal intensity diminishes, so that the signal-to-noise ratio becomes unity and the detec-tion limit of the instrument is reached. With increasing solar zenith angle the detection limit shifts to longer wavelength, which can be seen in Fig. 5. The error in 1z, the position of the virtual plane which is used for calibration, is ±5 mm, which leads to an uncertainty in the actinic flux of less than 1%, when measuring at a distance of 700 mm to the irradi-ance standard. The error of the wavelength calibration has a strong spectral dependence in the actinic flux. This effect was investigated by shifting a spectrum for 0.15 nm and then calculating the ratio with the original spectrum. This proce-dure was carried out for several spectra and then the standard deviation was determined. In the range of the UV-B cutoff the error of 0.15 nm leads to an uncertainty in the actinic flux of 3% to 5%. For λ>330 nm, on the other hand, the averaged uncertainty is only about 1%. The uncertainty in the correc-tion of the angle dependence owing to the idealised assump-tions was estimated to ± 2% for wavelengths λ>330 nm ac-cording to Hofzumahaus et al. (1999). For decreasing wave-length the uncertainty in this correction increases because of the rising error in the spectrometer stray-light correction. For cloudy conditions, when no direct light reaches the collector, the uncertainty in the correction of the angle dependence can reach 3% for λ>330 nm. The long quartz fibers of the col-lectors are connected with short fibers which are installed at the slit of the spectrograph. The uncertainty in the ac-tinic flux after disconnection and reconnection of the fibers, was determined to be less than 0.5%. The errors listed in ta-ble 1 yield a total uncertainty of 5% for λ> 330 nm, 7% for 310 nm<λ<330 nm and 15% for λ<310 nm. The error is not constant within the given wavelength limits, but rather con-tinuously increases from 330 nm to lower wavelengths; the
250 300 350 400 450 500 550 600 650 700 0 1 2 3 4 5 6 7 8 9 10 11 12 E ( λ ) I (λ) / 103 counts I ( λ ) resp. D ( λ ) Wavelength / nm 0 5 10 15 20 25 E (λ) / 1012 cm-2 nm-1 s-1 D (λ) / 10-10 counts cm2 nm s
Fig. 4. Comparison of the irradiance E(λ) produced by the 1000
W-standard in a distance of 700 mm, the signal intensity I (λ) and the spectral response function D(λ, θ0)of one collector (SRM-3).
given uncertainties should be taken as average errors in the given spectral ranges.
The uncertainties in the photolysis frequencies, calculated with the measured actinic flux spectra are estimated to ±5% for processes which take place at wavelength λ>330 nm, as for example J (NO2). Because of the integration over a larger
wavelength region for calculating photolysis frequencies the uncertainty for processes which occur in the spectral range <330 nm is estimated to be ±10%. Of course the absorp-tion coefficients and quantum yields which are used to cal-culate the photolysis frequency also have associated errors, which contribute to the total error of the photolysis frequen-cies. Hofzumahaus et al. (1999) estimated the uncertainty of the quantum yields to be about ±10%, whereas the accuracy of the absorption coefficients may be as high as 3% in some cases.
4 Results for clear-sky conditions and comparison with the J ¨ulich instrument
4.1 Spectral actinic flux
To check the accuracy of the SRM, comparison measure-ments with the spectroradiometer of the Institute of Atmo-spheric Chemistry of the Forschungszentrum J¨ulich (SRJ, Hofzumahaus et al., 1999) were carried out on the roof of the Institute in J¨ulich (Germany; 51.00◦N, 6.50◦E) during
November 1998 and May 1999. The SRJ is a scanning spec-troradiometer for the wavelength range 280–420 nm which uses a double monochromator. It measures the actinic flux of the upper hemisphere (2π sr). For measuring just a 2π field of view, like the SRJ, we placed a black plane just beyond the collectors of the SRM. Typical clear sky spectra mea-sured with one collector of our instrument (SRM-2) and with the SRJ on 27 May 1999, are shown for two solar zenith
300 320 340 360 380 400 420 0.8 0.9 1.0 1.1 1.2 1.3 θ 0 = 29.6° θ0 = 59.7°
SRJ / SRM
-2
Wavelength / nm
300 350 400 450 500 550 600 650 1E11 1E12 1E13 1E14 1E15 θ0 = 29.6° θ0 = 59.7° SRJ SRM-2F(
λ) / cm
-2nm
-1s
-1Wavelength / nm
Fig. 5. Upper panel: Spectral actinic flux measured with one of the three collectors of the SRM (SRM-2) and with the actinic flux
spectro-radiometer of the Institute of Atmospheric Chemistry of the Forschungszentrum J¨ulich (SRJ) simultaneously on 27 May 1999 on the roof of the Institute in J¨ulich at two different solar zenith angles. Lower panel: Ratios of the shown spectra of the SRJ and the SRM-2. The upper wavelength limit is restricted to 420 nm because of the range of measurement of the SRJ.
angles in Fig. 5. The spectra show clearly the shift of the sharp cutoff in the UV-B range to higher wavelengths with increasing solar zenith angle. The two instruments show good agreement. For actinic flux values lower than about 1011photons cm−2s−1nm−1the signal of the SRM is equal to the noise, so this value represents the instrument’s detec-tion limit. The ratios of the spectra shown in Fig. 5 (upper panel) are illustrated in Fig. 5 (lower panel). The ratios gen-erally vary in the range of ±10% around unity, which is in the range of the uncertainty of the two instruments. The only exception is in the wavelength range 390–400 nm, where the strong solar Ca Fraunhofer lines were measured at different resolutions by the two instruments, yield larger deviations.
To demonstrate the good agreement of the three collectors with each other ratios of spectra measured on 3 November 1998 are illustrated in Fig. 6. For wavelengths λ>330 nm the ratios are in the range of 1.00±0.05, except for SRM-1 / SRM-2, which is in the range of SRM-1.00±0.08. Low inten-sities yield increasing uncertainties in the wavelength range λ<330 nm which lead to increasing deviations from 1.00 of the spectral ratios. However, the solar zenith angles shown here are rather large. At smaller solar zenith angles the UV-B
cutoff shifts to smaller wavelengths and therefore the devia-tions of the spectra also start to increase at smaller wave-lengths.
Large discrepancies also appear at about λ=393 nm and λ=397 nm in the ratios SRM-1/SRM-2 and SRM-2/SRM-3, in the range of the strong solar Ca Fraunhofer lines. These deviations clearly do not occur in the ratio SRM-1/SRM-3. The reason is that the resolutions of SRM-1 and SRM-3 are quite similar, whereas the resolution of SRM-2 is higher. This difference is caused by the imaging properties of the spectrograph, which are best in the middle of the grating. 4.2 Photolysis frequencies
Using literature data for the molecular absorption coefficient and the quantum yield for a given photolysis reaction, the photolysis frequency can be determined from the measured spectra of actinic flux from Eq. (2). For example the photol-ysis frequencies of ozone
350 400 450 500 550 600 650 0.75 0.80 0.85 0.90 0.95 1.00 1.05 1.10 1.15 1.20 SRM -2 / SRM -3 Wavelength λ / nm 0.80 0.85 0.90 0.95 1.00 1.05 1.10 1.15 1.20 SRM -1 / SRM -3 0.80 0.85 0.90 0.95 1.00 1.05 1.10 1.15 1.20 1.25 θ0 = 66.03 θ0 = 79.52 SRM -1 / SRM -2
Fig. 6. Ratios of spectra of the three collectors SRM-1, SRM-2, SRM-3 measured on 3 November 1998 at two different solar zenith angles.
00 03 06 09 12 15 18 21 0.0 0.5 1.0 1.5 2.0 SRJ SRM-2 J( O ( 1 D )) / 1 0 -5 s -1 UT 00 03 06 09 12 15 18 21 0 1 2 3 4 5 6 7 8 SRJ SRM-2 J( N O2 ) / 1 0 -3 s -1 UT
Fig. 7. Diurnal profiles of the photolysis frequencies J (O(1D)) and J (NO2)measured with one collector of the SRM (SRM-2) and the SRJ on 27 May 1999 on the roof of the Institute of Atmospheric Chemistry (ICG3) (J¨ulich, Germany).
and nitrogen dioxide
NO2+hν →NO + O (J (NO2)) (15)
are shown in Fig. 7, as measured on 27 May 1999 on the roof of the Institute of Atmospheric Chemistry (ICG3) (J¨ulich, Germany) with the SRM-2 and the SRJ. They were calcu-lated with literature data of DeMore et al. (1997) (σ ) and Talukdar et al. (1998) (8) for J (O(1D)) and Merienne et al. (1995) (σ ) and DeMore et al. (1997) (8) for J (NO2).
Figure 7 shows that the diurnal profiles of J (O(1D)) and J (NO2) differ in width, because of the different
spec-tral ranges which contribute to the two photolysis
frequen-cies. The photolysis of NO2 takes place in the range
300 nm<λ< 420 nm, with the main contribution coming from the wavelength region 350<λ<420 nm. Photoly-sis O3 to O(1D), on the other hand, occurs in the range
295<λ<330 nm.
The diurnal profiles of the two instruments show good agreement for both photolysis frequencies. To quantify the level of agreement of the SRM and SRJ the photolysis fre-quencies J (O(1D)) and J (NO2) measured in the period 21
May 1999 to 28 May 1999 are shown in a correlation plot (Fig. 8), where SRJ is plotted on the abscissa. Also shown in Fig. 8 are linear best-fit lines forced through the origin.
0 1 2 3 4 5 6 7 8 9 0 1 2 3 4 5 6 7 8 9 J(N O2 ) (SR M -2 ) / 1 0 -3 s -1 J(NO2) (SRJ) / 10-3 s -1 0.0 0.5 1.0 1.5 2.0 0.0 0.5 1.0 1.5 2.0 J(O( 1 D )) (SR M -2 ) / 1 0 -5 s -1 J(O(1D)) (SRJ) / 10-5 s -1
Fig. 8. Correlation plot of J (O(1D)) and J (NO2) of the SRM (SRM-2) against SRJ for all measured data in the period 21 May 1999–28 May 1999.
The two instruments show a very good linear correlation with correlation coefficients of 0.999 for J (O(1D)) and 0.998 for J(NO2), although values taken during cloudy conditions are
included. The slope of the linear fit is a measure of the de-viation of the two instruments. Therefore, the values of the slope of 0.949 for J (O(1D)) and 0.964 for J (NO2) show a
very good agreement of the two instruments in the range of their uncertainties.
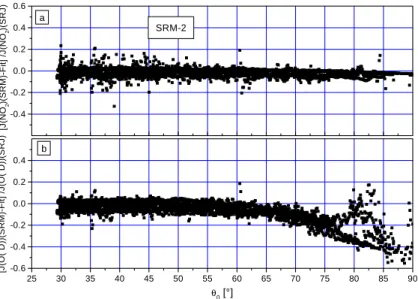
Figure 9 shows the normalized relative departure of the correlations shown in Fig. 8 as a function of solar zenith angle. For J (NO2) we get small scatter around zero with
a small standard deviation of ±0.038 for the whole range of zenith angles. The relative departure of J (O(1D)) shows small scatter around zero up to solar zenith angles of about 70◦. For larger solar zenith angles there seems to be a sys-tematic deviation to negative values. The detection limit of the SRM is reached at higher wavelength than the detection limit of the SRJ. Therefore, for large solar zenith angles the very small wavelength in the range between 295 and 310 nm do not contribute to J (O(1D)) of the SRM, but contribute to J(O(1D)) of the SRJ, leading to smaller values of J (O(1D)) for the SRM compared to the SRJ. However, the standard deviation of the relative departure of J (O(1D)) is 0.074 in the solar zenith angle range of 28–80◦, which shows a very good agreement of the two instruments for the photolysis fre-quency J (O(1D)), and well within their uncertainty range.
5 Results for broken clouds, BERLIOZ
During the field campaign BERLIOZ (BERLin OZone ex-periment) from 12 July to 10 August 1998, we investigated the effects of broken cloud conditions on the actinic flux at ground level. The SRM was installed on the roof of the Charit´e building in the city of Berlin (Germany; 52.53◦N, 13.38◦E). Figure 10 shows diurnal profiles of the photo-lysis frequencies J (O(1D)) and J (NO2) measured on 9
Au-gust 1998. An interesting point is the different effect of clouds, which were present in the morning between 05:00 and 09:00 UT, for the two photolysis processes. The re-duction and enhancement of photolysis is much more pro-nounced in J (NO2) than in J (O(1D)) during that time,
indi-cating a wavelength-dependent effect of broken clouds. Sim-ilar observations were noted by Junkermann et al. (1989). Wavelength-dependent effects of clouds on the irradiance were also described by Frederick and Erlick (1997) and Kylling et al. (1997).
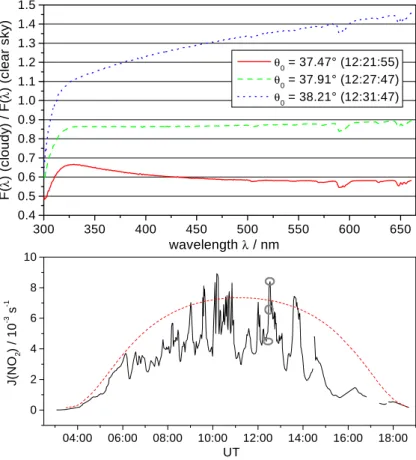
To investigate if the effects of clouds, especially bro-ken clouds, are wavelength-dependent we compared spectra measured during partial cloud cover with clear-sky spectra. Clear-sky spectra were not taken from one single day, but were averaged for different aerosol conditions; all clear-sky spectra measured during BERLIOZ for a given solar zenith angle in the range of ±0.25◦were averaged. Exemplary, the ratios of three spectra measured during partial cloud con-ditions on 3 August 1998 with the corresponding clear-sky spectra are shown in Fig. 11. The times of measurement are marked in the photolysis frequency J (NO2) in the lower
panel (full line). The dashed line in the lower panel shows a parameterization of J (NO2) for clear sky conditions. One
spectrum is taken from a local minimum of J (NO2), that is
in the shadow of a cloud; the second spectrum is at a point where J (NO2) is very close to the clear-sky value; and in
the third spectrum J (NO2) is enhanced compared to
clear-sky conditions, that is, in a cloud gap, where direct radiation reaches the instrument. The ratios of the cloudy spectra to the clear-sky spectra of the minimum and the enhancement cases show a significant wavelength dependence. In both cases the cloud effect increases with increasing wavelength. However, the wavelength dependence of the enhancement of actinic flux in the cloud gap is more pronounced than that measured for the reduction in the shadow of the cloud. A very small wavelength dependence appears in the ratio of the spectrum close to the clear-sky case.
25 30 35 40 45 50 55 60 65 70 75 80 85 90 -0.6 -0.4 -0.2 0.0 0.2 0.4 b [J (O ( 1D ))(S R M )-F it ] / J (O ( 1D ))(S R J ) θ0 [°] -0.4 -0.2 0.0 0.2 0.4 0.6 a SRM-2 [J (N O2 )(S R M )-F it ] / J (N O2 )(S R J )
Fig. 9. Relative deviation of the data of (a) J (NO2) and (b) J (O(1D)) measured with the SRM (SRM-2) from the linear best-fit lines shown in Fig. 8 as a function of solar zenith angle.
Wavelength-dependent effects of broken clouds on the ac-tinic flux of the same order as shown in this chapter are also found in two-dimensional model simulations with partial cloud cover (Eckstein, 2001). Frederick and Erlick (1997) also observed an increasing reduction of the transmission of irradiance through clouds with increasing wavelength.
The strong decline in the ratios shown in Fig. 11 with decreasing wavelength (λ<320 nm) occurs for two reasons. First, the cloudy and the clear sky spectra are measured at different ozone column values. Second, the multiple scat-tering in and between the clouds leads to an increase in the light path of up to a factor of 10 (Erle et al., 1995), leading to much stronger absorption by ozone.
In searching for the reasons for the wavelength depen-dence of the effects of partial clouds, consideration of the ra-tios of the direct and the diffuse part of the actinic flux is im-portant. The main effect of clouds is the conversion of direct radiation to diffuse radiation due to scattering. In the case of broken clouds, direct radiation, which is scattered at the edge of one cloud, reaches the neighboring cloud and is scattered again, which leads to a tunneling effect between the clouds, increasing the diffuse radiation below the clouds. At a point on the ground where the direct radiation arrives through a cloud gap, additional diffuse radiation is observed compared to the clear sky case, resulting in a higher actinic flux. With increasing wavelength the diffuse part of the actinic flux de-creases while the direct radiation inde-creases. Therefore, at longer wavelengths relatively more direct radiation is con-verted to diffuse radiation below the cloud, leading to the observed wavelength dependence for the enhancement. The same effect leads to the wavelength dependence in the re-duced spectra in the shadow of a cloud. Here no direct radi-ation reaches the ground, because it is scattered at the cloud edge. 02 04 06 08 10 12 14 16 18 20 0 1 2 3 4 5 6 7 J(NO2) J( NO 2 ) / 1 0 -3 s -1 UT 0.0 0.5 1.0 1.5 2.0 J(O(1 D)) J( O( 1 D )) / 1 0 -3 s -1
Fig. 10. Photolysis frequencies J (O(1D)) and J (NO2) mea-sured with the SRM on 9 August 1998 during the field campaign BERLIOZ in Berlin on the roof of the Charit´e building. Partial cloud cover in the time from 05:00 to 09:00 UT leads to reductions and enhancements in the photolysis frequencies, whereas the effect is more pronounced in J (NO2).
6 Actinic flux in clouds, experiment on a tower
The novel feature of the new spectroradiometer represented here, namely to be able to measure at three points simultane-ously, was used to analyze the actinic flux within clouds. The instrument was deployed on a tower (height 107 m) located on a hill in the Hunsr¨uck region (Germany). The spectrora-diometer itself was located in a room in the tower at a height of 60 m. One collector, with a 65 m fiber, was positioned on top of the tower (107 m), the second, with a 22 m fiber, on a platform in the middle of the tower (68 m) and the third, with a 70 m fiber, 4 m above the ground at the bottom of the
300 350 400 450 500 550 600 650 0.4 0.5 0.6 0.7 0.8 0.9 1.0 1.1 1.2 1.3 1.4 1.5 θ0 = 37.47° (12:21:55) θ0 = 37.91° (12:27:47) θ0 = 38.21° (12:31:47) F( λ ) (c loudy ) / F( λ ) (c lear s k y ) wavelength λ / nm 04:00 06:00 08:00 10:00 12:00 14:00 16:00 18:00 0 2 4 6 8 10 J( NO 2 ) / 1 0 -3 s -1 UT
Fig. 11. Deviation of spectra measured during partial cloud cover in relation to clear-sky spectra. The times of the chosen spectra are marked
in the photolysis frequency J (NO2) in the lower panel. The dashed line in the lower panel is the parameterized clear sky J (NO2). In the upper panel, the dotted line corresponds to a point at a local maximum above the clear sky value, the dashed line corresponds to a point near the clear-sky case and the full line corresponds to a local minimum value.
tower. Results are presented for a day where the tower was totally enclosed in clouds that extended to the ground, and thick cloud layers were above the tower. Two wavelength intervals were selected for integration, one interval at short wavelengths and a second interval at longer wavelengths, to check for wavelength dependences. The first interval chosen covered the wavelength range 320–340 nm in order to ex-clude the UV-B, which has a strong dependence on the ozone column, thus complicating the cloud effects. The second in-terval was 605–625 nm, which is free of strong absorption lines. The attenuation Qextin the cloud between the
collec-tors is calculated from Qext(t − x) = 1 −
Fx
Ft
(16) where Ftis the actinic flux at the top of the tower and Fx
rep-resents the actinic flux at 68 m (Fm) or at the bottom of the
tower (Fb). Qext(t−m) and Qext(t−b) denote the
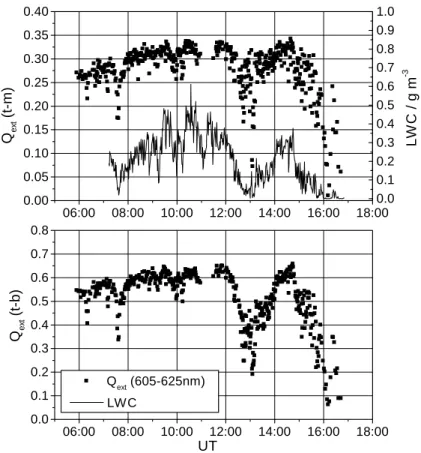
attenua-tion between the top and the middle and between the top and the bottom of the tower, respectively. The diurnal variation in both quantities is shown in Fig. 12 for the wavelength integral 605–625 nm, as measured on 14 March 2000. The extinction
of the short wavelength interval is omitted as it shows closely similar features. The attenuation Qextshows a variation
dur-ing the day which is more pronounced in Qext(t−b) than in
Qext(t−m).
This difference is caused by varying cloud optical thick-ness, and such fluctuations are larger between the ground and the middle than between the middle and the top of the tower. In addition to the actinic flux spectroradiometer a Fast Scattering Spectrometer Probe (FSSP) was deployed on the middle platform (68 m) to measure the particle size distri-bution and the liquid water content of the cloud. Normally the FSSP is an airborne instrument, where the air flowing through a tube is measured. In this experiment a fan was used to suck the air through the measurement tube, reach-ing air velocities of 50 m s−1. In the upper panel of Fig. 12
the measured liquid water content of the clouds is also dis-played. Remarkably, the attenuation Qextfor both distances
shows a strong positive correlation with the liquid water con-tent, a relation often used for modelling radiative effects of clouds. Qext(t−m) varies between 0.15 and 0.34, yielding
an attenuation per meter of 0.37 to 0.83% m−1; Qext(t−b)
06:00 08:00 10:00 12:00 14:00 16:00 18:00 0.00 0.05 0.10 0.15 0.20 0.25 0.30 0.35 0.40 Qex t (t-m ) 06:00 08:00 10:00 12:00 14:00 16:00 18:00 0.0 0.1 0.2 0.3 0.4 0.5 0.6 0.7 0.8 Qext (605-625nm) Qex t (t-b) UT 0.0 0.1 0.2 0.3 0.4 0.5 0.6 0.7 0.8 0.9 1.0 LW C / g m -3 LWC
Fig. 12. Attenuation of the actinic flux in the cloud. Qext(t−m) is the reduction of the actinic flux from the top to the middle of tower (39 m) calculated from Qext(t−m)=1−FFm
t ; Qext(t−b) is the analogous reduction between the top and the bottom of the tower. The solid line in the
upper panel is the liquid water content (LWC) of the cloud measured at a height of 68 m.
of 0.18 to 0.64% m−1. These results imply that the actinic flux attenuation per meter was smaller lower down the tower, which would be expected, since the liquid water content, as well as the particle size in a cloud, increases with increasing height.
7 Conclusions
A new actinic flux spectroradiometer has been developed, suitable for measurement of most atmospheric photolysis fre-quencies during field campaigns. The option of measuring spectra from three collectors simultaneously offers the ca-pability to measure simultaneously at three different heights and study, for example the actinic flux in and above clouds.
The instrument is suitable for studying actinic flux, un-der different cloud conditions, owing to fast and simultane-ous measurement of spectra by using a fixed grating imaging spectrograph. The accuracy of the new instrument (±5% for λ>330 nm) is comparable with existing actinic flux spectro-radiometers (Hofzumahaus et al., 1999; Shetter and M¨uller, 1999). At shorter wavelengths the uncertainty is greater, mainly because of the higher spectrometer stray-light
contri-bution to the signal. However, in comparison measurements the SRM showed a very good agreement, in spectra as well as in photolysis frequencies, with the actinic flux spectrora-diometer of the Institute of Atmospheric Chemistry of the Forschungszentrum J¨ulich, which already showed good re-sults in international comparisons.
The advantages of the SRM compared to the other instru-ments are two-fold. First, the wavelength range 300–660 nm is large, so that nearly every photolysis frequency relevant for atmospheric chemistry can be calculated. Second, in contrast to the existing scanning double monochromator instruments the SRM is fast enough for measuring fast changing partial cloud covering.
The wavelength range of the SRM can be enlarged up to 750 nm, using a suitable filter which reduces just the red light. Furthermore the total blocking of the infra-red radi-ation could reduce the spectrometer stray-light and therefore improve the accuracy in the UV-B range.
The new 4π -spectroradiometer measured continuously spectra during the field campaign BERLIOZ. With these ac-tinic flux spectra a large range of photolysis frequencies was calculated, whereas measurements of J (NO2) and J (O(1D))
conditions with spectra from δ-4-stream radiative transfer simulations showed very good agreement, with deviations of the calculated spectra from the measurements in the range ±10% (Fr¨uh et al., 2001; Junkermann et al., 2002). The wavelength dependent effects of scattered clouds were also studied. Enhancement of the actinic flux in the cloud gaps was observed, where direct radiation reached the ground, and reduction in actinic flux was observed in the shadow of the clouds. Both effects showed a spectral dependence and were more pronounced with increasing wavelength. A second project comprised measurements made on a tower located on a hill in the Hunsr¨uck region (Germany). The three collectors were deployed in three different heights on the tower to analyze the actinic flux in and above the clouds. The attenuation of the actinic flux in the cloud was correlated with the liquid water content of the cloud. The actinic flux attenuation in the cloud was in the range 0.18–0.83% m−1,
depending on the optical thickness of the cloud. As expected, a sizeable spectral dependence of the attenuation in the cloud was not observed.
For future measurements the instrument will be modified to reduce the uncertainty in the UV-B range. A new spectro-radiometer operating on the same principle for airborne mea-surements will be developed at the Institut for Tropospheric Research in Leipzig (Germany).
Acknowledgements. This research was supported by the German
Federal Ministry for Education, Science, Research and Technology (BMBF), grant TFS-LT3-B.1. We wish to thank A. Hofzumahaus, A. Kraus and B. Bohn for providing the data of the SRJ, and for the possibility and help to carry out the measurement comparisons.
References
Bahe, F., Marx, W., Schurath, U., and R¨oth, E.: Determi-nation of the absolute photolysis rate of ozone by sunlight, O3+hν→O(1D)+O2(11g), at ground level, Atmos. Env., 13, 1515–1522, 1979.
Barai, S. and Stedman, D.: Actinometric measurement of J[O3→O(1D)] using a luminol detector, Geophys. Res. Lett., 19, 2047–2050, 1992.
Brauers, T. and Hofzumahaus, A.: Latitudinal variation of mea-sured NO2 photolysis frequencies over the atlantic ocean be-tween 50◦N and 30◦S, J. Atmos. Chem., 15, 269–282, 1992. Crawford, J., Davis, D., Chen, G., Shetter, R., M¨uller, M., Barrick,
J., and Olson, J.: An assessment of cloud effects on photoly-sis rate coefficients: Comparison of experimental and theoretical values, J. Geophys. Res., 104, 5725–5734, 1999.
DeMore, W., Sander, S., Golden, D., Hampson, R., Kurylo, M., Howard, C., Ravishankara, A., Kolb, C., and Molina, M.: Chem-ical kinetics and photochemChem-ical data for use in stratospheric mod-eling, evaluation number 12, JPL Publication 97-4, California In-stitute of Technology, Jet Propulsion Laboratory, Pasadena, Cal-ifornia, 1997.
Dickerson, R., Stedman, D., and Delany, A.: Direct measurement of ozone and nitrogen dioxide photolysis rates in the troposphere, J. Geophys. Res., 87, 4933–4946, 1982.
Eckstein, E.: Entwicklung eines Spektralradiometers zur Bes-timmung von aktinischer Strahlung und Photolysefrequenzen in bew¨olkter Atmosph¨are, Ph.D. thesis, Johannes Gutenberg-Universit¨at Mainz, http://ArchiMeD.uni-mainz.de/pub/2002/ 0056, 2001.
Erle, F., Pfeilsticker, K., and Platt, U.: On the influence of tropo-spheric clouds on zenith-scattered-light measurement of strato-spheric species, Geophys. Res. Lett., 22, 2725–2728, 1995. Frederick, J. and Erlick, C.: The attenuation of sunlight by
high-latitude clouds: Spectral dependence and its physical mecha-nisms, J. Atmos. Sci., 54, 2813–2819, 1997.
Fr¨uh, B., Trautmann, T., Wendisch, M., and Keil, A.: Comparison of observed and simulated NO2photodissociation frequencies in a cloudless atmosphere and in continental boundary layer clouds, J. Geophys. Res., 105, 9843–9857, 2000.
Fr¨uh, B., Eckstein, E., Trautmann, T., Wendisch, M., Fiebig, M., and Feister, U.: Ground-based measured and calculated spectra of actinic flux density and downward UV irradiance in cloudless conditions and their sensitivity to aerosol microphysical proper-ties, J. Geophys. Res., 108, D16, 4509, 2003.
Harrison, L., Beauharnois, M., Berndt, J., and Kiedron, P.: The ro-tating shadowband spectroradiometer (rss) at sgp, Geophys. Res. Lett., 26, 1715–1718, 1999.
Heismann, B.: Eine CCD-Kamera zur Messung atmosph¨arischer Spurenstoffe, Ph.D. thesis, Ruprecht-Karls-Universit¨at Heidel-berg, 1996.
Hofzumahaus, A., Kraus, A., and M¨uller, M.: Solar actinic flux spectroradiometry: A technique for measuring photolysis fre-quency in the atmosphere, Appl. Opt., 21, 4443–4460, 1999. Junkermann, W., Platt, U., and Volz-Thomas, A.: A photoelectric
detector for the measurement of photolysis frequencies of ozone and other atmospheric molecules, J. Atmos. Chem., 8, 203–227, 1989.
Junkermann, W., Br¨uhl, C., Perner, D., Eckstein, E., Trautmann, T., Fr¨uh, B., Dlugi, R., Gori, T., Ruggaber, A., Reuder, J., Zel-ger, M., Hofzumahaus, A., Kraus, A., Rohrer, F., Br¨uning, D., Moortgat, G., Horowitz, A., and Tadic, J.: Actinic radiation and photolysis processes in the lower troposphere: Effect of clouds and aerosols, J. Atmos. Chem., 42, 413–441, 2002.
Kelley, P., Dickerson, R., Luke, W., and Kok, G.: Rate of NO2 photolysis from the surface to 7.6 km altitude in clear-sky and clouds, Geophys. Res. Lett., 22, 2621–2624, 1995.
Kylling, A., Abold, A., and Seckmeyer, G.: Transmittance of a cloud is wavelength-dependent in the UV-range: Physical inter-pretation, Geophys. Res. Lett., 24, 397–400, 1997.
Liao, H., Yung, Y. L., and Seinfeld, J. H.: Effect of aerosols on tropospheric photolysis rates in clear and cloudy atmospheres, J. Geophys. Res., 104, 23 697–23 707, 1999.
Madronich, S.: Intercomparison of NO2photodissociation and U.V. radiometer measurements, Atmos. Env., 21, 569–578, 1987. Matthijsen, J., Suhre, K., Rosset, R., Eisele, F. L., III, R. L. M.,
and Tanner, D. J.: Photodissociation and UV radiative transfer in a cloudy atmosphere: Modeling and measurements, J. Geophys. Res., 103, 16 665–16 676, 1998.
McClatchey, R., Fenn, R., Selby, J., Volz, F., and Garing, J.: Opti-cal properties of the atmosphere AFCRL-71-0279, Environmen-tal Research Paper, 1971.
Merienne, M., Jenouvrier, A., and Coquart, B.: The NO2absorption spectrum. 1. absorption cross-sections at ambient temperature in
the 300–500 nm region, J. Atmos. Chem., 20, 281–297, 1995. Parrish, D., Murphy, P., Albritton, D., and Fehsenfeld, F.: The
mea-surement of the photodissociation rate of NO2in the atmosphere, Atmos. Env., 32, 2429–2441, 1983.
Reuder, J. and Schwander, H.: Aerosol effects on UV radiation in nonurban regions, J. Geophys. Res., 104, 4065–4077, 1999. Ruggaber, A., Dlugi, R., and Nakajima, T.: Modelling radiation
quantities and photolysis frequencies in the troposphere, J. At-mos. Chem., 18, 171–210, 1994.
Shetter, R. and M¨uller, M.: Photolysis frequency measurements us-ing actinic flux spectroradiometry durus-ing PEM-Tropics mission: Instrumentation description and some results, J. Geophys. Res., 104, 5647–5661, 1999.
Shetter, R., McDaniel, A., Cantrell, C., Madronich, S., and Calvert, J. G.: Actinometer and eppley radiometer measurements of the NO2photolysis rate coefficient during the Mauna Loa Observa-tory Photochemistry Experiment, J. Geophys. Res., 97, 10 349– 10 359, 1992.
Talukdar, R., Longfellow, C., Gilles, M., and Ravishankara, A.: Quantum yields of O(1D) in the photolysis of ozone between 289 and 329 nm as a function of temperature, Geophys. Res. Lett., 25, 143–146, 1998.
van Weele, M. and Duynkerke, P.: Effects of clouds on the pho-todissociation of NO2: Observations and modelling, J. Atmos. Chem., 16, 231–255, 1993.
van Weele, M., de Arellano, J. V.-G., and Kuik, F.: Combined mea-surements of UV-A actinic flux, UV-A irradiance and global radi-ation in relradi-ation to photodissociradi-ation rates, Tellus, 47B, 353–364, 1995.