HAL Id: hal-02572873
https://hal.archives-ouvertes.fr/hal-02572873
Submitted on 13 May 2020
HAL is a multi-disciplinary open access
archive for the deposit and dissemination of
sci-entific research documents, whether they are
pub-lished or not. The documents may come from
teaching and research institutions in France or
abroad, or from public or private research centers.
L’archive ouverte pluridisciplinaire HAL, est
destinée au dépôt et à la diffusion de documents
scientifiques de niveau recherche, publiés ou non,
émanant des établissements d’enseignement et de
recherche français ou étrangers, des laboratoires
publics ou privés.
oyster Crassostrea gigas in Scandinavia
Ellika Faust, Carl Andre, Sara Meurling, Judith Kochmann, Henrik
Christiansen, Lasse Fast Jensen, Grégory Charrier, Ane T. Laugen, Asa
Strand
To cite this version:
Ellika Faust, Carl Andre, Sara Meurling, Judith Kochmann, Henrik Christiansen, et al.. Origin and
route of establishment of the invasive Pacific oyster Crassostrea gigas in Scandinavia. Marine Ecology
Progress Series, Inter Research, 2017, 575, pp.95-105. �10.3354/meps12219�. �hal-02572873�
INTRODUCTION
Marine invasive species are a major threat to biodi-versity (Costello et al. 2010) and can have substantial ecological and economic impacts. Introduction of non-native species is often mediated by human activities,
such as shipping, trading and aquaculture. Once in-troduced, a successful invader can spread in the wild and establish feral populations, potentially leading to displacement of native species, changes in community structure and food webs, alterations in the abiotic en-vironment, as well as function as a vector for parasites
© The authors 2017. Open Access under Creative Commons by Attribution Licence. Use, distribution and reproduction are un -restricted. Authors and original publication must be credited. Publisher: Inter-Research · www.int-res.com
*Corresponding author: ellika.faust@gmail.com
Origin and route of establishment of the invasive
Pacific oyster
Crassostrea gigas in Scandinavia
Ellika Faust
1,*, Carl André
1, Sara Meurling
2, Judith Kochmann
3, Henrik Christiansen
1, 4,
Lasse Fast Jensen
5, Grégory Charrier
6, Ane T. Laugen
7, 8, Åsa Strand
11Department of Marine Sciences - Tjärnö, University of Gothenburg, 45296 Strömstad, Sweden 2Department of Ecology and Genetics, Uppsala University, 752 36 Uppsala, Sweden
3Senckenberg Gesellschaft für Naturforschung, Senckenberg Biodiversität und Klima Forschungszentrum (SBiK-F),
60325 Frankfurt am Main, Germany
4Laboratory of Biodiversity and Evolutionary Genomics, KU Leuven, 3000 Leuven, Belgium 5Fisheries and Maritime Museum, 6710 Esbjerg V, Denmark
6Université de Bretagne Occidentale, Laboratoire des Sciences de l’Environnement Marin (LEMAR, UMR 6539,
UBO/CNRS/IRD/Ifremer), Institut Universitaire Européen de la Mer (IUEM), 29280 Plouzané, France
7Novia University of Applied Sciences, 10600 Ekenäs, Finland
8Department of Ecology, Swedish University of Agricultural Sciences, 75007 Uppsala, Sweden
ABSTRACT: Identifying the routes and rates of introductions is fundamental for the understand-ing of marine invasions. Recurrunderstand-ing introductions over the last 50 yr have led to the establishment of feral Pacific oyster Crassostrea gigas populations throughout Europe. In the northern countries, Sweden and Norway, the species first occurred in large numbers in 2006. Here, we investigated the relative importance of introduction via re-laying of cultured oysters imported for consumption from France, Ireland or the Netherlands, and dispersal of oyster larvae by ocean currents from wild oyster populations in Denmark. Using microsatellite DNA markers, we estimated genetic dif-ferentiation among Pacific oysters collected at 4 Swedish locations, 3 Norwegian locations and 9 potential source locations in Denmark, Ireland, the Netherlands and France. All Swedish samples and 1 Norwegian sample (Tromlingene) were genetically similar to each other and the Danish samples and showed significant genetic differentiation from all other populations. Consequently, it appears that the Pacific oyster populations in Sweden, Denmark and Tromlingene are closely connected and/or share a recent origin. The 2 remaining Norwegian samples (Hui and Espevik) differed from each other and all other populations, but showed similarities to wild oyster samples from Scandinavia and Ireland, respectively. Overall, the results underline a complex origin of Nor-wegian oysters, with gene flow from Swedish/Danish populations, as well as other unidentified sources. The apparent connectivity among most of the Scandinavian populations has implications for regional management of this invasive species, and highlights possible scenarios for other marine invasive species with a similar life history.
KEY WORDS: Population genetics · Microsatellites · Range expansion · Non-native species · Aquaculture · Connectivity · Scandinavia · Skagerrak
O
PEN
PEN
and diseases (Crooks 2002). Genetic tools are particu-larly useful to analyse population structure and to in-vestigate biological invasions, e.g. to determine disper-sal mechanisms and the origin of non-native species (e.g. Balloux & Lugon-Moulin 2002, Dlugosch & Parker 2008, Geller et al. 2010). Knowing the source population is not only vital to develop suitable management strate-gies for the species in question, but also helps to identify routes and vectors of introduction, which is crucial for predicting and hindering future invasions. At the same time, colonization histories of invasive species can be used to study processes determining genetic diversity of organisms in the marine realm.
One good example of this is the Pacific oyster,
Crassostrea gigas (Thunberg 1793), which originates
from the coastal waters of Japan and south-east Asia. It has been introduced to all continents except Ant -arctica for aquaculture purposes (Padilla 2010), and is now one of the most widely introduced marine invertebrates (Ruesink et al. 2005, Sousa et al. 2009). Despite the common belief that water temperatures in north-western Europe were too low to allow local reproduction (Drinkwaard 1998, Miossec et al. 2009), feral populations can now be found all over Europe, including Scandinavia (Wrange et al. 2010, Laugen et al. 2015) and the British Isles (Ruesink et al. 2005, Kochmann et al. 2012).
Different genetic markers have previously been ap-plied to disentangle the Pacific oysters’ complex pop-ulation structure in Europe (Moehler et al. 2011, Kochmann et al. 2012, Rohfritsch et al. 2013, Lallias et al. 2015). Most of the studies identified a southern population group (stretching from Spain to south Wales) and a northern population group (from Ireland and north Germany to Sweden). Rohfritsch et al. (2013) identified a northern group of Pacific oyster collected from 2 Swedish and 2 Danish locations, sug-gesting natural introduction of the species in Sweden by larval dispersal with oceanic currents from Danish locations. However, their analyses also showed con-trasting patterns of genetic structure within this northern group, since Swedish oysters were signifi-cantly differentiated from those in Limfjord in Den-mark, but not from those in the Danish Wadden Sea.
The complex population structure in Scandinavian waters could be a result of several different factors, such as oyster population demographics, seed transfer for aquaculture production, re-laying of oysters and/or larval dispersal. The first introduction of the species to Scandinavian waters occurred at the be -ginning of the 1970s. From the early 1970s to the late 1990s, several million seed oysters were im ported from around Europe to various locations along the
Danish coast for aquaculture experiments (Troost 2010). Commercial production was initiated in 1986 and ceased in 1998 (Wrange et al. 2010). In Norway, Pacific oysters were imported from the British Isles to a hatchery in Espevik on the Norwegian west coast in 1979 (Strand & Vølstad 1997). Imports to other oyster farms in Norway followed until 1986, when import regulations became stricter (Strand & Vølstad 1997). Determining exactly when cultivation in Norway ceased is difficult, as farmers stopped importing and cultivating Pacific oysters some years before the last cultivation licence was retracted in 2010 (Bodvin et al. 2014). In Sweden, cultivation trials of the Pacific oyster were performed between 1973 and 1976 on the northern west coast (Eklund et al. 1977), but no com-mercial activities as sociated with the species have taken place. In 2007, many independent observations of Pacific oyster settlement on the west coast of Swe-den and Norway were reported, indicating a large recruitment in 2006. Since then, despite both high winter (Strand et al. 2012) and summer mortalities (Mortensen et al. 2016), the species has in creased in densities (Strand & Lindegarth 2014) and is now firmly established in Scandinavian waters (Laugen et al. 2015). Thus, the complex colonization history of the oyster in Scandinavian waters may be used as a good case study to gain further knowledge on processes determining genetic diversity of marine organisms.
Therefore, here we investigated whether the re cent establishment of the Pacific oyster in Sweden and southern Norway was sourced artificially from Euro-pean populations, or naturally by larval dispersal from neighbouring Danish oyster beds. The main production countries from which Pacific oysters are imported are France, the Netherlands and Ireland (Strand & Lindegarth 2014), which therefore can be considered potential artificial sources. Alternatively, oyster larvae could have been naturally transported by the Jutland current from the Wadden Sea and Limfjord area in Denmark to the Swedish west coast (Wrange et al. 2010), which was proven realistic in oceanographic dispersal modelling (Laugen et al. 2015). It is also important to note that these alternative introduction routes are not mutually exclusive, and that multiple pathways of introduction are possible.
MATERIALS AND METHODS
Sampling and genetic analysis
A total of 909 individuals distributed among 19 pop-ulation samples were collected from 13 different
loca-tions, including 3 sites with both wild and aquaculture samples, and 3 Swedish sites (Table 1, Fig. 1). Individ-uals collected at the Swedish sites were separated into 2 classes based on shell length. The 50 largest oysters found at each site (91 to 239 mm) were included to represent the major intro-duction in 2006, whilst the 50 smallest individuals (29 to 81 mm) were in-cluded to represent local recruitment or re peated introduction as well as temporal replicates (Strand & Linde-garth 2014). Only the larger size class was collected from the Swedish loca-tion Furulund, as no small individuals were present. All samples were col-lected between 2008 and 2015 (Table 1). Tissue samples were taken from the ad ductor muscle of each indi-vidual and stored in 96% ethanol (EtOH) until further analysis. Wild oysters from France, the Netherlands, Denmark, Norway and both wild and aquaculture samples from Ireland were collected by local researchers and sent to Sweden as adductor mus-cle tissue samples stored in 96% EtOH. Cultivated, diploid oysters from France and the Netherlands were pro-vided by aquaculture companies, which use locally produced spat, and were shipped alive to Sweden where tissue sampling was performed. DNA was extracted from the tissue samples with the NucleoSpin® Tissue Kit (Macherey-Nagel) and E.Z.N.A.® Tis-sue DNA Kit (Omega Bio-tek) follow-ing standard protocols.
Based on reviewed literature, several loci were chosen and tested, after which some were discarded due to am-plification failure. In total, 7 microsatel-lite loci were finally selected for further analysis: AMY (Sellos et al. 2003),
CGE09 (Yu & Li 2007), Cgsili44 (Sau
-vage et al. 2009), L10, L48 (Huvet et al. 2000), Cg108 and Cg49 (Magou las et al. 1998). All loci were amplified using polymerase chain reaction (PCR), and the amplified products were ana lysed on a CEQ™ 8000 Genetic Analysis Sys-tem (Beckman Coulter). Raw data were
Country Location Sample Sample Coordinates size year
France Marennes-Oléron* 50 2015 45.8063° N, 1.1788° W France Marennes-Oléron 50 2011 45.9113° N, 1.1529° W Netherlands Oosterschelde* 50 2015 51.5031° N, 4.0531° E Netherlands Oosterschelde 49 2013 51.5031° N, 4.0531° E Ireland Lough Foyle*,a 50 2010 55.1026° N, 7.2202° W
Ireland Lough Foylea 50 2010 55.1026° N, 7.2202° W
Ireland Lough Swilly 50 2008 55.0206° N, 7.5770° W Denmark Wadden Sea 50 2012 55.1859° N, 8.6222° E Denmark Limfjorden 50 2012 56.7220° N, 8.2578° E Sweden 1 Smalsundet 50 2011 58.2488° N, 11.4402° E Sweden 1 Furulund 50 2011 58.2753° N, 11.5061° E Sweden 1 Krokesundet 49 2011 58.8617° N, 11.1746° E Sweden 1 Svallhagen 50 2011 58.8684° N, 11.1551° E Sweden 2 Smalsundet 50 2011 58.2488° N, 11.4402° E Sweden 2 Krokesundet 50 2011 58.8617° N, 11.1746° E Sweden 2 Svallhagen 50 2011 58.8684° N, 11.1551° E Norway Tromlingene 46 2013 58.4748° N, 8.9067° E Norway Hui 46 2012 59.1258° N, 10.3651° E Norway Espevik 19 2010 59.3019° N, 5.6988° E
aFor labelling purposes, Lough Foyle was referred to as ‘Ireland’, however,
we recognise that Lough Foyle is currently regulated by a cross-border body (Republic of Ireland/Northern Ireland)
Table 1. Information about the sampling sites of wild and aquaculture (*)
Crass-ostrea gigas. Sample size indicates the number of individuals collected at each
site. Swedish size classes are displayed as 1 = larger individuals (91 to 239 mm) and 2 = smaller individuals (29 to 81 mm)
Fig. 1. Sampling locations (d) of wild and aquaculture Crassostrea gigas indi-viduals across northern Europe including main ocean currents (indicated by
analysed and genotyped with the CEQ Fragment Analysis software. Individuals that could not be geno-typed confidently were re-amplified and re-analysed 3 times before being given null values.
Statistical analysis
In each population sample, observed and expected heterozygosity (Ho, He) were assessed in GenAlEx
6.501 (Peakall & Smouse 2006, 2012), and number of alleles (Na) and allelic richness (AR) were calculated
in FSTAT (Goudet 2002) for each locus. Deviations from Hardy-Weinberg (HW) proportions were ana-lysed by estimating FISaccording to Weir &
Cocker-ham (1984) and calculated in Genepop v.4.3 (Rousset 2008). Moreover, HW exact probability tests were performed in Genepop, using the Markov chain algorithm with the following parameters: 10 000 de -memorization steps, 1000 batches and 5000 iterations batch−1. Significance was assessed using false
dis-covery rate (FDR) corrected p-values (q) to account for multiple testing (Benjamini & Hochberg 1995). The software MICROCHECKER v.2.2.3 (20 000 boot -straps) was used to identify possible null alleles and genotyping errors due to stuttering and large allele drop-out (van Ooster hout et al. 2004). Evolutionary neutrality of the markers was tested in LOSITAN (50 000 simulations; FDR: 0.05), which simulates the distribution of FSTversus heterozygosity to estimate
the FSTdistribution under the null hypothesis of no
selection (Antao et al. 2008).
Pairwise FST(θ) were calculated according to Weir
& Cockerham (1984) in GENETIX v.4.05 (Belkhir et al. 1996–2004) to estimate genetic differentiation be -tween samples. Significance of FSTvalues was tested
using 9999 permutations, and was corrected for mul-tiple testing using FDR. To investigate if any locus had a disproportionate contribution to the joint FST
estimates, a jack-knife resampling over loci was ap plied by systematically omitting one locus at a time. A classical (metric) multidimensional scaling ana lysis (MDS) was performed on pairwise FST
val-ues using the R function ‘cmdscale’ (R Core Team 2014) to visualise any possible population structure. Population pairwise estimates of Jost’s D (Jost 2008) in GenAlEx v.6.501 were used to ensure that high heterozygosity levels did not bias FSTestimates.
The individual-based clustering method STRUC-TURE v.2.3.4 (Pritchard et al. 2000) was used to esti-mate the most likely number of population clusters
(K ) among the sampled locations. The burn-in period
was set to 10 000 and the number of Markov chain
Monte Carlo (MCMC) repetitions to 50 000. Clusters
K from 1 to 19 were run 20 times K−1. No admixture
was used, as each individual was assumed to origi-nate from one of the populations sampled, and Locprior was set to be able to detect lower levels of divergence with the assistance of the sample group information (Hubisz et al. 2009). The different runs were merged for visual analysis with CLUMPAK (Kopelman et al. 2015), and the most likely number of
K was estimated using STRUCTURE HARVESTER
(Earl & vonHoldt 2012) by calculating the posterior probability of data for each value of K (mean lnP [K]) and the modal value of delta K.
Analysis of molecular variance (AMOVA) was per-formed in Arlequin v.3.5.2.2 (Excoffier & Lischer 2010). Molecular variance was divided into 3 hierarchical lev-els: among clusters as identified by STRUCTURE, among samples within clusters and within samples. Significance was assessed using 10 100 permutations. Gene flow among populations was estimated by calcu-lating the directional relative migration using the webbased software application divMigrateonline (Sund -qvist et al. 2016) based on the GST statistic (Nei 1973). Genetic assignment and exclusion tests were per-formed in GeneClass2 (Piry et al. 2004) to estimate the probability of each individual belonging to any of the potential source samples included in the analysis. The exclusion test was performed using Monte Carlo resampling according to Paetkau et al. (2004), to esti-mate the probability of each individual originating from a population not sampled. In total, 10 000 indi-viduals were simulated, and indiindi-viduals that had < 5% probability of originating from any of the sam-pled locations were excluded from all assignments. Source samples in close geographical proximity that showed no significant differentiation and belonged to the same size class (French wild and aquaculture, Danish Limfjorden and Wadden Sea, as well as Swedish samples of the same size class), were then pooled together to allow for clearer assignments. The likely origin of oysters was evaluated in 2 separate assignment analyses. First, all collected individuals were assigned to any of the population samples using a self-assignment test, where the assigned individual was excluded as a reference in the sample from which it was taken (leave-one-out procedure; Efron 1983). Second, to estimate the most likely origin of the Swedish and Norwegian oysters, all individuals collected in Sweden and Norway were assigned to the French, Dutch, Irish or Danish population sam-ples. Both tests were performed according to the pro-cedure described by Rannala & Mountain (1997). Individuals were considered successfully assigned
only if assignment with the highest score was twice as likely as the assignment with the second highest score (rank1 × rank2−1 > 2), ensuring robustness in
the assignment result.
RESULTS
A total of 902 of the 909 collected oysters were cessfully genotyped at 4 or more loci. Genotyping suc-cess was above 98% for all loci except for Cgsili44, which had a genotyping success of 88%. The sample displaying the lowest genotyping success was the Dutch wild sample, which had an average of 84% successfully genotyped individuals, while all other samples averaged above 90%. MICRO-CHECKER found no evidence of null alleles or genotyping errors, and LOSITAN showed no indication of selection act-ing on any of the loci.
Genetic diversity and HW proportions
The largest genetic diversity was ob -served in the French samples and the Dutch wild sample, with an average Na
of 30 to 32 alleles and average ARof 14
to 19. Remaining samples displayed a mean Naof 11 to 23 and ARof 11 to 16.
The lowest Naand ARvalues were
ob-served in the smallest sample, Norwe-gian Espe vik, and the wild and aqua-culture samples from Irish Lough Foyle.
Ho and He were high at all locations,
ranging from 0.71 to 1 and 0.80 to 0.98, respectively. A summary of the genetic diversity is presented in Table S1 in the Supplement at www. int-res. com/
articles/ suppl/ m575 p095_ supp. pdf.
HW exact tests revealed that locus
Cg49 deviated significantly (p < 0.05)
from expected HW proportions for all samples, and was therefore ex -cluded from further analysis. Among the re maining loci, an additional 10 deviations were identified (q < 0.05; Table S2). More than half of the devia-tions were found in the aquaculture samples (6 out of 10). Another 3 devia-tions were found for wild samples in close proximity to aquaculture facili-ties.
Population structure
All loci displayed similar differentiation patterns and contributed equally to the pairwise FSTestimates
as shown in the jack-knife resampling (Fig. S1), illus-trating the robustness of the FST estimates. All loci
(except for the previously excluded Cg49) were therefore included in the subsequent analyses. Of the 172 pairwise FSTtests for genetic differentiation,
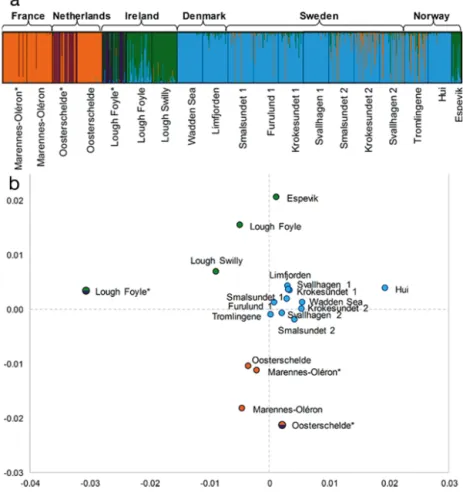
124 displayed significant differentiation (q < 0.05; Table S3). Two groups of closely related samples could be identified: a northern group (all samples from Denmark and Sweden as well as the Norwegian Tromlingene sample) and a southern group (French wild, French aquaculture and Dutch wild samples) (Fig. 2b, Table S3). The southern group showed no within-group differentiation (q < 0.05) with pairwise
FST values ranging from −0.0016 to 0.0027. The
Fig. 2. Genetic population structure of Crassostrea gigas based on 6 microsatel-lite markers. (a) Output from CLUMPAK, visualising major modes for K = 4 from the individual-based clustering performed in STRUCTURE. Every vertical line represents 1 individual and the colour shows the proportion of each individual assigned to each of the 4 genetic clusters. (b) Classical metric multidimensional scaling (MDS) analysis, performed on pairwise FST estimates. Symbols are
colour-coded according to clusters identified in the STRUCTURE analysis. Swedish size classes are displayed as 1 = larger individuals (91 to 239 mm) and
northern group displayed a range of pairwise FST
estimates of −0.0034 to 0.004, with the only signifi-cant differentiation between the 2 size classes in Swedish Krokesundet (q = 0.031). Samples were sig-nificantly differentiated between the 2 groups (FST=
0.0079 to 0.0216). All remaining samples, which were not included in the 2 groups (i.e. Hui, Espevik, Ire-land, and Dutch aquaculture) were significantly dif-ferentiated in all pairwise tests. Patterns of pairwise Jost’s D showed identical results (data not shown).
A closer inspection of pairwise FSTestimates and
the MDS analysis revealed additional patterns of population structure (Fig. 2b, Table S3). A third puta-tive western group could be observed from the MDS, where Irish wild samples (Lough Foyle and Lough Swilly) and the Norwegian Espevik sample appeared separated from the other 2 groups. The western group was less divergent from the northern group
(FST= 0.0065 to 0.0257) than from the southern one
(FST = 0.0199 to 0.0415). Moreover, Norwegian Hui
was more related to the northern group (FST= 0.0053
to 0.0124), and the Dutch aquaculture sample was closer to the southern group. Finally, the Lough Foyle Farm sample was strongly differentiated from all other samples.
The STRUCTURE clustering analysis was used to identify groups based only on genetic similarities among individuals. The mean lnP(K ) plateaued at
K = 4 (Fig. S2), representing the most likely number
of population clusters. Delta K displayed clear peaks at K = 2 and K = 4, capturing the major structure of the data set (Fig. S3). These results suggested the existence of 4 genetically differentiated clusters (Fig. 2a). The first 2 clusters corresponded closely to the southern and northern groups (orange and blue, respectively), in concordance with pairwise FST
esti-mates and assignment tests (below). Moreover, Nor-wegian Hui clustered with the northern group. The third cluster (green) grouped the wild Irish samples with the Norwegian Espevik sample, in accordance with the low divergence found with pairwise FST
tests. In addition, the wild Lough Foyle sample also displayed a large proportion of individuals partly admixed with the northern group (blue). Both Lough Foyle aquaculture and Dutch aquaculture samples appeared to consist of mixed populations, with con-nections to both the green and orange clusters as well as a fourth cluster (purple).
The AMOVA performed on the clusters identified by STRUCTURE (blue: all Danish, Swedish and Nor-wegian Tromlingene and Hui; orange: all French and wild Dutch; green: wild Irish and Norwegian Espe-vik; purple/green: Irish aquaculture; purple/orange:
Dutch aquaculture) showed that the genetic differen-tiation among clusters (FCT= 0.0167, p < 0.0001), was
more than 5 times those among samples within clus-ters (FSC= 0.00323, p < 0.0001). Similar results were
obtained when excluding aquaculture samples (FCT=
0.0131, FSC= 0.00344).
Migration patterns and assignment tests
The analysis of directional migration dynamics re vealed a network (Fig. 3a) where populations grouped in a similar way to what was observed in the MDS based on pairwise FSTvalues. The main
differ-ence being that Espevik did not cluster with the wild Irish samples. Instead, cultured and wild Irish sam-ples formed a putative group. The network demon-strated strong directional relative migration (above 0.5) within the southern group and the northern group (Fig. 3b), respectively.
Finally, the probability of each individual originat-ing from any of the populations included in the study was explored with exclusion and assignment tests. In the individual-based exclusion test, all but 5 individ-uals had > 5% probability of originating from at least 1 of the 19 samples. The 5 individuals that had lower probability were excluded from all assignment tests. When tested for robust assignments (rank1 × rank2−1
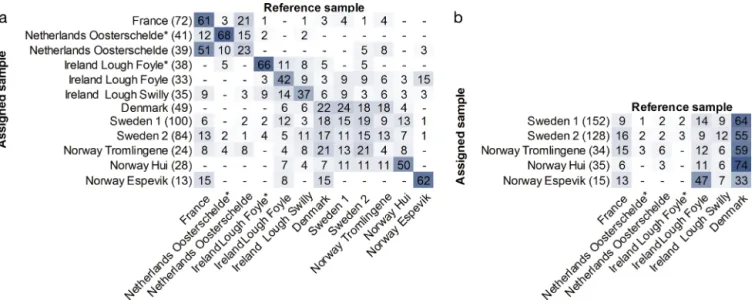
> 2), 341 of 897 individuals were excluded from the self-assignment test and 95 of 459 of Swedish and Norwegian individuals from the assignment to popu-lation of putative origin. To control for exclusion effects, all assignments were also performed using all individuals, which resulted in only minor changes in proportions, thus confirming the robustness of the results. The assignment results are displayed as per-centages in heat maps (Fig. 4). The self-assignment showed similar patterns as the FST. In the northern
group (Denmark, Sweden and Norwegian Tromlin-gene) 65% of the individuals were assigned within the northern group, and in the southern group (French and wild Dutch samples) 78% of the individ-uals were assigned within the group, of which the majority was assigned to France. Samples that showed differentiation to all other samples in the pairwise FSTdemonstrated the highest assignment to
their own source: the highest proportion of self-assignment was found for Dutch aquaculture (68%) and Irish aquaculture (66%). In accordance with FST
estimates and individual clustering, a large propor-tion of individuals from Norwegian Hui, Irish Lough Foyle and Lough Swilly assigned to the northern group (40, 27 and 24%, respectively).
To estimate the origin of introduction, oysters col-lected in Norway and Sweden were assigned to populations of potential origin. The majority of indi-viduals collected in Sweden assigned to Denmark (Fig. 4b). Remaining individuals from Sweden were mainly assigned to French and wild Irish samples.
Very few individuals collected in Sweden were as -signed to the Dutch or Irish aquaculture. Norwegian Tromlingene and Hui demonstrated a similar pat-tern, with 59 and 74% assignment to Denmark, respectively. Norwegian Espevik did, however, assign mainly to the wild Irish Lough Foyle sample.
Fig. 3. Directional relative migration of Crassostrea gigas calculated by divMigrate-online using GST. Arrows indicate the
direction of gene flow, and numbers show relative migration coefficient. Arrows with higher numbers appear thicker and stronger in colour. (a) Network based on migration values; (b) network based on values above 0.5 only
Fig. 4. Heat map of individual assignment of Crassostrea gigas. Samples in close geographical proximity that showed no sig-nificant differentiation are pooled: France (aquaculture and wild samples), Sweden 1 (all Swedish samples of larger individu-als, 91 to 239 mm), Sweden 2 (all Swedish samples of smaller individuindividu-als, 29 to 81 mm), Denmark (Limfjorden and Wadden Sea). Values displayed in brackets are number of individuals assigned and remaining values are percentage of individuals assigned. (a) Self-assignment where numbers display percentage of individuals assigned to samples based on likelihood. (b) Assignment to population of potential origin. Percentage of individuals from Sweden and Norway assigned to populations of
DISCUSSION
Our results do not support the assumption that France, the Netherlands or Ireland are the main sources of the Swedish and Norwegian populations of Pacific oysters. Rather, the lack of genetic differentia-tion between oysters from Denmark and Sweden in-dicates that Danish oysters are the likely source of origin of the Swedish populations, or that Danish and Swedish oysters share common ancestry. The ana -lysis of origin of the Norwegian oysters shows a more mixed pattern. The majority of oysters in Tromlingene likely originate or receive significant gene flow from Swedish and/or Danish populations. Although Hui was closely related to Swedish and Danish oysters, and Espevik to Irish oysters, we were not able to con-clusively determine the origin of these 2 populations.
Genetic diversity patterns
Several populations showed deviations from HW proportions in the form of heterozygote deficiency, consistent with previous studies of the Pacific oyster (Meistertzheim et al. 2013, Rohfritsch et al. 2013, Lal-lias et al. 2015). However, only weak general patterns in heterozygote deficiency across samples or popula-tions were observed: the Irish aquaculture sample showed a pattern of consistent deficit across loci in-dicative of inbreeding or a Wahlund effect (when a sampled ‘population’ is a mixture of different subpop-ulations; Wahlund 1928). Although hetero zygote defi-ciency was observed in some of the samples, both Ho
and Hewere relatively high for all samples across all
loci, in agreement with previous studies performed on
Crassostrea gigas (Li et al. 2006, Kochmann et al.
2012, Rohfritsch et al. 2013, Lallias et al. 2015). On the other hand, when considering Naand AR, higher
ge-netic diversity was ob served in the southern group. Likely explanations include repeated introduction of spat for aquaculture and/or genetic loss in the north-ern locations as a result of bottlenecks during range expansion from the older southern groups, and subse-quent inbreeding and genetic drift. Bottlenecks were previously observed in the northern expansion of the Pacific oyster in Europe, although only minor loss in genetic variability was detected (Meistertzheim et al. 2013). Bottlenecks are known to have relatively little effect on heterozygosity but may reduce the number of alleles very quickly (Allendorf 1986). This would explain why samples displayed large variation in allelic diversity (Na and AR), but showed little to no
difference in heterozygosity (Hoand He).
Origin of the Pacific oyster in Sweden
Across all analyses, we detected significant gen -etic differentiation between the Swedish samples and those collected in countries producing oysters (France, the Netherlands and Ireland). Therefore, the presence of Pacific oysters in Sweden is unlikely to be a result of re-laying and subsequent spawning of cultured oysters imported for consumption in Swe-den. Moreover, no genetic differentiation was found between Swedish and Danish samples, which indi-cates connectivity between Denmark and Sweden, or a common recent origin.
Oceanographic current trajectory modelling by Laugen et al. (2015) demonstrates that, although un -likely for larvae from the Danish Wadden Sea, larvae from the Danish Limfjord can be transported with the Jutland current to the Swedish west coast. The dis-persal model also indicates that if larvae were trans-ported to Sweden with the Jutland current, the major-ity would end up in the area around Gothenburg and northwards, which is in accordance with observa-tions from 2007 (Wrange et al. 2010). Al though no genetic differentiation was found among Danish and Swedish samples, samples from Sweden exhibited higher allelic richness than samples from the Danish Wadden Sea, and similar or slightly higher average allelic richness than samples from the Limfjord. This could be a result of Swedish oysters having multiple source populations, as some individuals (especially juveniles) appear to originate from France/ the Nether-lands/Ireland (Fig. 2a).
In contrast to the observed genetic similarities be-tween oysters in the Danish Wadden Sea and the Limfjord in the present study, the oceanographic par-ticle transport study by Laugen et al. (2015) and data presented by Rohfritsch et al. (2013) suggest that the Danish Wadden Sea and the Limfjord may not be well connected. We observed higher genetic diversity (al-lelic richness) in the Limfjord compared to the Danish Wadden Sea, which suggests that Pacific oysters in Denmark may have multiple sources of origin and/or that each population may have slightly evolved in re-sponse to genetic drift associated with demographic processes creating chaotic genetic patchiness (David et al. 1997, Broquet et al. 2013). Variability in recruit-ment success may lead to genetic variability at a small spatio-temporal scale (Hedge cock & Pudovkin 2011). This phenomenon has been well demonstrated in marine invertebrates (Riquet et al. 2016) and may very well explain the different levels in genetic diver-sity between the 2 Danish samples, as well as the con-trasted results with Rohfritsch et al. (2013).
Origin of the Pacific oyster in Norway
The origin of Pacific oysters in Norway seems to be more complex than that of the oysters in Sweden. All 3 Norwegian samples were genetically distinct and showed a varying degree of genetic differentiation in relation to other samples. This suggests that Pacific oysters in Norway may originate from multiple sources. The sample from Tromlingene was not dif-ferentiated from either Danish or Swedish samples, suggesting connectivity between Tromlingene and either Sweden and/or Denmark. The dispersal model by Laugen et al. (2015) demonstrates that it is indeed possible for oyster larvae from Sweden to spread north-east along the Norwegian coast, which could explain the connectivity between Swedish and Nor-wegian oysters.
Although geographically closer to Sweden, Norwe-gian Hui did not demonstrate the same level of genetic similarity to the Swedish and Danish samples as Tromlingene. Whilst pairwise FST values
sug-gested a dissimilarity from the northern group, the re latively low FST values, STRUCTURE results, as
-sign ments and directional relative migration (0.23 to 0.65) suggest a close connection between Hui and the northern group. Possible causes of this seemingly contradictory pattern could be that Pacific oysters in Hui originate (1) from an unsampled population closely related to the northern group; (2) from a mix-ture of multiple sources, one of which is the northern group; or (3) from the northern group, but represent a more extreme founder event. The last case is the most probable, as Hui has relatively low allelic diver-sity and appears to be the least admixed northern population (Fig. 2a).
The Norwegian Espevik has a history of importing and exporting Pacific oyster spat from the British Isles (Strand & Vølstad 1997). This historical back-ground is likely to explain the genetic differentiation pattern observed in the MDS and clustering analy-ses, which grouped Espevik and the wild Irish sam-ples. Nonetheless, pairwise FST revealed some
genetic heterogeneity between oysters from Espevik and Ireland, suggesting that Espevik oysters appear, at least in part, to originate from or share history with Irish oysters.
CONCLUSIONS
The results presented in this study point to a high interconnectivity among Scandinavian oyster popu-lations, which was previously suspected but not
established. We conclude that the invasive Pacific oyster, which is now well established in Sweden, likely originated from Danish populations, and that larval drift is the most probable pathway of introduc-tion. This means that even if the Pacific oyster was to become locally extinct in Sweden and Norway, by natural or anthropogenic causes, re-colonization from Danish populations can be expected. Also, estab-lished populations in Norwegian Tromlingene, and to some extent Hui, are likely to be a result of larval drift from Sweden and/or Denmark. Overall, genetic diversity patterns in this study are consistent with oceanographic drift models (Laugen et al. 2015), showing that such transport is probable, and may occur repeatedly. This insight highlights the impor-tance of trans-national collaboration and a joint de velopment of management plans; for example, a country-specific management program aimed at the eradication of the Pacific oyster, such as suggested by Guy & Roberts (2010), would be futile. Yet, trans-national management is hard to achieve due to country-specific variations in interpretations of inter-national legislation, inter-national agendas and legislation, and societal perceptions of the species as a menace or a resource. With the genome of the Pacific oyster now sequenced (Zhang et al. 2012), it would be pos-sible to investigate the observed connectivity further at a genome-wide level. Moreover, possible adapta-tions to a colder environment and the potential for future range expansion as suggested by Sussarellu et al. (2015) should be assessed to further assist in -formed management decisions.
The recent increase in mean temperature of Scan-dinavian waters is likely to continue (IPCC 2014), making future invasions of warm-water species prob able. Knowing the pathway of introduction for the Pacific oyster may therefore inform our predic-tions about other organisms with similar life histories, which in turn provides insights about future inva-sions of other alien species. Thus, establishing path-ways of introduction and current distributions of spe-cies that may impact native ecosystems will assist in determining (1) whether management actions are needed, (2) the geographic extent of possible agement actions, and (3) the efficiency of those man-agement actions.
Acknowledgements. We express our deep thanks to Torjan
Bodvin, Stein Mortensen, Sylvie Lapègue, Herrman Hum-mel, Stefano Mariani and Jennifer Coughlan for their valu-able assistance with sample collection; to Eva-Lotta Blom, Karin André and Melike Kazak for assistance with tissue preparation and DNA extractions; to Anna-Karin Ring for
lab work; and to Anders Hall for information on shipping routes and ballast water. Comments from the editor and 3 reviewers helped improve the manuscript. FORMAS (grant 2011-1132), the Linnaeus grant (www.cemeb.science.gu.se), EU Interreg (MarGen), and the private foundations Olle Engkvist byggmästare, Herbert & Karin Jacobssons stiftelse, Stiftelsen Birgit och Birger Wåhlströms minnesfond för den Bohuslänska havs- och insjömiljön, Helge Ax:son Johnsons stiftelse and Lundgrenska stiftelserna supported this study financially through grants to Å.S.
LITERATURE CITED
Allendorf FW (1986) Genetic drift and the loss of alleles ver-sus heterozygosity. Zoo Biol 5: 181−190
Antao T, Lopes A, Lopes RJ, Beja-Pereira A, Luikart G (2008) LOSITAN: a workbench to detect molecular adap-tation based on a Fst-outlier method. BMC Bioinformatics
9: 323
Balloux F, Lugon-Moulin N (2002) The estimation of popula-tion differentiapopula-tion with microsatellite markers. Mol Ecol 11: 155−165
Belkhir K, Borsa P, Chikhi L, Raufaste N, Bonhomme F (1996−2004) GENETIX 4.05, logiciel sous Windows™ pour la génétique des populations. Laboratoire Génome, Populations, Interactions, CNRS UMR 5000, Universite de Montpellier II, Montpellier
Benjamini Y, Hochberg Y (1995) Controlling the false dis-covery rate: a practical and powerful approach to multi-ple testing. J R Stat Soc B 57: 289−300
Bodvin T, Rinde E, Mortensen S (2014) Faggrunnlag stille-havsøsters (Crassostrea gigas). Institute of Marine Research, Bergen
Broquet T, Viard F, Yearsley JM (2013) Genetic drift and col-lective dispersal can result in chaotic genetic patchiness. Evolution 67: 1660−1675
Costello MJ, Coll M, Danovaro R, Halpin P, Ojaveer H, Miloslavich P (2010) A census of marine biodiversity knowledge, resources, and future challenges. PLOS ONE 5: e12110
Crooks JA (2002) Characterizing ecosystem-level conse-quences of biological invasions: the role of ecosystem engineers. Oikos 97: 153−166
David P, Perdieu MA, Pernot AF, Jarne P (1997) Fine-grained spatial and temporal population genetic struc-ture in the marine bivalve Spisula ovalis. Evolution 51: 1318−1322
Dlugosch KM, Parker IM (2008) Founding events in species invasions: genetic variation, adaptive evolution, and the role of multiple introductions. Mol Ecol 17: 431−449 Drinkwaard AC (1998) Introductions and developments of
oysters in the North Sea area: a review. Helgol Meeres -unters 52: 301−308
Earl DA, vonHoldt BM (2012) STRUCTURE HARVESTER: a website and program for visualizing STRUCTURE output and implementing the Evanno method. Conserv Genet Resour 4: 359−361
Efron B (1983) Estimating the error rate of a prediction rule: improvement on cross-validation. J Am Stat Assoc 78: 316−331
Eklund U, Håkansson M, Haamer J (1977) En undersökning om förutsättningarna för ostron odling vid svenska västkusten. Chalmers Tekniska Högskola och Göteborgs Universitet Publ B 83, Göteborg
Excoffier L, Lischer HEL (2010) Arlequin suite ver 3.5: a new series of programs to perform population genetics analy-ses under Linux and Windows. Mol Ecol Resour 10: 564−567
Geller JB, Darling JA, Carlton JT (2010) Genetic perspec-tives on marine biological invasions. Annu Rev Mar Sci 2: 367−393
Goudet J (2002) FSTAT, a program to estimate and test gene diversities and differentiation statistics from codominant genetic markers (version 2.9.3.2.). http: //www2. unil. ch/ popgen/softwares/fstat.htm (accessed 26 May 2015) Guy C, Roberts D (2010) Can the spread of non-native
oys-ters (Crassostrea gigas) at the early stages of population expansion be managed? Mar Pollut Bull 60: 1059−1064 Hedgecock D, Pudovkin A (2011) Sweepstakes reproductive
success in highly fecund marine fish and shellfish: a review and commentary. Bull Mar Sci 87: 971−1002 Hubisz MJ, Falush D, Stephens M, Pritchard JK (2009)
Infer-ring weak population structure with the assistance of sample group information. Mol Ecol Resour 9: 1322−1332 Huvet A, Boudry P, Ohresser M, Delsert C, Bonhomme F (2000) Variable microsatellites in the Pacific Oyster
Crassostrea gigas and other cupped oyster species. Anim
Genet 31: 71−72
IPCC (2014) Climate change 2014: synthesis report. Contri-bution of Working Groups I, II and III to the Fifth Assess-ment Report of the IntergovernAssess-mental Panel on Climate Change. IPCC, Geneva
Jost L (2008) GSTand its relatives do not measure
differenti-ation. Mol Ecol 17: 4015−4026
Kochmann J, Carlsson J, Crowe TP, Mariani S (2012) Genetic evidence for the uncoupling of local aquaculture activities and a population of an invasive species — a case study of Pacific oysters (Crassostrea gigas). J Hered 103: 661−671 Kopelman NM, Mayzel J, Jakobsson M, Rosenberg NA,
Mayrose I (2015) CLUMPAK: a program for identifying clustering modes and packaging population structure inferences across K. Mol Ecol Resour 15: 1179−1191 Lallias D, Boudry P, Batista FM, Beaumont A, King JW,
Turner JR, Lapègue S (2015) Invasion genetics of the Pacific oyster Crassostrea gigas in the British Isles inferred from microsatellite and mitochondrial markers. Biol Invasions 17: 2581−2595
Laugen AT, Hollander J, Obst M, Strand Å (2015) The Pacific oyster (Crassostrea gigas) invasion in Scandina-vian coastal waters: impact on local ecosystem services. In: Canning-Clode J (ed) Biological invasions in chang-ing ecosystems: vectors, ecological impacts, manage-ment and predictions. De Gruyter Open, Warsaw, p 232−257
Li Q, Yu H, Yu R (2006) Genetic variability assessed by micro satellites in cultured populations of the Pacific oys-ter (Crassostrea gigas) in China. Aquaculture 259: 95−102 Magoulas A, Gjetvaj B, Terzogoul V, Zouros E (1998) Three polymorphic microsatellites in the Japanese oyster,
Crassostrea gigas (Thunberg). Anim Genet 29: 69−70
Meistertzheim AL, Arnaud-Haond S, Boudry P, Thébault MT (2013) Genetic structure of wild European popula-tions of the invasive Pacific oyster Crassostrea gigas due to aquaculture practices. Mar Biol 160: 453−463
Miossec L, Le Deuff RM, Goulletquer P (2009) Alien species alert: Crassostrea gigas (Pacific oyster). ICES Coop Res Rep 299: 1−42
Moehler J, Wegner KM, Reise K, Jacobsen S (2011) Invasion genetics of Pacific oyster Crassostrea gigas shaped by
aquaculture stocking practices. J Sea Res 66: 256−262 Mortensen S, Strand Å, Bodvin T, Alfjorden A and others
(2016) Summer mortalities and detection of ostreid her-pesvirus microvariant in Pacific oyster Crassostrea gigas in Sweden and Norway. Dis Aquat Org 117: 171−176 Nei M (1973) Analysis of gene diversity in subdivided
popu-lations. Proc Natl Acad Sci USA 70: 3321−3323
Padilla DK (2010) Context-dependent impacts of a non-native ecosystem engineer, the Pacific oyster Crassostrea
gigas. Integr Comp Biol 50: 213−225
Paetkau D, Slade R, Burden M, Estoup A (2004) Genetic assignment methods for the direct, real-time estimation of migration rate: a simulation-based exploration of accu-racy and power. Mol Ecol 13: 55−65
Peakall R, Smouse PE (2006) GENALEX6: genetic analysis in
Excel. Population genetic software for teaching and research. Mol Ecol Notes 6: 288−295
Peakall R, Smouse PE (2012) GenALEx 6.5: genetic analysis in Excel. Population genetic software for teaching and research — an update. Bioinformatics 28: 2537−2539 Piry S, Alapetite A, Cornuet JM, Paetkau D, Baudouin L,
Estoup A (2004) GENECLASS2: a software for genetic assignment and first-generation migrant detection. J Hered 95: 536−539
Pritchard JK, Stephens M, Donnelly P (2000) Inference of population structure using multilocus genotype data. Genetics 155: 945−959
R Core Team (2014) R: a language and environment for sta-tistical computing. R Foundation for Stasta-tistical Comput-ing, Vienna
Rannala B, Mountain JL (1997) Detecting immigration by using multilocus genotypes. Proc Natl Acad Sci USA 94: 9197−9201
Riquet F, Le Cam S, Fonteneau E, Viard F (2016) Moderate genetic drift is driven by extreme recruitment events in the invasive mollusk Crepidula fornicata. Heredity 117: 42−50
Rohfritsch A, Bierne N, Boudry P, Heurtebise S, Cornette F, Lapègue S (2013) Population genomics shed light on the demographic and adaptive histories of European inva-sion in the Pacific oyster, Crassostrea gigas. Evol Appl 6: 1064−1078
Rousset F (2008) GENEPOP’007: a complete re-implementa-tion of the GENEPOPsoftware for Windows and Linux. Mol Ecol Resour 8: 103−106
Ruesink JL, Lenihan HS, Trimble AC, Heiman KW, Micheli F, Byers JE, Kay MC (2005) Introduction of non-native oysters: ecosystem effects and restoration implications. Annu Rev Ecol Evol Syst 36: 643−689
Sauvage C, Boudry P, Lapègue S (2009) Identification and characterization of 18 novel polymorphic microsatellite makers derived from expressed sequence tags in the
Pacific oyster Crassostrea gigas. Mol Ecol Resour 9: 853−855
Sellos D, Moal J, Degremont L, Huvet A and others (2003) Structure of amylase genes in populations of pacific cupped oyster (Crassostrea gigas): tissue expression and allelic polymorphism. Mar Biotechnol (NY) 5: 360−372 Sousa R, Gutiérrez JL, Aldridge DC (2009) Non-indigenous
invasive bivalves as ecosystem engineers. Biol Invasions 11: 2367−2385
Strand Å, Lindegarth S (2014) Japanska ostron i svenska vatten — Främmande art som är här för att stanna. Rapp från Vattenbrukscentrum Väst 2: 1−62
Strand Å, Blanda E, Bodvin T, Davids JK and others (2012) Impact of an icy winter on the Pacific oyster (Crassostrea
gigas Thunberg, 1793) population in Scandinavia. Aquat
Invasions 7: 433−440
Strand Ø, Vølstad JH (1997) The Molluscan fisheries and cul-ture of Norway. In: MacKenzie CL Jr, Burrell VG Jr, Rosen-field A, Hobart WL (eds) The history, present condition, and future of the molluscan fisheries of North and Central America and Europe, Vol 3. NOAA Tech Rep NMFS 129, US Department of Commerce, Seattle, WA, p 7−24 Sundqvist L, Keenan K, Zackrisson M, Prodöhl P, Kleinhans
D (2016) Directional genetic differentiation and relative migration. Ecol Evol 6: 3461−3475
Sussarellu R, Huvet A, Lapègue S, Quillen V and others (2015) Additive transcriptomic variation associated with reproductive traits suggest local adaptation in a recently settled population of the Pacific oyster, Crassostrea
gigas. BMC Genomics 16: 808
Troost K (2010) Causes and effects of a highly successful marine invasion: case-study of the introduced Pacific oyster Crassostrea gigas in continental NW European estuaries. J Sea Res 64: 145−165
van Oosterhout C, Hutchinson WF, Wills DPM, Shipley P (2004) MICRO-CHECKER: software for identifying and cor-recting genotyping errors in microsatellite data. Mol Ecol Notes 4: 535−538
Wahlund S (1928) Zusammensetzung von populationen und korrelationserscheinungen vom standpunkt der verer-bungslehre aus betrachtet. Hereditas 11: 65−106 Weir BS, Cockerham CC (1984) Estimating F-statistics for
the analysis of population structure. Evolution 38: 1358−1370
Wrange AL, Valero J, Harkestad LS, Strand Ø and others (2010) Massive settlements of the Pacific oyster, Cras sos
trea gigas, in Scandinavia. Biol Invasions 12: 1145−1152
Yu H, Li Q (2007) EST-SSR markers from the Pacific oyster,
Crassostrea gigas. Mol Ecol Notes 7: 860−862
Zhang G, Fang X, Guo X, Li L and others (2012) The oyster genome reveals stress adaptation and complexity of shell formation. Nature 490:49−54
Editorial responsibility: Per Palsbøll, Groningen, The Netherlands
Submitted: November 15, 2016; Accepted: June 1, 2017 Proofs received from author(s): July 14, 2017