Aberystwyth University
Operational evapotranspiration estimates from SEVIRI in support of sustainable
water management
Petropoulos, George; Ireland, Gareth; Lamine, Salim; Griffiths, Hywel; Ghilain, Nicolas; Anagnostopoulos, Vasileios; North, Matthew; Srivastava, Prashant K. ; Georgopoulou, Hro
Published in:
International Journal of Applied Earth Observation and Geoinformation
DOI:
10.1016/j.jag.2016.02.006
Publication date:
2016
Citation for published version (APA):
Petropoulos, G., Ireland, G., Lamine, S., Griffiths, H., Ghilain, N., Anagnostopoulos, V., North, M., Srivastava, P. K., & Georgopoulou, H. (2016). Operational evapotranspiration estimates from SEVIRI in support of sustainable water management. International Journal of Applied Earth Observation and Geoinformation, 49, 175-187. https://doi.org/10.1016/j.jag.2016.02.006
General rights
Copyright and moral rights for the publications made accessible in the Aberystwyth Research Portal (the Institutional Repository) are retained by the authors and/or other copyright owners and it is a condition of accessing publications that users recognise and abide by the legal requirements associated with these rights.
• Users may download and print one copy of any publication from the Aberystwyth Research Portal for the purpose of private study or research.
• You may not further distribute the material or use it for any profit-making activity or commercial gain • You may freely distribute the URL identifying the publication in the Aberystwyth Research Portal Take down policy
If you believe that this document breaches copyright please contact us providing details, and we will remove access to the work immediately and investigate your claim.
tel: +44 1970 62 2400 email: is@aber.ac.uk
Page | 1
Operational Evapotranspiration Estimates from SEVIRI support
1Sustainable Water Management
2George P. Petropoulos1*, Gareth Ireland1, Salim Lamine1,2, Hywel M. Griffiths1,
3
Nicholas Ghilain3, Vasilieios Anagnostopoulos4, Matthew R. North1,
4
Prashant K. Srivastava5,6, Hro Georgopoulou7
5
1 Department of Geography and Earth Sciences, Aberystwyth University, Aberystwyth, SY23 2DB, Wales, UK 6
2Department of Ecology and Environment, University of Sciences and Technology Houari Boumediene, BP 32, El Alia, Bab 7
Ezzouar, Algiers, Algeria
8
3Royal Meteorological Institute, Brussels, Belgium 9
4Distributed and Knowledge Management Systems Lab, National Technical University of Athens, Greece 10
5NASA Goddard Space Flight Center, Greenbelt, Maryland, USA 11
6Institute of Environment and Sustainable Development, Banaras Hindu University, Varanasi, India 12
7InfoCosmos Ltd, Pindou 71, 13341, Athens, Greece 13
14
* Author for correspondence, email: petropoulos.george@gmail.com
15 16 17
ABSTRACT
18This study aimed at exploring the accuracy of the Evapotranspiration (ET) operational estimates 19
from the Meteosat Second Generation (MSG) Spinning Enhanced Visible Infra-Red Imager 20
(SEVIRI) at a range of selected ecosystems in Europe. For this purpose were utilised in-situ eddy 21
covariance measurements acquired from 7 selected experimental sites belonging to the 22
CarboEurope ground observational network, acquired over 2 full years of observations (2010-23
2011). Appraisal of ET accuracy from this product was also investigated with respect to land 24
cover, season and each site(s) degree of heterogeneity, the latter being expressed by the 25
fractional vegetation cover (FVC) operational product of SEVIRI. 26
Results indicated a close agreement between the operational products ET estimates and the 27
tower based in-situ ET measurements for all days of comparison, showing a satisfactory 28
correlation (r of 0.709) with accuracies often comparable to previous analogous studies. From 29
all land cover types, the grassland and cropland sites exhibited the closest agreement (r from 30
0.705 to 0.759). Among seasons, strongest correlations were observed during the summer and 31
autumn (r of 0.714 & 0.685 respectively), whereas with FVC a highest correlation of 0.735 was 32
observed for the class FVC 0.75-1 when compared against the observed values for the complete 33
monitoring period. Our findings support the potential value of the SEVIRI ET product for 34
regional to mesoscale studies and corroborate its credibility for usage in many practical 35
applications. The latter is of particular importance for water limiting environments, such as 36
those found in the Mediterranean basin, as accurate information on ET rates can provide 37
tremendous support in sustainable water resource management as well as policy and decision 38
making in those areas. 39
40
KEYWORDS: evapotranspiration, ET, SEVIRI, water management, Earth Observation, 41
CarboEurope 42
Page | 2 1. INTRODUCTION
44
The combined impacts of climate change, population increase and migration to urban areas are 45
likely to cause significant water resource crises in the coming decades (Jones, 2014). The 46
temporal and spatial scales of these crises mean that mitigation of, and adaptation to them, 47
require reliable data on which management decisions can be made (Wagner et al., 2015). 48
However, these data are lacking for a number of important hydrological processes, especially in 49
regions such as Africa (Legesse et al., 2003) South America (Smolders et al., 2004) and Asia 50
(Remesan and Holman, 2015; Srinivasan et al., 2015). One such process which is of key 51
importance in many practical applications is evapotranspiration (Srivastava et al., 2013c; 52
Ireland et al., 2015). This critical process is the way in which water is transferred as vapour from 53
the terrestrial and marine environments into the atmosphere and is principally influenced by 54
meteorological factors and soil moisture availability (Srivastava et al., 2013a; Sepulcre-Canto et 55
al., 2014). As such, it is central to the hydrological cycle as well as to hugely significant 56
biogeochemical cycles (in particular carbon), and is the main pathway of the energy system by 57
which solar energy is transferred through latent heat (LE). As a result, its importance as a 58
control on regional climate characteristics (Jung et al., 2010; Srivastava et al., 2015c), agriculture 59
and regional water resources cannot be understated (Buytaert et al., 2006; Srivastava et al., 60
2013b; Srivastava et al., 2015b). 61
There is a long history of ground surface-based instrumental retrieval of ET using a number of 62
techniques, including evaporation pans, atmometers and lysimeters (for a review see 63
(Petropoulos et al., 2013). Such techniques are limited by the fact that they are often used in 64
single sites and are also unable to provide spatiotemporal estimates of ET at regional or 65
continental scales. In recent years there a number of ground monitoring networks have been 66
developed (e.g. Fluxnet) in order to integrate data collected at single sites around the world 67
(Wang and Dickinson, 2012). However, the development of regional estimates of ET remain 68
limited by the cost of instrumentation implementation and the fact that such measurements are 69
time-consuming and labour intensive. 70
The advent of Earth Observation (EO) technology has led to the development of a number of 71
modelling techniques which have been proposed to obtain spatiotemporal estimates of ET (Sun 72
et al., 2011; Gellens-Meulenberghs et al., 2012; Marshall et al., 2013; Cruz-Blanco et al., 2014; 73
Ghilain et al., 2014). Some studies of ET have also been performed on European ecosystems 74
using mesoscale model derived weather variables (Verstraeten et al., 2005; Srivastava et al., 75
2014; Srivastava et al., 2015d) as well as satellites such as MODIS (Srivastava et al., 2015a), 76
SEVIRI (Petropoulos et al., 2015a), and AVHRR (Taconet et al., 1986). In contrast to conventional 77
ground surface-based methods, these methods can provide maps of ET at varying spatial and 78
temporal resolutions and at relatively low or often no cost. Yet, before such EO-derived maps are 79
used, it is essential to undertake validation studies for a number of reasons (Jia et al., 2010; 80
Petropoulos et al., 2013), including: (i) to determine the suitability and credibility of an EO 81
algorithm or operational product before it is used for practical applications; (ii) to allow for the 82
identification, quantification and understanding of the sources of errors in algorithm 83
formulation and (iii) to direct efforts to re-evaluate and improve ET retrieval parameters and 84
algorithm structure. These reasons allow environmental managers, regulatory agencies and 85
disaster management agencies to use the product with greater confidence and also, crucially, 86
allow for climate change projections to be evaluated (Mueller et al., 2011; Kalivas et al., 2013). 87
EO technology is currently at a level of maturity which allows the development and distribution 88
of related products at operational scales. Such operational products have proven to be generally 89
Page | 3 of high demand from research groups and communities interested in modelling the carbon cycle, 90
understanding the relationships between fire regime and climate, atmospheric emissions and 91
pollution, amongst others. One such ET product currently available is provided from the 92
geostationary orbit Spinning Enhanced Visible Infra-Red Imager (SEVIRI) of the Meteostat 93
Second Generation (MSG) satellite. In this product, ET is estimated operationally every 30’ from 94
the SEVIRI radiometer, whereas a daily ET flux operational product is also generated with a lag 95
time of one day at a spatial resolution of 3.1 km at the sub-satellite point. These two products 96
are provided for the full disk divided in four sub regions (Europe, North Africa, South Africa and 97
South America) through the LSA-SAF web site (see http://landsaf.meteo.pt/). Yet, to our 98
knowledge, very few validation studies have been concerned with establishing the accuracy of 99
the SEVIRI ET instantaneous operational product, particularly at a continental scale. Such 100
studies have so far been focused primarily on performing either direct comparisons against 101
corresponding in-situ measurements acquired concurrently (Hu et al., 2015; Petropoulos et al., 102
2015b), or others based on performing inter-comparison studies against other operational 103
products or model outputs (Fensholt et al., 2011; Ghilain et al., 2011). Indeed, thus far only a few 104
other validations of SEVIRI ET product have been published and these have focused on 105
evaluating the product accuracy on a continental scale (Sepulcre-Canto et al., 2014). As such, 106
there is an urgent need for more validation studies on this product. 107
In this context, the aim of this study has been to evaluate the accuracy of the SEVIRI ET 108
operational product at a range of European ecosystems for 2 complete years of analysis. This is 109
achieved through examining the agreement between these estimates and rates of ET measured 110
at a range of CarboEurope flux tower sites with respect to (i) different land-use and land cover 111
types commonly found in Europe; (ii) seasonality and (iii) experimental site(s) heterogeneity as 112
expressed by the Fractional Vegetation Cover (FVC). 113 114 2. EXPERIMENTAL SET UP 115 2.1 Datasets 116 2.1.1 MSG-2 SEVIRI ET Estimates 117
A series of operational products from SEVIRI are provided by EUMETSAT at no cost, distributed 118
by the Satellite Application Facility (SAF) on Land Surface Analysis (LSA) 119
(http://landsaf.meteo.pt/). For the purposes of the study, the SEVIRI instantaneous ET product 120
(MET) was acquired for the Euro region of the Meteosat disk. The method developed by LSA-SAF 121
allows estimation of both the instantaneous and daily total ET by the MSG SEVIRI radiometer. It 122
follows a physically-based approach and can be described as a simplified SVAT model modified 123
to accept EO data combined with data from other sources as forcing. The SVAT model employed 124
is essentially a simplified version of the SVAT model TESSEL (Tiled ECMWF Surface Scheme for 125
Exchange Processes over Land; (Viterbo and Beljaars, 1995), which computes land surface 126
processes taking both EO and atmospheric parameters as inputs. The algorithm is then adapted 127
to accept real-time data from meteorological satellites as forcing (Gellens-Meulenberghs et al., 128
2007). The main forcing to the model comes from the remote sensing inputs including the daily 129
albedo (Geiger et al., 2008a) and half-hourly short-wave (Geiger et al., 2008b) and long-wave 130
fluxes (Ineichen et al., 2009). To provide ET with a limited amount of missing values, a gap filling 131
procedure is also adopted in the operational algorithm. The daily ET operational product is 132
derived by temporal integration of instantaneous ET operational product values. The integration 133
Page | 4 limits correspond to the first (theoretically at 00:30 UTC) and last (theoretically at 24:00 UTC) 134
existing slots for a given day, and the integration step is 30’. A detailed description of the SEVIRI 135
operational ET estimation algorithm is available in Ghilain et al., (2011). The retrieval accuracy 136
of ET is generally claimed to be 25% if ET is greater than 0.4 mm h-1 and 0.1 mm h-1 in any other
137
case (Ghilain et al., 2011). The MET product contains instantaneous values of ET (in mm h-1) plus
138
an associated quality flag (MSG-2 ET Product ATBD, 2008). 139
In addition, the SEVIRI FVC product was also acquired to facilitate the analysis of site 140
heterogeneity on ET retrieval accuracy. This product is generated daily at the full spatial 141
resolution of the MSG/SEVIRI instrument (3 km). It is computed using three short-wave 142
channels as inputs (VIS 0.6µm, NIR 0.8µm, SWIR 1.6µm) and a parametric Bi-directional 143
Reflectance Distribution Function (BRDF) model. In the product, FVC is delivered daily and is 144
expressed as percentage corrected from uncertainty derived of the view/sun angles and also the 145
anisotropy effects of surface reflectance in the SEVIRI image. The FVC product includes routine 146
quality check and error estimates. For each day and geographical region, the FVC product, its 147
error estimate and the processing flag were acquired in Hierarchical Data Format (HDF5) and 148
HDF5 file attributes. In our study, the SEVIRI FVC product was downloaded for the Euro region 149
of the Meteosat disk for both 2010 and 2011. All SEVIRI data was obtained free of charge 150
through the LSA-SAF web site (see http://landsaf.meteo.pt/). 151
152 153
2.1.2 Study Sites: In-situ ET Measurements 154
In-situ ET measurements for a total of 7 flux experimental sites of the CarboEurope network 155
(Baldocchi, 2003) were utilised in this study. CarboEurope is part of FLUXNET, the largest global 156
"network of regional networks" to coordinate regional and global analysis of 157
micrometeorological fluxes and ancillary parameters. The flux tower sites of the individual 158
networks utilise the same eddy covariance method to measure the exchanges of carbon dioxide 159
(CO2), water vapour, and energy between terrestrial ecosystems and the atmosphere to a good
160
level of standardisation. This enables uniform measurement comparisons between sites and 161
datasets. ET is measured as a core parameter at half-hourly intervals using the eddy covariance 162
system. In our study, in-situ data for the complete years 2010 and 2011 were acquired from 7 163
CarboEurope sites of varying environmental and ecosystem conditions. These sites included 5 164
situated within a Mediterranean environment (Spain and Italy) and 2 others located in 165
temperate climate zones (France and UK), representative of open shrubland, grassland, 166
evergreen needle-leaf forest and cropland land cover types. In this study sites were only selected 167
where continuous long term datasets are available for use. Further, during the selection of sites 168
weather conditions are also a deciding factor when using the Visible/Infrared satellite 169
measurements. Sometime data are available but due to cloudy conditions either there is high 170
noise in the datasets or not available at all over the installed Fluxnet sites. Other important 171
factors during the selection of sites are homogeneity in the land cover type. To avoid any mixed 172
pixel effects on the overall performance, satellite pixels are chosen over the Fluxnet tower 173
having the large homogenous land cover. In addition, the sites proposed are a complementary 174
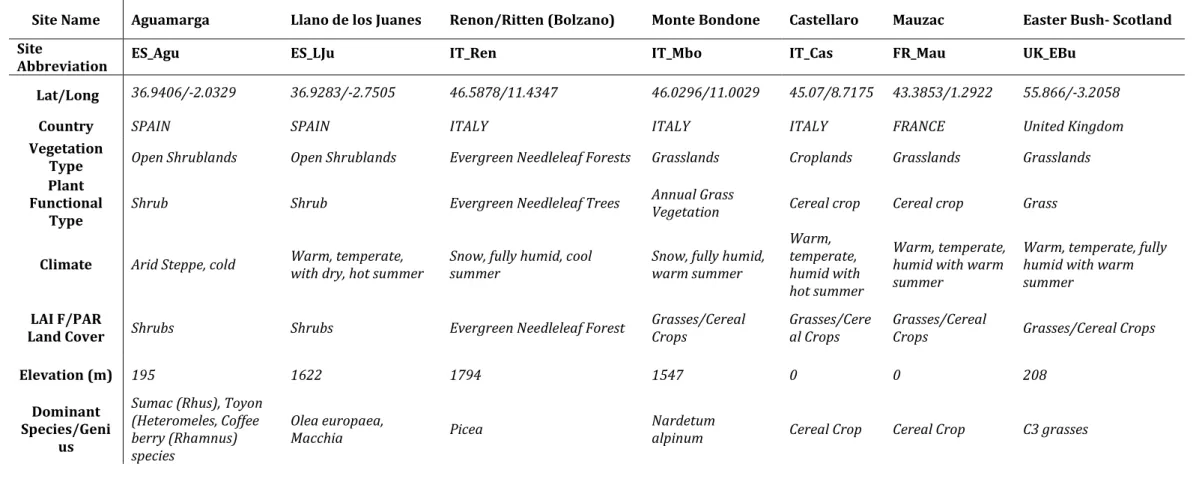
selection compared to other validation studies of the same product.Site names and their main 175
characteristics are listed in Table 1. All in-situ data were obtained from the CarboEurope 176
website (http://gaia.agraria.unitus.it/) and where possible, verified by the site manager. 177
178
2.2 Methods 179
Page | 5 The acquired ET product images were re-projected from Normalized Geostationary Projection 180
(NGP) to a regular latitude/longitude grid and tailored from the full disk image to the study 181
region (34º-45ºN, 11ºW-5ºE). Each image was subsequently clipped into the separate European 182
countries in which our experimental sites were located. Periods for which more than 10 % of 183
each of the half-hour SEVIRI estimated ET (granules) was missing from a “site-day” were 184
omitted from the comparisons. The data were further refined by excluding granules with 185
negative values from the dataset. These values corresponded to flags or no-data values which 186
were inappropriate for use in assessing the agreement between both datasets. In addition, a 187
scaling factor was applied to each MET 30’ product to derive the actual ET value (MSG-2 ET 188
Product ATBD, 2008). Subsequently, the pre-processed in-situ ET values that corresponded to 189
the date/time of the satellite overpass were extracted (Excel MacroVBA), and assigned to point 190
shapefiles of the test sites, where there was one shapefile per country (tabular join in ArcMap 191
10.1). These shapefiles were overlain on the pre-processed SEVIRI images in the BEAM VISAT + 192
SMOS toolbox. Using the BEAM correlation tool, the in-situ ET was matched against the SEVIRI 193
ET of the pixel containing the site point. These pixels were then extracted to Microsoft Excel for 194
further analysis and comparisons against the in-situ data. 195
196
2.3 Statistical Analysis 197
Agreement between the ET SEVIRI predictions and the corresponding in-situ data was evaluated 198
based on direct point by point comparisons. Several statistical performance assessment metrics 199
were used to evaluate the agreement between the compared datasets. These included the Root 200
Mean Square Difference (RMSD), the Pearson’s Correlation Coefficient (r) (including the Slope 201
and Intercept of the regression equation), the Mean Bias Error (MBE) or Bias (in-situ minus 202
estimated), and the Mean Standard Deviation (MSD) or Scatter. A robust regression was 203
computed using iterative re-weighted least squares (Street et al., 1988), which is influenced less 204
by outliers than the ordinary least-squares fit (Entekhabi et al., 2010). These statistical metrics 205
have been prominently used in analogous validation experiments of relevant operational 206
products validation studies (e.g. LSA-SAF Validation Report Evapotranspiration Products, 2010). 207
Additional analyses were performed exploring the agreement between the satellite-derived and 208
in-situ ET as a function of land cover type, seasonality and surface heterogeneity (expressed as 209
FVC percentage derived from the SEVIRI FVC product). For the analysis by land cover type, 210
agreement was evaluated for 7 sites inclusive of 4 different land cover types: ES_Agu and ES_Lju 211
– open shrubland, IT_Ren – Evergreen Needle-Leaf Forest, IT_Mbo and UK_Ebu – grasslands, 212
IT_Cas and FR_Mau – croplands. Similarly, agreement was also evaluated for the 4 seasons, 213
spring (Mar-May), summer (Jun-Aug), autumn (Sep-Nov) and winter (Dec-Feb), and analysed 214
separately for FVC ranges with different percentage coverage thresholds: 0-24, 25-49, 50-74 and 215
75-100. Direct point-by-point comparisons were performed at every in-situ station to evaluate 216
the statistical agreement for each threshold. Analysis was performed for each scenario 217
independently for both 2010 and 2011, and also for both years combined into a single dataset. 218
219
3. RESULTS 220
This study has been concerned with the verification of the operational retrieval of satellite-221
derived ET estimates from the MSG SEVIRI sensor. Table 2 illustrates the key results from the 222
comparison between the satellite-derived ET estimates and the corresponding in-situ observed 223
for all days of analysis per experimental site. In Figure 1, examples of spatial maps of ET derived 224
from the SEVIRI operational product on the 6th of August 2011 for Spain at two different times of
225
day are shown (7a.m. UTC/11a.m. UTC). A qualitative comparison of the spatial distribution of 226
Page | 6 ET in comparison to the FVC indicates a good agreement in the spatial patterns between both 227
the SEVIRI FVC and MET products, highlighting a key link between ET spatial distribution and 228
other biophysical parameters. It can be observed from Figure 1 that the areas of maximum ET 229
estimation (which range between 0.093 and 0.523 mm h-1 dependent on time of day) can be seen
230
in northern Spain, which clearly correspond to the areas of maximum FVC (up to 100%) for the 231
same date (FVC is provided as a daily product). The larger area to the south and south east 232
exhibited low to very low (near zero) ET, which again correlate with areas of low FVC. There is 233
also a clear trend in the dynamic rates of ET at different times throughout the day, underlining 234
the capability of the operational product to capture the temporal variability of ET. ET rates are at 235
their lowest point during the early morning, increasing to their maximum at midday and then 236
decreasing yet again in the early afternoon, showing a positive correlation with amount of 237
incoming solar radiation at the surface. 238
Despite the variability in accuracy found in different land covers, seasons and using different 239
FVC thresholds (sections 3.1, 3.2, 3.3), in absolute terms, a good agreement was found between 240
the two datasets, with a correlation between the point predicted ET resulting in an r of 0.709. 241
The SEVIRI MET estimates exhibited a minor overestimation of the observed with a mean 242
positive bias of 0.001 mm h-1. The mean scatter of 0.065 mm h-1, although a significant increase
243
on the bias results, indicated a reliable estimation of the in-situ data by the operational product. 244
Evidently, the mean RMSD of 0.065 mm h-1 in the estimation of ET when all days were
245
considered was within the accepted accuracy range for the operational retrieval of ET (retrieval 246
within ~25% of in-situ if ET is greater than 0.4 mm h-1 (LSA-SAF, 2010; (Ghilain et al., 2011)).
247
These findings are also well-aligned to previous analogous validation studies of the SEVIRI MET 248
product (e.g. (Ghilain et al., 2011)(Petropoulos et al., 2015b). 249
3.1 Land use and land cover comparisons 250
Table 2 summarises the comparisons of predicted and observed rates of ET on the seven 251
experimental sites of varying land use and land cover in 2010 and 2011. In general, when data 252
for both years combined are plotted for the individual sites, it is clear that the grassland and 253
cropland sites (IT_Mbo/IT_Cas/Fr_Mau/UK_Ebu) exhibited the closest agreement of all land 254
cover types (r from 0.705 to 0.759). However, notably, this is not reflected in the error metrics 255
(Table 2) where both the shrubland sites (ES_Agu/ES_Lju) returned the lowest RMSD and MAE 256
of all sites, between 0.035-0.044 mm h-1 and between 0.021-0.025 mm h-1 respectively. In
257
comparison, the agreement over the grassland and cropland sites resulted in much higher error 258
ranges (UK_Ebu being the only exception). The error results are also mirrored in the bias and 259
scatter results, where the three sites of lowest RMSD (ES_Agu/ES_Lju/UK_Ebu) exhibited a 260
decrease in scatter and bias of ~50% in comparison to all other sites. Evidently, the RMSD is 261
derived predominantly from the scatter and not the bias for all sites. Interestingly, the poorest 262
performing site when both years were combined was the IT_Ren Evergreen Needleleaf Forest 263
site (RMSD of 0.093 mm h-1), suggesting that the taller and/or denser vegetation cover may have
264
detrimental implications for the operational products retrieval accuracy. 265
When sites were analysed per year, similar trends were clearly evident (Table 2). In 2010, the 266
bias is low for all land use and land cover types (< 0.030 mm h-1) and this is also the case in 2011
267
where the maximum bias is 0.024 mm h-1. The lowest errors are seen in sites with short or low
268
vegetation cover and areas which contain bare ground i.e. the shrublands of ES_Agu and ES_Lju, 269
and the grassland of UK_Ebu where the RMSD are all below 0.04 mm h-1. These sites also show
270
the lowest bias (all within 0.007 mm h-1 in 2010, with variation by site) and the lowest scatter
271
which is also less than 0.04 mm h-1. The highest correlations between predicted and observed ET
Page | 7 rates are seen in the grasslands sites of UK_Ebu and IT_Mbo (r > 0.700). These results are 273
generally mirrored in the results for 2011, with some differences. For example, although bias 274
and errors are still low, they are greater than in 2011 than in 2010 for the ES_Agu, ES_Lju and 275
UK_Ebu sites. The correlation in 2011 for IT_Mbo is lower than that recorded for 2010 at 0.706, 276
but the correlation for UK_Ebu continues to be high. In overall, when results are stratified by 277
year, trends in product accuracy dependent on land cover are clearly evident. Furthermore, 278
error for all sites is predominantly the result of scatter rather than the bias. 279
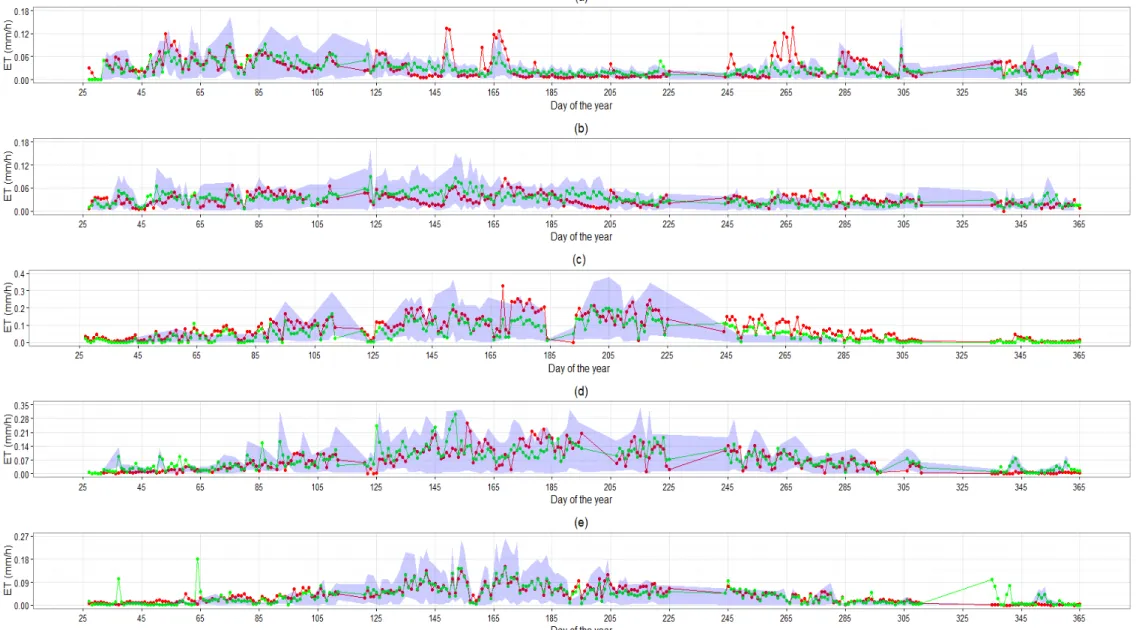
3.2 Seasonality 280
The temporal trends between in-situ and predicted ET from SEVIRI for different seasons during 281
2010 and 2011 are shown in Figure 2a-b for few selected sites. In general, comparisons 282
between the in-situ and SEVIRI ET time series exhibit a high temporal variability with seasons 283
and depicting a strong seasonal cycle. Generally, ET values are highly responsive with the 284
seasonality indicated by marked fluctuations over the entire period with rapid and sharp 285
responses, even to small changes in weather. The pattern shows that months from June-August 286
(summer) are drier with ET values peaking during these months. Further, ET started to decrease 287
during the autumn (September to November) with its lowest values during December to 288
February (winter). Rising temperatures in Europe from spring to summer are reflected in a 289
gradual rise in ET during this period. From the results summarised in those figures it is evident 290
that in summer, typically, very high ET values were found, while during the winters a decline in 291
ET values are recorded. Increasing temperatures and high evaporation through the summer 292
period lead to a progressive drying of the soil and therefore decreasing ET values. Some dips in 293
the ET values during the summer can be attributed to some short-duration storms. Generally 294
winter is the relatively wettest period during the analysis, because of occurrence of some 295
precipitation events, further solar radiation and temperature are also low during the winters 296
leading to decreases in ET rates during winter months. 297
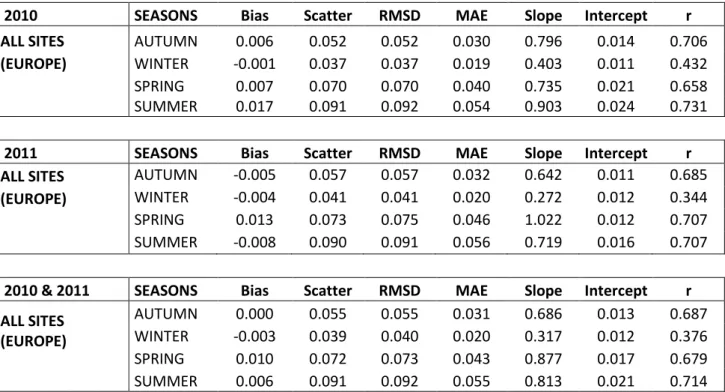
Table 3 summarises the comparisons between winter, spring, summer and autumn ET rates for 298
all sites together in 2010 and 2011. Figure 3 shows the agreement between predicted and 299
observed ET rates for the different seasons separately for 2011 and 2012. In common with the 300
results for land cover and land use type, the bias is very low (all within 0.020 mm h-1), as are the
301
scatter and RMSD (all less than 0.100 mm h-1). RMSD seems to be at its highest in spring and
302
summer. The main pattern that can be seen in these results is that the correlation between 303
predicted and observed rates of evaporation seems to be strongest during the summer and 304
autumn. This is the case when both years are taken together, and when the two years are taken 305
apart (e.g. the correlation coefficient is 0.714 and 0.687 in summer and autumn respectively 306
when both years are taken together, 0.731 and 0.706, respectively in 2010 and 0.707 and 0.685, 307
respectively in 2011). The weakest correlations are seen in winter, in 2010 and 2011 and when 308
both years are taken together. The correlation patterns which are observed are strengthening of 309
the correlation as the year progresses from winter through spring, summer and on to autumn, 310
possibly reflecting the increasing areal extent of homogenous vegetation cover from winter to 311
spring and summer, and a slight loss as that vegetation cover begins to be lost during the 312
autumn. Interestingly, the error statistics, in contrast to the correlation results, exhibit the 313
adverse trend, with highest RMSD and MAD prevalent during the spring and summer months for 314
both years separately and also for the 2 years combined. Similarly to the land cover results, 315
error was predominantly the result of high scatter and not the bias prediction. 316
317
3.3 Fractional Vegetation Cover 318
Page | 8 Table 4 shows the comparison of ET rate statistics for all sites in 2010 and 2011 with four 319
different thresholds of FVC (0-0.24/0.25-0.49/0.50-0.74/0.75-1) ranging from 0 to 1, and Table 320
5 summarises these data for both years combined an for all experimental sites. Also Figure 4 321
shows the agreement between the predicted ET and in-situ for different FVC ranges. By 322
investigating the agreement between the two datasets within varying FVC thresholds, is possible 323
to analyse the influence of site or land cover homogeneity on the accuracy of the ET operational 324
product retrieval. When data for all sites and years were combined, bias was once again low for 325
all FVC thresholds (all thresholds within 0.020 mm h-1). Scatter and RMSD results (Table 5)
326
were low for 3 out of the 4 bands when both years of data were combined, <0.67 mm h-1 and
327
<0.69 mm h-1 for scatter and RMSD respectively, with the 0.50-0.74 FVC threshold being the only
328
exception, resulting in high scatter and RMSD above 0.1 mm h-1. Although both the 0.25-0.49 and
329
0.75-1 thresholds exhibited lower error in comparison to the 0.50-0.74 threshold, they were still 330
markedly higher compared to the RMSD for the lowest FVC threshold (0-0.24) (0.042 mm h-1).
331
Overall, the error statistics results ) suggested a positive trend between RMSD and FVC 332
percentage i.e. as FVC increases the RMSD also increases in correlation. 333
The correlation between predicted and observed rates shows a generally strengthening trend 334
moving from the low FVC thresholds to the highest (Figure 4). For example, in 2011 the 335
correlation coefficient increased from 0.430 in the 0-0.24 band to 0.674 in the 0.25-0.49 band to 336
0.690 in the 0.50-0.74 band and to 0.771 in the 0.75-1 band. This pattern was mirrored when 337
both years were taken together. The only outlier to this pattern was a weaker correlation in the 338
0.25-0.49 band in 2010 than was observed in the 0-0.25 band. This increase in correlation could 339
again be related to the increasing homogeneity of the land cover as FVC increases, thus 340
decreasing the spatial variability in land cover and ET rates. 341
More variability is apparent, however, when the sites are treated separately (Table 4). At sites 342
where there is more than one FVC threshold (ES_Agu/IT_Ren/IT_Mbo/UK_Ebu) the pattern is 343
less clear. At ES_Agu, the correlation strengthens as FVC increases in 2010, but decreases in 344
2011. At IT_Ren, a steady increase in the correlation coefficient is seen in 2010, but a decrease is 345
seen between the 0.5-0.74 and the 0.75-1 FVC thresholds in 2011. At UK_Ebu, the correlation 346
strengthens in 2011, but weakens between the 0.5-0.74 and the 0.75-1 FVC thresholds in 2011. 347
At IT_Mbo an increase in the correlation coefficient is seen in both years. Mirroring the results 348
seen for the land use and land cover analysis, the strongest correlations (generally greater than 349
0.75) are seen in the Grassland/Cereal Crops of IT_Mbo, UK_Ebu and FR_Mau, where the 350
homogeneity of vegetation species, extent and crown elevation is greater and thus where the 351
rates of ET are more uniform. 352
353
4. DISCUSSION 354
This study represents a systematic and robust evaluation of the SEVIRI ET operational product 355
at selected ecosystems in Europe for the period of 2010-2011. The effect of varying land cover, 356
landscape homogeneity (percentage of FVC) and seasonality on the accuracy of the ET retrieval 357
algorithm is analysed, allowing a more robust and comprehensive evaluation of the performance 358
of the operational product. Overall, findings of the study were similar to previous validations of 359
the SEVIRI ET product (e.g.Ghilain et al., 2011; Gellens-Meulenberghs et al., 2012; Petropoulos et 360
al., 2015b. The agreement between the ET predicted from SEVIRI and the CarboEurope in-situ 361
measurement returned a high correlation coefficient (r – 0.709), highlighting a strong linear 362
relationship between the two datasets and suggesting that the satellite product showed good 363
Page | 9 ability to estimate actual ET measurements. The low error metrics represented by an RMSD and 364
MAE of 0.065 mm h-1 and 0.037 mm h-1 respectively, indicated that the results of the study met
365
the quality criterion adopted to assess the quality of the results as suggested by the EUMETSAT 366
operational product development team. These criterion were the following: error within 25% of 367
the in-situ if ET is greater than 0.4 mm h-1 and error within 0.1 mm h-1 of the in-situ if ET is less
368
0.4 mm h-1 (Ghilain et al., 2011). These results underline the potential applicability of the SEVIRI
369
MET product for operational implementation over Europe. 370
When results were stratified by land cover type, a clear inter-site variability in retrieval accuracy 371
was evident. The open shrubland site of ES_Agu, Spain returned the lowest error of all sites 372
(RMSD of 0.035 mm h-1) with ES_Lju also performing well (RMSD of 0.044 mm h-1). The SEVIRI
373
MET product was able to reliably estimate ET rates over the open shrubland land cover types, 374
particularly in the Mediterranean region. This could be due to a more consistent land cover 375
extent and type throughout the year, compared to the varying nature of cropland, for example. 376
Furthermore, the performance degradation at ES_Agu between 2010 and 2011 might be due to a 377
change of input data characteristics of the operational product, particularly from the ECMWF 378
forecasts of superficial soil moisture (change of parameterization, with a new operational cycle 379
end of 2010), in the implementation of the ET algorithm. The highest error (RMSD of 0.1 mm h-1)
380
bias (0.028 mm h-1) and scatter (0.096 mm h-1) were seen for the cropland site of IT_Cas in Italy,
381
with the other cropland site of FR_Mau in France exhibiting similar high error statistics. This 382
may be due to sub-annual, temporal changes in land use and/or land cover depending on the 383
growing season and different agricultural practices that reduce the type and height of 384
vegetation. The high error, scatter and bias at IT_Mbo, and high error at IT_Ren, Italy are more 385
difficult to explain given that they are grassland and evergreen forests sites, respectively, and 386
would not be subject to as many changes, especially in terms of agricultural practices. A possible 387
reason for this would be the more frequent occurrence of seasonal snow cover at these sites, 388
leading to a greater annual variability in land surface characteristics than suggested by 389
vegetation type alone. In fact, the IT_MBo and IT_Ren are both situated in a mountainous 390
environment where there is a lot of uncertainty potentially introduced to the ET retrievals due 391
to fragmentation of landscape between forests and alpine pastures, and as discussed, due to 392
snow cover. This can lead to uncertainty in the remote sensing signal and in the accuracy of the 393
numerical weather forecasts used as input in such regions, resulting to a significant impact on 394
the remotely sensed ET retrievals. 395
Previous examinations of the performance of the SEVIRI MET algorithm over different land 396
cover types in Europe have also returned comparable results and observations to those reported 397
in this study. Ghilain et al., (2012) performed a validation of the SEVIRI MET product through 398
direct comparisons with in-situ data over four land cover types in Europe. Both the grassland 399
and evergreen forest sites returned high errors comparable to this study. Similarly, Ghilain et al., 400
(2011) evaluated the performance of the operational products algorithm over six European 401
sites. The algorithm again performed poorly over grassland sites (RMSD ranging between 0.07 402
to 1 mm h-1). More recently, Petropoulos et al., (2015b),evaluated the SEVIRI ET estimates
403
against in-situ data for 9 sites form the CarboEurope network. A clear correlation was also 404
evident between the performance of the algorithm dependent on land cover type between the 405
result presented herein and those of Petropoulos et al., (2015b), with open shrubland (0.049 406
mm h-1) sites outperforming the grassland (RMSD of 0.072 mm h-1) and evergreen forest sites
407
(RMSD of 0.152 mm h-1). Notably, all authors reported an overestimation of the in-situ data by
408
the MET product in a significant majority of the comparisons, which is something also found in 409
this study. 410
Page | 10 Although the results presented herein underline the significant potential of the SEVIRI ET 411
operational product for the accurate estimation of ET, a number of possible sources of error for 412
the satellite-based daily ET estimates and limitations on the flux tower measurements exist. In 413
this study, the satellite data are assumed to represent the average of a grid cell corresponding to 414
the station fetch used for validation. This assumption can be problematic, as a large spatial 415
discrepancy exists between the coarser satellite-based ET retrievals (3 km spatial resolution), 416
and the flux tower measurements (a fetch in the order of meters). In sites of diverse land cover 417
conditions (fragmented, different vegetation types, areas of bare soil), different ET values are 418
prevalent at different spatial scales. Thus if a remotely sensed footprint includes heterogeneous 419
and/or rough terrain, eddy formation can be highly variable and may not be consistent with that 420
of the flux tower fetch (Marshall et al., 2013). Furthermore, since the majority of flux towers are 421
located in close proximity to vegetated areas, they tend to give higher ET measurements than 422
the spatially averaged satellite values, particularly so in more fragmented landscapes (Sun et al., 423
2012).This discrepancy was evident when analysing the correlation between the satellite 424
estimates and the in-situ data in the study herein, where a positive correlation was exhibited 425
between the percentage of FVC and R. These results suggest that the higher the FVC (i.e. the 426
more homogenous the site), the more representative the ET point measurements were of the 427
SEVIRI MET pixel. A possible solution to overcome the issue of spatial discrepancy and 428
representativeness between the datasets would be to evaluate the satellite-based estimates 429
using several flux towers within a satellite grid cell/footprint, each tower representing the 430
various land cover types and taking a weighted average to compare to the coarser remotely 431
sensed estimate (Marshall et al., 2013). Limitations are also evident concerning the “ground 432
truth” data used to validate the operational product. Measured surface-atmosphere fluxes of 433
energy (H and LE) and CO2 by the eddy covariance method represents the ‘‘true’’ flux plus or
434
minus potential random and systematic measurement errors (Wilson et al., 2002; Petropoulos et 435
al., 2013). Generally, the verification or validation of fluxes by the eddy covariance utilises the 436
energy balance closure (EBC) approach. A lack of EBC with the eddy correlation technique, as 437
used in FLUXNET, has been shown to lead to uncertainty on fluxes measurement up to ~20%, 438
which could potentially be translated to a lack of accuracy when compared against satellite 439
retrievals (Falge et al., 2002; Wilson et al., 2002) . EBC may also ignore any biases in the half-440
hourly data, where for example, there is trend for the eddy covariance system to overestimate 441
positive fluxes during the daytime and underestimate negative fluxes at night (Mahrt, 1998). 442
443
5. CONCLUSIONS 444
The aim of this study was to perform an extensive and systematic evaluation of the operationally 445
distributed SEVIRI evapotranspiration (ET) product at 7 selected European sites belonging to 446
the CarboEurope ground monitoring network, representative of a variety of land cover 447
characteristics. To our knowledge, our study is one of the few published so far that provides 448
such a comprehensive evaluation of this operational product, looking at evaluating the product 449
accuracy from different perspectives. 450
Overall, the point by point comparisons between the satellite and in-situ ET for the combined 451
dataset of all days of analysis resulted in a close agreement (r of 0.709) and a low error exhibited 452
by the model (RMSD of 0.065 mm h-1). Those findings were comparable to similar validation
453
studies. A clear inter-site variability in retrieval accuracy was evident when results were 454
stratified by land cover type. With regards to the seasonal differences in SEVIRI MET retrieval 455
performance, RMSD was at its highest in spring and summer, whereas the correlations between 456
Page | 11 predicted and observed rates of evaporation were strongest during the summer and autumn. 457
Results suggest that the higher the FVC (i.e. the more homogenous the site), the more 458
representative the ET point measurements were of the SEVIRI MET pixel, overcoming issues 459
related to spatial discrepancy between the datasets. 460
An update of the algorithm (version 2) is foreseen to release the ET products in 2016, with an 461
expected improvement of the quality and the stability over dry areas thanks to the assimilation 462
of more SEVIRI products, like land surface temperature and vegetation related characteristics . 463
Studies such as this are important steps in the validation of operational satellite products and 464
are vital for the future development of SEVIRI’s operational capacity on a global scale. The 465
identification of strengths and weaknesses of the current operational products by means of such 466
studies is a driver of new capabilities developments. 467
Acknowledgments 468
Implementation of this work has been supported by the FP7-People project TRANSFORM-EO 469
(project reference number 334533) as well as the High Performance Computing Facilities of 470
Wales (HPCW) project PREMIER-EO. Dr Petropoulos as the PI of both project wishes to thank 471
both funding bodies for supporting the implementation of this research study. Authors are also 472
grateful to the CarboEurope site managers and to the SEVIRI LSA-SAF team for the provision of 473
the data used in this study. Finally authors wish to thank the reviewers for their valuable 474
comments which helped improving the manuscript. 475
476
References: 477
Baldocchi, D.D., 2003. Assessing the eddy covariance technique for evaluating carbon dioxide 478
exchange rates of ecosystems: past, present and future. Global Change Biology 9, 479-492. 479
Buytaert, W., Célleri, R., De Bièvre, B., Cisneros, F., Wyseure, G., Deckers, J., Hofstede, R., 2006. 480
Human impact on the hydrology of the Andean páramos. Earth-Science Reviews 79, 53-72. 481
Cruz-Blanco, M., Lorite, I., Santos, C., 2014. An innovative remote sensing based reference 482
evapotranspiration method to support irrigation water management under semi-arid 483
conditions. Agricultural Water Management 131, 135-145. 484
Entekhabi, D., Reichle, R.H., Koster, R.D., Crow, W.T., 2010. Performance metrics for soil 485
moisture retrievals and application requirements. Journal of Hydrometeorology 11, 832-486
840. 487
Falge, E., Baldocchi, D., Tenhunen, J., Aubinet, M., Bakwin, P., Berbigier, P., Bernhofer, C., Burba, 488
G., Clement, R., Davis, K.J., 2002. Seasonality of ecosystem respiration and gross primary 489
production as derived from FLUXNET measurements. Agricultural and Forest Meteorology 490
113, 53-74. 491
Fensholt, R., Anyamba, A., Huber, S., Proud, S.R., Tucker, C.J., Small, J., Pak, E., Rasmussen, M.O., 492
Sandholt, I., Shisanya, C., 2011. Analysing the advantages of high temporal resolution 493
geostationary MSG SEVIRI data compared to Polar Operational Environmental Satellite data 494
for land surface monitoring in Africa. International Journal of Applied Earth Observation 495
and Geoinformation 13, 721-729. 496
Geiger, B., Carrer, D., Franchistéguy, L., Roujean, J.-L., Meurey, C., 2008a. Land surface albedo 497
derived on a daily basis from Meteosat second generation observations. Geoscience and 498
Remote Sensing, IEEE Transactions on 46, 3841-3856. 499
Geiger, B., Meurey, C., Lajas, D., Franchistéguy, L., Carrer, D., Roujean, J.L., 2008b. Near real-time 500
provision of downwelling shortwave radiation estimates derived from satellite 501
observations. Meteorological Applications 15, 411-420. 502
Gellens-Meulenberghs, F., Arboleda, A., Ghailain, N., 2007. Towards a continuous monitoring of 503
evapotranspiration based on MSG data. IAHS PUBLICATION 316, 228. 504
Page | 12 Gellens-Meulenberghs, F., Ghilain, N., Arboleda, A., 2012. Land surface evapotranspiration as 505
seen from Meteosat Second Generation Satellites: LSA-SAF developments and perspectives. 506
Geoscience and Remote Sensing Symposium (IGARSS), 2012 IEEE International. IEEE, pp. 507
1018-1021. 508
Ghilain, N., Arboleda, A., Gellens-Meulenberghs, F., 2011. Evapotranspiration modelling at large 509
scale using near-real time MSG SEVIRI derived data. Hydrology and Earth System Sciences 510
15, 771-786. 511
Ghilain, N., Arboleda, A., Sepulcre-Cantò, G., Batelaan, O., Ardö, J., Gellens-Meulenberghs, F., 512
2012. Improving evapotranspiration in a land surface model using biophysical variables 513
derived from MSG/SEVIRI satellite. Hydrology and Earth System Sciences 16, 2567-2583. 514
Ghilain, N., De Roo, F., Gellens-Meulenberghs, F., 2014. Evapotranspiration monitoring with 515
Meteosat Second Generation satellites: improvement opportunities from moderate spatial 516
resolution satellites for vegetation. International Journal of Remote Sensing 35, 2654-2670. 517
Hu, G., Jia, L., Menenti, M., 2015. Comparison of MOD16 and LSA-SAF MSG evapotranspiration 518
products over Europe for 2011. Remote Sensing of Environment 156, 510-526. 519
Ineichen, P., Barroso, C.S., Geiger, B., Hollmann, R., Marsouin, A., Mueller, R., 2009. Satellite 520
Application Facilities irradiance products: hourly time step comparison and validation over 521
Europe. International Journal of Remote Sensing 30, 5549-5571. 522
Ireland, G., Petropoulos, G.P., Carlson, T.N., Purdy, S., 2015. Addressing the ability of a land 523
biosphere model to predict key biophysical vegetation characterisation parameters with 524
Global Sensitivity Analysis. Environmental Modelling & Software 65, 94-107. 525
Jia, Z., Liu, S., Xu, Z., 2010. Validation of remotely sensed evapotranspiration: a case study. 526
Geoscience and Remote Sensing Symposium (IGARSS), 2010 IEEE International. IEEE, pp. 527
2119-2122. 528
Jones, J.A.A., 2014. Water sustainability: a global perspective. Routledge. 529
Jung, M., Reichstein, M., Ciais, P., Seneviratne, S.I., Sheffield, J., Goulden, M.L., Bonan, G., Cescatti, 530
A., Chen, J., De Jeu, R., 2010. Recent decline in the global land evapotranspiration trend due 531
to limited moisture supply. Nature 467, 951-954. 532
Kalivas, D., Petropoulos, G., Athanasiou, I., Kollias, V., 2013. An intercomparison of burnt area 533
estimates derived from key operational products: the Greek wildland fires of 2005–2007. 534
Nonlinear Processes in Geophysics 20, 397-409. 535
Legesse, D., Vallet-Coulomb, C., Gasse, F., 2003. Hydrological response of a catchment to climate 536
and land use changes in Tropical Africa: case study South Central Ethiopia. Journal of 537
Hydrology 275, 67-85. 538
Mahrt, L., 1998. Nocturnal boundary-layer regimes. Boundary-layer meteorology 88, 255-278. 539
Marshall, M., Tu, K., Funk, C., Michaelsen, J., Williams, P., Williams, C., Ardö, J., Boucher, M., 540
Cappelaere, B., Grandcourt, A.d., 2013. Improving operational land surface model canopy 541
evapotranspiration in Africa using a direct remote sensing approach. Hydrology and Earth 542
System Sciences 17, 1079-1091. 543
Mueller, B., Seneviratne, S., Jimenez, C., Corti, T., Hirschi, M., Balsamo, G., Ciais, P., Dirmeyer, P., 544
Fisher, J., Guo, Z., 2011. Evaluation of global observations-based evapotranspiration datasets 545
and IPCC AR4 simulations. Geophysical research letters 38. 546
Petropoulos, G., Ireland, G., Cass, A., Srivastava, P., 2015a. Performance Assessment of the 547
SEVIRI Evapotranspiration Operational Product: Results Over Diverse Mediterranean 548
Ecosystems. IEEE Sensors. DOI:10.1109/jsen.2015.2390031. 549
Petropoulos, G.P., Carlson, T.N., Griffiths, H.M., 2013. Turbulent Fluxes of Heat and Moisture at 550
the Earth’s Land Surface: Importance, Controlling Parameters, and Conventional 551
Measurement Techniques. Remote Sensing of Energy Fluxes and Soil Moisture Content, 1. 552
Petropoulos, G.P., Ireland, G., Cass, A., Srivastava, P.K., 2015b. Performance assessment of the 553
SEVIRI evapotranspiration operational product: results over diverse mediterranean 554
ecosystems. Sensors Journal, IEEE 15, 3412-3423. 555
Remesan, R., Holman, I.P., 2015. Effect of baseline meteorological data selection on 556
hydrological modelling of climate change scenarios. Journal of Hydrology 528, 631-642. 557
Page | 13 Sepulcre-Canto, G., Vogt, J., Arboleda, A., Antofie, T., 2014. Assessment of the EUMETSAT LSA-558
SAF evapotranspiration product for drought monitoring in Europe. International Journal of 559
Applied Earth Observation and Geoinformation 30, 190-202. 560
Smolders, A., Hudson-Edwards, K., Van der Velde, G., Roelofs, J., 2004. Controls on water 561
chemistry of the Pilcomayo river (Bolivia, South-America). Applied Geochemistry 19, 1745-562
1758. 563
Srinivasan, V., Thompson, S., Madhyastha, K., Penny, G., Jeremiah, K., Lele, S., 2015. Why is the 564
Arkavathy River drying? A multiple hypothesis approach in a data scarce region. Hydrology 565
and Earth System Sciences Discussions 12, 25-66. 566
Srivastava, P.K., Han, D., Islam, T., Petropoulos, G.P., Gupta, M., Dai, Q., 2015a. Seasonal 567
evaluation of evapotranspiration fluxes from MODIS satellite and mesoscale model 568
downscaled global reanalysis datasets. Theoretical and Applied Climatology. DOI: 569
10.1007/s00704-015-1430-1. 570
Srivastava, P.K., Han, D., Islam, T., Petropoulos, G.P., Gupta, M., Dai, Q., 2015b. Seasonal 571
evaluation of evapotranspiration fluxes from MODIS satellite and mesoscale model 572
downscaled global reanalysis datasets. Theoretical and Applied Climatology, 1-13. 573
Srivastava, P.K., Han, D., Ramirez, M.A., Islam, T., 2013a. Appraisal of SMOS soil moisture at a 574
catchment scale in a temperate maritime climate. Journal of Hydrology 498, 292-304. 575
Srivastava, P.K., Han, D., Ramirez, M.A., Islam, T., 2013b. Machine Learning Techniques for 576
Downscaling SMOS Satellite Soil Moisture Using MODIS Land Surface Temperature for 577
Hydrological Application. Water Resources Management 27, 3127-3144. 578
Srivastava, P.K., Han, D., Rico-Ramirez, M.A., Islam, T., 2014. Sensitivity and uncertainty 579
analysis of mesoscale model downscaled hydro-meteorological variables for discharge 580
prediction. Hydrological Processes 28, 4419-4432. 581
Srivastava, P.K., Han, D., Rico-Ramirez, M.A., O’Neill, P., Islam, T., Gupta, M., Dai, Q., 2015c. 582
Performance evaluation of WRF-Noah Land surface model estimated soil moisture for 583
hydrological application: Synergistic evaluation using SMOS retrieved soil moisture. Journal 584
of Hydrology 529, Part 1, 200-212. 585
Srivastava, P.K., Han, D., Rico Ramirez, M.A., Islam, T., 2013c. Comparative assessment of 586
evapotranspiration derived from NCEP and ECMWF global datasets through Weather 587
Research and Forecasting model. Atmospheric Science Letters 14, 118-125. 588
Srivastava, P.K., Islam, T., Gupta, M., Petropoulos, G., Dai, Q., 2015d. WRF Dynamical 589
Downscaling and Bias Correction Schemes for NCEP Estimated Hydro-Meteorological 590
Variables. Water Resources Management 29, 2267-2284. 591
Street, J.O., Carroll, R.J., Ruppert, D., 1988. A note on computing robust regression estimates via 592
iteratively reweighted least squares. The American Statistician 42, 152-154. 593
Sun, Z., Gebremichael, M., Ardö, J., De Bruin, H., 2011. Mapping daily evapotranspiration and 594
dryness index in the East African highlands using MODIS and SEVIRI data. Hydrology and 595
Earth System Sciences 15, 163-170. 596
Sun, Z., Gebremichael, M., Ardö, J., Nickless, A., Caquet, B., Merboldh, L., Kutschi, W., 2012. 597
Estimation of daily evapotranspiration over Africa using MODIS/Terra and SEVIRI/MSG 598
data. Atmospheric Research 112, 35-44. 599
Taconet, O., Bernard, R., Vidal-Madjar, D., 1986. Evapotranspiration over an agricultural region 600
using a surface flux/temperature model based on NOAA-AVHRR data. Journal of Climate and 601
Applied Meteorology 25, 284-307. 602
Verstraeten, W.W., Veroustraete, F., Feyen, J., 2005. Estimating evapotranspiration of European 603
forests from NOAA-imagery at satellite overpass time: Towards an operational processing 604
chain for integrated optical and thermal sensor data products. Remote Sensing of 605
Environment 96, 256-276. 606
Viterbo, P., Beljaars, A.C., 1995. An improved land surface parameterization scheme in the 607
ECMWF model and its validation. Journal of Climate 8, 2716-2748. 608
Wagner, P.D., Reichenau, T.G., Kumar, S., Schneider, K., 2015. Development of a new 609
downscaling method for hydrologic assessment of climate change impacts in data scarce 610
regions and its application in the Western Ghats, India. Regional Environmental Change 15, 611
435-447. 612
Page | 14 Wang, K., Dickinson, R.E., 2012. A review of global terrestrial evapotranspiration: Observation, 613
modeling, climatology, and climatic variability. Reviews of Geophysics 50. 614
Wilson, K., Goldstein, A., Falge, E., Aubinet, M., Baldocchi, D., Berbigier, P., Bernhofer, C., 615
Ceulemans, R., Dolman, H., Field, C., 2002. Energy balance closure at FLUXNET sites. 616
Agricultural and Forest Meteorology 113, 223-243. 617
618 619
List of Figures
Figure 1: Maps of the SEVIRI ET product on August 6
th, 2011 for Spain with the site ES_AGU in the zoomed area. The map in the middle is the
Figure 2a: Examples of the agreement between in-situ and predicted ET from SEVIRI for the different seasons for year 2010 for different
sites. In particular, results are shown for: (a) ES_AGU; (b) ES_LJU; (c) IT_CAS; (d) UK_EBU and (e) IT_MBO. Green represents the in-situ ET
daily mean, Red is the SEVIRI-predicted ET, Blue is daily standard deviation of the in-situ ET.
Figure 2b: Examples of the agreement between in-situ and predicted ET from SEVIRI for the different seasons for year 2011 for different sites. In
particular, results are shown for: In particular, (a): FR_MAU; (b): ES_AGU; (c):IT_MBO; (d): UK_EBU and (e): ES_LJU. Green represents the in-situ ET
daily mean, Red is the SEVIRI-predicted ET, Blue is daily standard deviation of the in-situ ET.
Figure 3a: Agreement between in-situ and predicted ET from SEVIRI for the different seasons for all sites together shown here for year 2010.
In particular, (a): autumn, (b)winter, (c): spring and (d): summer; dashed = linear regression, continuous line = locally polynomial (package
loess), dotted = y=x line.
Units of ET are in mm h
-1Figure 3b: Agreement between in-situ and predicted ET from SEVIRI for the different seasons for all sites together shown here for year 2011.
In particular, (a): autumn, (b)winter, (c): spring and (d): summer; dashed = linear regression, continuous line = locally polynomial (package
loess), dotted = y=x line.
Units of ET are in mm h
-1Figure 4a: Agreement between in-situ and predicted ET from SEVIRI for the different Fractional Vegetation Cover (FVC) ranges for all sites
together for year 2010. In particular, (a): 0-24% FVC; (b):25-49% FVC; (c): 50-74% FVC and (d): 75-100% FVC; dashed = linear regression,
continuous line = locally polynomial (package loess), dotted = y=x line.
Units of ET are in mm h
-1Figure 4b: Agreement between in-situ and predicted ET from SEVIRI for the different Fractional Vegetation Cover (FVC) ranges for all sites
together for year 2011. In particular, (a): 0-24% FVC; (b):25-49% FVC; (c): 50-74% FVC and (d): 75-100% FVC; dashed = linear regression,
continuous line = locally polynomial (package loess), dotted = y=x line.
Units of ET are in mm h
-1Table 1: Description of the selected sites for MSG SEVIRI product validation over Europe
Site Name Aguamarga Llano de los Juanes Renon/Ritten (Bolzano) Monte Bondone Castellaro Mauzac Easter Bush- Scotland
Site
Abbreviation ES_Agu ES_LJu IT_Ren IT_Mbo IT_Cas FR_Mau UK_EBu
Lat/Long 36.9406/-2.0329 36.9283/-2.7505 46.5878/11.4347 46.0296/11.0029 45.07/8.7175 43.3853/1.2922 55.866/-3.2058
Country SPAIN SPAIN ITALY ITALY ITALY FRANCE United Kingdom
Vegetation
Type Open Shrublands Open Shrublands Evergreen Needleleaf Forests Grasslands Croplands Grasslands Grasslands
Plant Functional
Type Shrub Shrub Evergreen Needleleaf Trees
Annual Grass
Vegetation Cereal crop Cereal crop Grass
Climate Arid Steppe, cold Warm, temperate, with dry, hot summer Snow, fully humid, cool summer Snow, fully humid, warm summer
Warm, temperate, humid with hot summer
Warm, temperate, humid with warm summer
Warm, temperate, fully humid with warm summer
LAI F/PAR
Land Cover Shrubs Shrubs Evergreen Needleleaf Forest Grasses/Cereal Crops Grasses/Cereal Crops Grasses/Cereal Crops Grasses/Cereal Crops
Elevation (m) 195 1622 1794 1547 0 0 208
Dominant Species/Geni
us
Sumac (Rhus), Toyon (Heteromeles, Coffee berry (Rhamnus) species
Olea europaea,
Table 2: Results from land cover type comparison between SEVIRI-predicted and in-situ ET half-hourly estimates (mm.h
-1) for the seven
selected sites over Europe in 2010, 2011, both years and a statistical summary for all sites.
Site Abbrev. ES_Agu ES_LJu IT_Ren IT_Mbo IT_Cas FR_Mau UK_EBu
Statistical Summary Statistical
parameter analysis Year of Shrubs Shrubs
Evergreen Needleleaf
Forest Cereal Crops Grasses/ Cereal Crops Grasses/ Cereal Crops Grasses/ Cereal Crops Grasses/
Bias 2010 0.003 -0.004 -0.007 0.022 0.028 0.003 0.001 2011 -0.024 -0.007 -0.016 0.013 0.012 0.020 both -0.001 -0.006 -0.012 0.017 0.012 Scatter 2010 0.035 0.032 0.091 0.078 0.096 0.039 0.065 2011 0.038 0.050 0.092 0.087 0.085 0.037 both 0.035 0.043 0.092 0.084 0.039 RMSD 2010 0.036 0.032 0.092 0.081 0.100 0.039 0.065 2011 0.045 0.051 0.093 0.088 0.086 0.042 both 0.035 0.044 0.093 0.085 0.041 MAE 2010 0.022 0.021 0.056 0.054 0.059 0.020 0.037 2011 0.030 0.057 0.054 0.058 0.047 0.023 both 0.021 0.025 0.055 0.057 0.022 Slope 2010 0.832 0.622 0.650 0.883 0.951 0.785 0.772 2011 0.466 0.823 0.558 0.785 0.941 1.346 both 0.776 0.738 0.591 0.829 0.904 Intercept 2010 0.008 0.008 0.021 0.031 0.031 0.011 0.012 2011 -0.003 -0.002 0.019 0.030 0.017 0.013 both 0.006 0.003 0.021 0.030 0.015 r 2010 0.684 0.620 0.644 0.794 0.705 0.801 0.709 2011 0.546 0.536 0.696 0.706 0.730 0.792 both 0.655 0.552 0.669 0.744 0.759
Table 3: Summary of the comparisons per season between satellite-derived and observed ET
estimates (mm.h
-1) in the validation sites for 2010, 2011 and both years.
2010 SEASONS Bias Scatter RMSD MAE Slope Intercept r
ALL SITES AUTUMN 0.006 0.052 0.052 0.030 0.796 0.014 0.706
(EUROPE) WINTER -0.001 0.037 0.037 0.019 0.403 0.011 0.432
SPRING 0.007 0.070 0.070 0.040 0.735 0.021 0.658
SUMMER 0.017 0.091 0.092 0.054 0.903 0.024 0.731
2011 SEASONS Bias Scatter RMSD MAE Slope Intercept r
ALL SITES AUTUMN -0.005 0.057 0.057 0.032 0.642 0.011 0.685
(EUROPE) WINTER -0.004 0.041 0.041 0.020 0.272 0.012 0.344
SPRING 0.013 0.073 0.075 0.046 1.022 0.012 0.707
SUMMER -0.008 0.090 0.091 0.056 0.719 0.016 0.707
2010 & 2011 SEASONS Bias Scatter RMSD MAE Slope Intercept r ALL SITES (EUROPE) AUTUMN 0.000 0.055 0.055 0.031 0.686 0.013 0.687 WINTER -0.003 0.039 0.040 0.020 0.317 0.012 0.376 SPRING 0.010 0.072 0.073 0.043 0.877 0.017 0.679 SUMMER 0.006 0.091 0.092 0.055 0.813 0.021 0.714
Table 4: Agreement between SEVIRI predicted and in-situ ET estimates (mm.h
-1) as a function of
Fractional Vegetation Cover (FVC) for the selected sites in 2010 and 2011.
Val. Sites FVC ranges Year Bias Scatter RMSD MAE Slope Intercept r ES_AGU FVC 0-0.24 2010 0.009 0.028 0.029 0.016 0.835 0.011 0.663 2011 -0.013 0.036 0.038 0.023 0.394 0.000 0.545 FVC 0.25-0.49 2010 0.007 0.035 0.036 0.022 0.824 0.013 0.771 2011 -0.011 0.038 0.039 0.021 0.278 0.007 0.428 ES_LJU FVC 0.25-0.49 2010 -0.003 0.029 0.030 0.019 0.759 0.004 0.665 2011 -0.006 0.047 0.048 0.025 0.822 -0.002 0.535 IT_REN FVC 0.25-0.49 2010 0.000 0.082 0.082 0.055 0.520 0.034 0.540 2011 0.009 0.072 0.073 0.043 0.790 0.019 0.620 FVC 0.5-0.74 2010 0.001 0.108 0.108 0.071 0.642 0.034 0.581 2011 -0.037 0.108 0.114 0.072 0.512 0.020 0.707 FVC 0.75-1 2010 -0.004 0.109 0.109 0.072 0.629 0.040 0.686 2011 -0.008 0.084 0.084 0.056 0.912 -0.002 0.677 IT_MBO FVC 0.25-0.49 2010 0.043 0.081 0.092 0.117 1.115 0.040 0.487 2011 0.025 0.066 0.070 0.044 1.058 0.022 0.680 FVC 0.5-0.74 2010 0.008 0.084 0.084 0.060 0.905 0.021 0.833 2011 0.000 0.106 0.106 0.078 0.745 0.033 0.692 UK_EBU FVC 0.25-0.49 2010 0.000 0.033 0.033 0.019 0.838 0.007 0.818 2011 0.022 0.037 0.043 0.024 1.454 0.025 0.645 FVC 0.5-0.74 2010 0.005 0.033 0.034 0.022 1.030 0.003 0.910 2011 0.015 0.036 0.039 0.025 1.021 0.014 0.787 FVC 0.75-1 2010 -0.001 0.036 0.036 0.023 0.859 0.008 0.890 2011 0.038 0.052 0.064 0.042 1.470 0.021 0.795 IT_CAS (2010) FVC 0.25-0.49 2010 0.024 0.074 0.077 0.045 0.884 0.028 0.632 FVC 0.5-0.74 2010 0.035 0.117 0.122 0.079 0.919 0.043 0.683 FR_MAU (2011) FVC 0.25-0.49 2011 0.010 0.079 0.079 0.043 0.914 0.016 0.727 FVC 0.5-0.74 2011 0.024 0.101 0.104 0.063 1.029 0.021 0.755
Table 5: Summary of the agreement between SEVIRI predicted and in-situ ET estimates (mm.h
-1)
as a function of Fractional Vegetation Cover (FVC) in 2010 and 2011.
Val. Sites FVC ranges Year Bias Scatter RMSD MAE Slope Intercept R ALL SITES (EUROPE) FVC 0-0.24 2010 0.009 0.028 0.029 0.016 0.835 0.011 0.663 2011 -0.008 0.044 0.044 0.026 0.445 0.004 0.430 Both -0.005 0.042 0.042 0.024 0.470 0.006 0.445 FVC 0.25-0.49 2010 0.011 0.056 0.057 0.032 0.813 0.017 0.611 2011 0.003 0.064 0.064 0.036 0.910 0.007 0.674 Both 0.005 0.061 0.061 0.034 0.882 0.010 0.658 FVC 0.5-0.74 2010 0.018 0.106 0.108 0.071 0.845 0.034 0.705 2011 -0.005 0.103 0.103 0.066 0.694 0.029 0.690 Both 0.006 0.105 0.105 0.068 0.757 0.032 0.692 FVC 0.75-1 2010 -0.002 0.071 0.071 0.041 0.723 0.021 0.773 2011 0.036 0.054 0.065 0.042 1.373 0.023 0.771 Both 0.014 0.067 0.069 0.041 0.753 0.030 0.735