Original article
Trends in cancer incidence and mortality in Vaud, Switzerland, 1974—1993
F. Levi,
1V. C. Te,
1L. Randimbison^ C. La Vecchia
23'Registre vaudois des tumeurs, Institut universitaire de medecine sociale et preventive, CHUV, Lausanne, Switzerland; 2 Istituto di Ricerche
Farmacologiche 'Mario Negri'; 3Istituto di Statistica Medica e Biometria, Universitd di Milano, Milan, Italy
Summary
Background: Comparing incidence of and mortality from
cancer within a given population yields several benefits. One of these is the opportunity, when trends in incidence differ from those in mortality, to derive inferences about the poten-tial role of improved diagnosis in the rise of incidence rates, and about therapeutic advancements in reducing mortality.
Materials and methods: Trends in incidence of and
mor-tality from various cancers or groups of cancers (comprising 55,682 new malignant tumours and 26,528 certified cancer deaths) over the period 1974-1993 were compared using, respectively, data from the Cancer Registry of the Swiss Can-ton of Vaud (with about 600,000 inhabitants) and those pro-vided by the Swiss Federal Statistical Office.
Results: The overall cancer incidence increased by 10% to
30% in both sexes and various age groups, whereas mortality
remained approximately the same. The sites primarily re-sponsible for these divergent trends were breast, prostate and colorectal, three sites where cancers have been less frequent-ly diagnosed since the advent of certain technical advance-ments and the introduction of screening. Other contributors to the divergent trends were testicular cancer, Hodgkin's dis-ease and leukaemias, i.e., the sites for which the most sub-stantial therapeutic advancements have been achieved.
Conclusions: These data are fairly reassuring, since they
are inconsistent with an ongoing cancer epidemic in this European population. However, they are also incompatible with the presence of major advancements in the prevention and treatment of cancer.
Key words: cancer, epidemiology, incidence, mortality, regis-try, time trends
Introduction
There are several reasons to compare incidence of and mortality from cancer in the same well-defined popula-tion. When trends in incidence differ from those in mortality, in fact, it is possible to infer the probable role of improved diagnosis in increasing incidence rates, and the one of therapeutic advancement in reducing mortality [1-12].
Similar comparisons, however, are possible in only a few populations. One of these is that of the Swiss Can-ton of Vaud, a particularly favourable environment for monitoring incidence, where a cancer registry has been in operation since 1972, and has employed an integrat-ed and homogeneous scheme for cancer registration, follow-up and death certification [3,13,14]. This paper systematically reviews trends in cancer incidence and mortality for major sites in this population of about 600,000 inhabitants.
Materials and methods
Since 1972, the Vaud Cancer Registry has been collecting data con-cerning incidence, mortality and survival with respect to malignant neoplasms in the population of the Canton. The registration scheme was successively implemented during the Registry's first few years. Thus, reliable data have been available since the mid-1970s, and
have been sequentially published in Cancer Incidence in Five Con-tinents since Volume IV [14-16].
Information routinely collected includes sociodemographic characteristics, primary site and histological type of the tumours according to the International Classification of Diseases (ICD) for Oncology [17] and rime of diagnostic confirmation. Passive and active follow-up are undertaken, and each subsequent item of infor-mation is used to complete the individual records [18]. Inforinfor-mation from death certificates is routinely integrated in the data file; cases known only through death certificate amount to fewer than 5% of the average number of cases registered per year. Overall histological confirmation exceeds 90%. The registry is tumour-based and multi-ple primaries occurring in one person are entered separately.
Death certification numbers by cause and estimates of the resi-dent population, stratified by sex and quinquennia of age, were abstracted from files provided by the Swiss Federal Statistical Office. All certified deaths from cancer (ICD-8th Revision; 140-207) were grouped in 32 categories, aside from total cancer mortal-ity and a broad group including 'other and unspecified'. In particular, we grouped together all colorectal sites, all malignant neoplasms of brain and nerves, and all leukaemias and non-Hodgkin's lymphc-mas. To facilitate comparisons, the same classification and grouping were adopted for incidence and mortality data.
The present series comprises all new malignant tumours (29,131 in males, 26,551 in females) registered and all deaths (15,082 in males, 11,446 in females) certified from 1974 to 1993 in the resident population of the Canton. Incidence and mortality rates were grouped into two five-year periods, from 1974-1978 to 1989-1993, to reduce random variation.
All age and 35- to 64-year age-standardized rates (based on the standard world population [19]), were chosen for presentation to provide summary statistics, and also because of random variations in age- and cohort-specific rates.
Results and comments
Trends in overall- and 35-64-year age-standardized
(based on the world population) incidence and
mortal-ity from major cancers or groups of cancers in the two
sexes are considered in the text. Age-standardized
inci-dence and mortality rates per 100,000 population in
the two extreme 5-year calendar periods, and the
corresponding percent changes are given in Table 1 for
males and Table 2, for females. Corresponding data for
mortality are given in Tables 3 and 4.
Digestive sites. There were substantial increases in oral
and pharyngeal cancer incidence for young and
middle-aged (35-64 years) males (from 41.2 in
1979-1983 to 52.8/100,000 in 1989-1993) and females
(from 9.1 to 13.3/100,000) over the past two decades,
which were partially, although not totally, reflected in
mortality rates. In contrast, a greater decline was
ob-served in oesophageal cancer mortality rates among
young males (from 15.0 in 1979-1983 to 11.1/100,000
in 1989-1993) as compared to incidence (from 18.1 in
1979-1983 to 16.6/100,000 in 1989-1993).
Inci-dence and mortality from stomach cancer declined in
both sexes and various age groups, with the exception
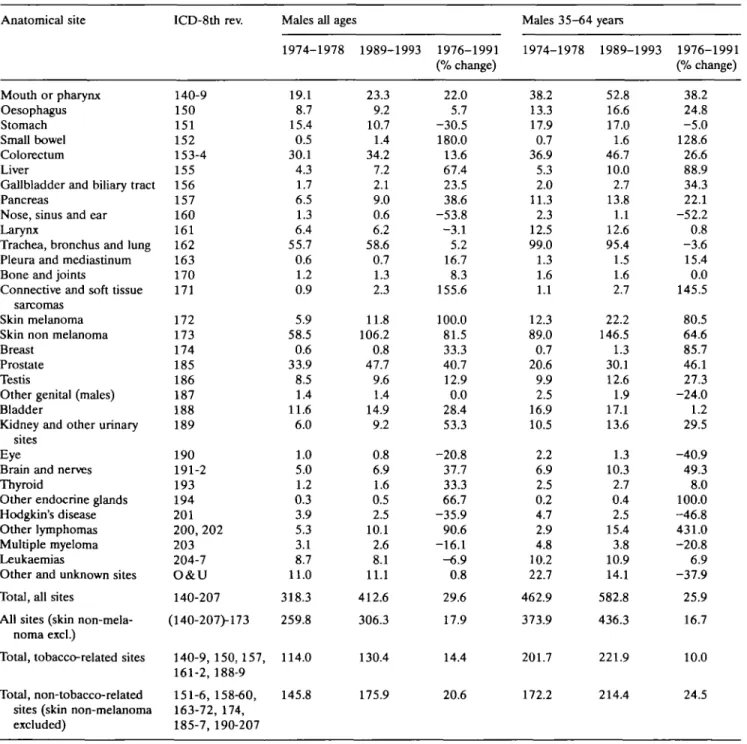
Table 1. Age-standardized* (rates per 100,000 population; all ages and 35-64 years) registered incidence for selected cancers and groups of
cancers in 1974-1978 (centered on 1976) and 1989-1993 (1991). Males, Vaud Cancer Registry, Switzerland. Anatomical site Mouth or pharynx Oesophagus Stomach Small bowel Colorectum Liver
Gallbladder and biliary tract Pancreas
Nose, sinus and ear Larynx
Trachea, bronchus and lung Pleura and mediastinum Bone and joints
Connective and soft tissue sarcomas
Skin melanoma Skin non melanoma Breast
Prostate Testis
Other genital (males) Bladder
Kidney and other urinary sites
Eye
Brain and nerves Thyroid
Other endocrine glands Hodgkin's disease Other lymphomas Multiple myeloma Leukaemias
Other and unknown sites Total, all sites
All sites (skin non-mela-noma excl.)
Total, tobacco-related sites Total, non-tobacco-related
sites (skin non-melanoma excluded) ICD-8th rev. 140-9 150 151 152 153-4 155 156 157 160 161 162 163 170 171 172 173 174 185 186 187 188 189 190 191-2 193 194 201 200, 202 203 204-7 O&U 140-207 (140-207)-173 140-9,150,157, 161-2,188-9 151-6,158-60, 163-72, 174, 185-7, 190-207
Males all ages 1974-1978 19.1 8.7 15.4 0.5 30.1 4.3 1.7 6.5 1.3 6.4 55.7 0.6 1.2 0.9 5.9 58.5 0.6 33.9 8.5 1.4 11.6 6.0 1.0 5.0 1.2 0.3 3.9 5.3 3.1 8.7 11.0 318.3 259.8 114.0 145.8 1989-1993 23.3 9.2 10.7 1.4 34.2 7.2 2.1 9.0 0.6 6.2 58.6 0.7 1.3 2.3 11.8 106.2 0.8 47.7 9.6 1.4 14.9 9.2 0.8 6.9 1.6 0.5 2.5 10.1 2.6 8.1 11.1 412.6 306.3 130.4 175.9 1976-1991 (% change) 22.0 5.7 -30.5 180.0 13.6 67.4 23.5 38.6 -53.8 -3.1 5.2 16.7 8.3 155.6 100.0 81.5 33.3 40.7 12.9 0.0 28.4 53.3 -20.8 37.7 33.3 66.7 -35.9 90.6 -16.1 -6.9 0.8 29.6 17.9 14.4 20.6 Males 35-64 1974-1978 38.2 13.3 17.9 0.7 36.9 5.3 2.0 11.3 2.3 12.5 99.0 1.3 1.6 1.1 12.3 89.0 0.7 20.6 9.9 2.5 16.9 10.5 2.2 6.9 2.5 0.2 4.7 2.9 4.8 10.2 22.7 462.9 373.9 201.7 172.2 years 1989-1993 52.8 16.6 17.0 1.6 46.7 10.0 2.7 13.8 1.1 12.6 95.4 1.5 1.6 2.7 22.2 146.5 1.3 30.1 12.6 1.9 17.1 13.6 1.3 10.3 2.7 0.4 2.5 15.4 3.8 10.9 14.1 582.8 436.3 221.9 214.4 1976-1991 (% change) 38.2 24.8 -5.0 128.6 26.6 88.9 34.3 22.1 -52.2 0.8 -3.6 15.4 0.0 145.5 80.5 64.6 85.7 46.1 27.3 -24.0 1.2 29.5 -40.9 49.3 8.0 100.0 -46.8 431.0 -20.8 6.9 -37.9 25.9 16.7 10.0 24.5
of middle-aged females, whereas the pattern was
heterogeneous for intestinal cancer, with rises in
inci-dence but modest declines in mortality. Overall,
intes-tinal cancer incidence increased by 17.7% in males
(from 30.6 to 35.6/100,000) and by 14.2% (from 20.2
to 23.0/100,000) in females, while mortality rates
declined by 2.7% (from 18.5 to 18.0/100,000) in
males, and by 20% (from 12.1 to 9.7/100,000) in
fe-males. No consistent trends were apparent for
gall-bladder cancer incidence, wheras mortality declined
from 2.1 in 1979-1983 to 1.6/100,000 males in
1989-1993, and from 2.7 to 1.7/100,000 females. A
tenden-cy to a slight but steady increase was observed for both
incidence and mortality rates for pancreatic cancer.
Respiratory sites. The trends for laryngeal and lung
cancer in the two sexes were similar in several aspects
for incidence and mortality. Male lung cancer rates, in
particular, increased up to the early 1980s, and
de-clined thereafter, particularly at younger and middle
age, whereas lung cancer incidence and mortality in
females increased steadily. Declines were observed for
laryngeal cancer in males, especially with respect to
mortality (-41%, from 4.1 in 1976 to 2.4/100,000 in
Table 2. Age-standardized1 (rates per 100,000 population; all ages and 35-64 years) registered incidence for selected cancers and groups of
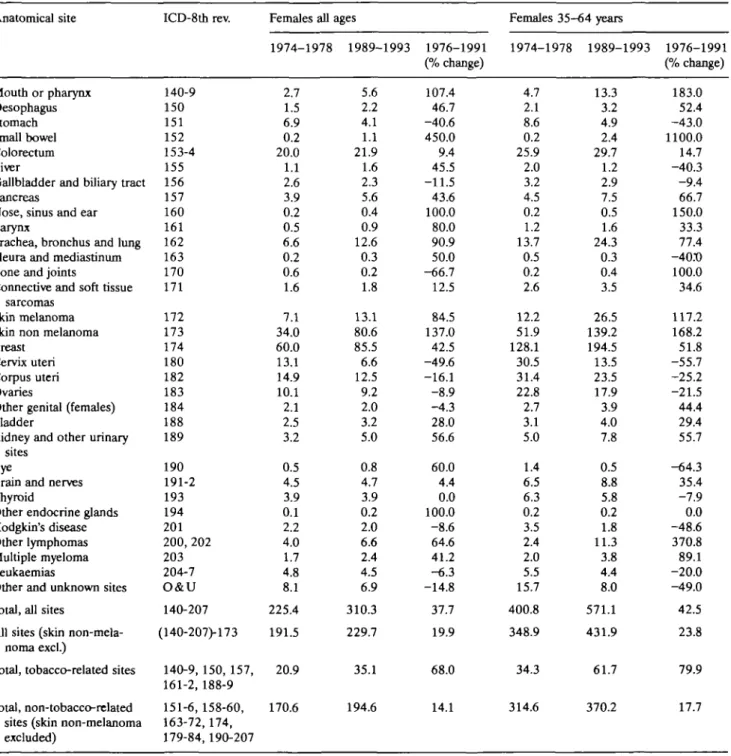
cancers in 1974-1978 (centered on 1976) and 1989-1993 (1991). Females, Vaud Cancer Registry, Switzerland. Anatomical site Mouth or pharynx Oesophagus Stomach Small bowel Colorectum Liver
Gallbladder and biliary tract Pancreas
Nose, sinus and ear Larynx
Trachea, bronchus and lung Pleura and mediastinum Bone and joints
Connective and soft tissue sarcomas
Skin melanoma Skin non melanoma Breast
Cervix uteri Corpus uteri Ovaries
Other genital (females) Bladder
Kidney and other urinary sites
Eye
Brain and nerves Thyroid
Other endocrine glands Hodgkin's disease Other lymphomas Multiple myeloma Leukaemias
Other and unknown sites Total, all sites
All sites (skin non-mela-noma excl.)
Total, tobacco-related sites Total, non-tobacco-related
sites (skin non-melanoma excluded) ICD-8th rev. 140-9 150 151 152 153-4 155 156 157 160 161 162 163 170 171 172 173 174 180 182 183 184 188 189 190 191-2 193 194 201 200, 202 203 204-7 O&U 140-207 (140-207>173 140-9, 150, 157, 161-2, 188-9 151-6, 158-60, 163-72,174, 179-84, 190-207 Females all 1974-1978 2.7 1.5 6.9 0.2 20.0 1.1 2.6 3.9 0.2 0.5 6.6 0.2 0.6 1.6 7.1 34.0 60.0 13.1 14.9 10.1 2.1 2.5 3.2 0.5 4.5 3.9 0.1 2.2 4.0 1.7 4.8 8.1 225.4 191.5 20.9 170.6 ages 1989-1993 5.6 2.2 4.1 1.1 21.9 1.6 2.3 5.6 0.4 0.9 12.6 0.3 0.2 1.8 13.1 80.6 85.5 6.6 12.5 9.2 2.0 3.2 5.0 0.8 4.7 3.9 0.2 2.0 6.6 2.4 4.5 6.9 310.3 229.7 35.1 194.6 1976-1991 (% change) 107.4 46.7 -40.6 450.0 9.4 45.5 -11.5 43.6 100.0 80.0 90.9 50.0 -66.7 12.5 84.5 137.0 42.5 -49.6 -16.1 -8.9 -4.3 28.0 56.6 60.0 4.4 0.0 100.0 -8.6 64.6 41.2 -6.3 -14.8 37.7 19.9 68.0 14.1 Females 35-64 years 1974-1978 1989-1993 4.7 2.1 8.6 0.2 25.9 2.0 3.2 4.5 0.2 1.2 13.7 0.5 0.2 2.6 12.2 51.9 128.1 30.5 31.4 22.8 2.7 3.1 5.0 1.4 6.5 6.3 0.2 3.5 2.4 2.0 5.5 15.7 400.8 348.9 34.3 314.6 13.3 3.2 4.9 2.4 29.7 1.2 2.9 7.5 0.5 1.6 24.3 0.3 0.4 3.5 26.5 139.2 194.5 13.5 23.5 17.9 3.9 4.0 7.8 0.5 8.8 5.8 0.2 1.8 11.3 3.8 4.4 8.0 571.1 431.9 61.7 370.2 1976-1991 (% change) 183.0 52.4 -43.0 1100.0 14.7 -40.3 -9.4 66.7 150.0 33.3 77.4 -40X) 100.0 34.6 111.2 168.2 51.8 -55.7 -25.2 -21.5 44.4 29.4 55.7 -64.3 35.4 -7.9 0.0 -48.6 370.8 89.1 -20.0 -49.0 42.5 23.8 79.9 17.7
Table 3. Age-standardized* (rates per 100,000 population; all ages and 35-64 years) certified mortality from selected cancers and groups of
cancers in 1974-1978 (centered on 1976) and 1989-1993 (1991). Males, Vaud Cancer Registry, Switzerland. Anatomical site Mouth or pharynx Oesophagus Stomach Intestines, total Liver
Gallbladder and biliary tract Pancreas
Nose, sinus and ear Larynx
Trachea, bronchus and lung Pleura and mediastinum Bone and joints
Connective and soft tissue sarcomas
Skin melanoma Skin non melanoma Breast
Prostate Testis
Other genital (males) Bladder
Kidney and other urinary sites
Eye
Brain and nerves Thyroid gland
Other endocrine glands Hodgkin's disease All other lymphomas Multiple myeloma Leukaemias
Other and unknown sites Total, all sites
Total, tobacco-related sites Total, non-tobacco-related sites ICD-8th rev. 140-9 150 151 152-4 155 156 157 160 161 162 163 170 171 172 173 174 185 186 187 188 189 190 191-2 193 194 201 200, 202 203 204-7 O&U 140-207 140-9, 150, 157, 161:2, 188-9 151-6, 158-60, 163-74, 185-7, 190-207
Males all ages 1974-1978 8.0 8.7 13.0 18.5 4.5 1.7 7.6 1.1 4.1 45.1 0.8 0.3 0.6 1.8 0.8 0.4 19.4 1.8 0.0 7.1 3.6 0.3 4.6 0.4 0.3 4.1 1.7 2.2 6.3 4.8 173.6 84.2 89.4 1989-1993 8.3 7.7 6.4 18.0 7.1 1.6 9.2 0.3 2.4 49.9 1.6 0.6 0.4 3.3 1.1 0.2 20.8 0.9 0.1 7.9 3.8 0.2 4.3 0.3 0.3 0.9 4.9 2.4 5.3 6.5 176.7 89.2 87.5 1976-1991 (% change) 3.6 -11.5 -50.8 -2.6 57.8 -5.9 21.1 -72.7 -41.5 10.6 100.0 100.0 -33.3 83.3 37.5 -50.0 7.2 -50.0 900.0 11.3 5.6 -33.3 -6.5 -25.0 0.0 -78.0 188.2 9.1 -15.9 35.4 1.8 5.9 -2.1 Males 35-64 1974-1978 17.7 11.6 11.3 19.4 6.8 2.0 10.7 1.6 6.9 68.0 1.3 1.1 0.7 3.1 1.2 0.4 6.3 1.1 0.0 7.3 4.6 0.7 6.4 0.4 0.2 7.5 1.1 2.2 7.0 12.5 221.1 126.8 94.3 years 1989-1993 17.3 11.1 8.5 16.9 9.8 1.7 12.1 0.0 3.8 75.0 3.0 0.9 0.9 5.0 0.7 0.2 5.2 1.5 0.0 6.0 4.2 0.0 7.3 0.6 0.5 1.1 4.8 3.2 4.9 6.2 200.1 129.5 70.6 1976-1991 (% change) -2.3 -4.3 -24.8 -12.9 44.1 -15.4 13.1 -99.4 -44.9 10.3 131.5 -18.2 28.6 61.6 -41.7 -50.0 -17.5 36.4 --17.7 -8.7 -98.6 14.1 50.0 150.0 -85.3 336.4 45.5 -30.1 -50.4 -9.5 2.1 -25.1
* On the world standard population.
1991). Thus, the incidence/mortality ratio of laryngeal
cancer increased from 1.6 to 2.6.
Skin, including melanoma. There were substantial
rises in registered incidence of skin neoplasms (around
or over 2-fold for non-melanomatous cancers in both
sexes), particularly at younger and middle ages and in
females. Trends in mortality were also appreciably
up-ward for melanoma in both sexes, but discontinuous
and only modestly upward for non-melanomatous
neo-plasms. This is not surprising, since these rates were
based on much smaller numbers, and reliability of
death certification for non-melanomatous skin cancer
remains open for discussion.
Breast and female genital tract. Female breast cancer
incidence rates showed substantial upward trends (with
rises of 42.5% overall, and, particularly in middle age,
of 52% from 128.1 to 194.5/100,000) over those of
mortality, which since the early 1980s had showed
some decline in younger and middle-aged (from 48.8 in
1981 to 40.3/100,000 in 1991). Thus, the incidence/
mortality ratio increased from 3.1 to 4.8 at age 35-64,
and from 2.8 to 3.8 at all ages. Downward trends were
observed for uterine (50% decline for cervix, and 16%
for corpus) and ovarian cancer incidences (—9%), and
were somewhat larger for mortality (-29%).
Male genital tract. Incidence of cancer of the prostate
increased steadily and appreciably, by over 40%, from
34 to 48/100,000 at all ages, mostly over the most
Table 4. Age-standardized' (rates per 100,000 population; all ages and 35-64 years) certified mortality from selected cancers and groups of
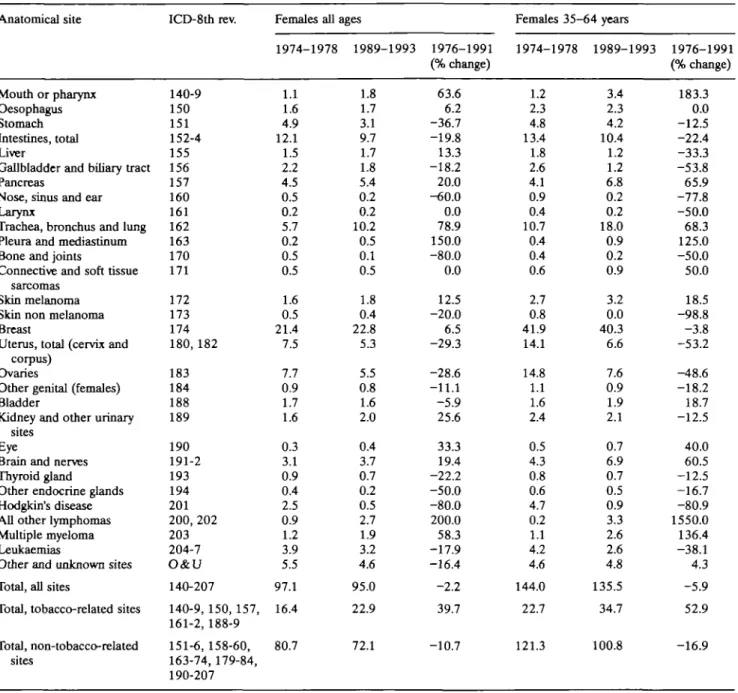
cancers in 1974-1978 (centered on 1976) and 1989-1993 (1991). Females, Vaud Cancer Registry, Switzerland. Anatomical site Mouth or pharynx Oesophagus Stomach Intestines, total Liver
Gallbladder and binary tract Pancreas
Nose, sinus and ear Larynx
Trachea, bronchus and lung Pleura and mediastinum Bone and joints
Connective and soft tissue sarcomas
Skin melanoma Skin non melanoma Breast
Uterus, total (cervix and corpus)
Ovaries
Other genital (females) Bladder
Kidney and other urinary sites
Eye
Brain and nerves Thyroid gland
Other endocrine glands Hodgkin's disease All other lymphomas Multiple myeloma Leukaemias
Other and unknown sites Total, all sites
Total, tobacco-related sites Total, non-tobacco-related sites ICD-8th rev. 140-9 150 151 152-4 155 156 157 160 161 162 163 170 171 172 173 174 180, 182 183 184 188 189 190 191-2 193 194 201 200, 202 203 204-7 O&U 140-207 140-9, 150, 157, 161-2, 188-9 151-6, 158-60, 163-74, 179-84, 190-207 Females all 1974-1978 1.1 1.6 4.9 12.1 1.5 2.2 4.5 0.5 0.2 5.7 0.2 0.5 0.5 1.6 0.5 21.4 7.5 7.7 0.9 1.7 1.6 0.3 3.1 0.9 0.4 2.5 0.9 1.2 3.9 5.5 97.1 16.4 80.7 ages 1989-1993 1.8 1.7 3.1 9.7 1.7 1.8 5.4 0.2 0.2 10.2 0.5 0.1 0.5 1.8 0.4 22.8 5.3 5.5 0.8 1.6 2.0 0.4 3.7 0.7 0.2 0.5 2.7 1.9 3.2 4.6 95.0 22.9 72.1 1976-1991 (% change) 63.6 6.2 -36.7 -19.8 13.3 -18.2 20.0 -60.0 0.0 78.9 150.0 -80.0 0.0 12.5 -20.0 6.5 -29.3 -28.6 -11.1 -5.9 25.6 33.3 19.4 -22.2 -50.0 -80.0 200.0 58.3 -17.9 -16.4 -2.2 39.7 -10.7 Females 35-64 years 1974-1978 1989-1993 1.2 2.3 4.8 13.4 1.8 2.6 4.1 0.9 0.4 10.7 0.4 0.4 0.6 2.7 0.8 41.9 14.1 14.8 1.1 1.6 2.4 0.5 4.3 0.8 0.6 4.7 0.2 1.1 4.2 4.6 144.0 22.7 121.3 3.4 2.3 4.2 10.4 1.2 1.2 6.8 0.2 0.2 18.0 0.9 0.2 0.9 3.2 0.0 40.3 6.6 7.6 0.9 1.9 2.1 0.7 6.9 0.7 0.5 0.9 3.3 2.6 2.6 4.8 135.5 34.7 100.8 1976-1991 (% change) 183.3 0.0 -12.5 -22.4 -33.3 -53.8 65.9 -77.8 -50.0 68.3 125.0 -50.0 50.0 18.5 -98.8 -3.8 -53.2 -48.6 -18.2 18.7 -12.5 40.0 60.5 -12.5 -16.7 -80.9 1550.0 136.4 -38.1 4.3 -5.9 52.9 -16.9
" On the world standard population.
recent calendar period and among males below age 65.
Overall mortality, however, was stable, and even
some-what in decline in younger age groups (from 7.5 in 1981
to 5.2/100,000 in 1991 at age 35-64). This indicates
that the apparent increases in incidence are largely or
totally attributable to more accurate diagnosis of the
disease [20, 21]. Testicular cancer incidence also
showed an upward trend, mostly over the most recent
calendar period (from 8.2 in 1984-1988 to 9.6/
100,000 in 1989-1993), whereas mortality tended to
decline (from 1.8/100,000 in 1976 to 0.9/100,000 in
1991), probably in response to improved treatment of
the disease [22].
Urinary tract. In males, after early increases, bladder
cancer mortality rates tended to level off and decline
over recent years (from 9.2 in 1979-1983 to 7.9/
100,000 in 1989-1993). Some decline in incidence
was also observed, but only in younger- and
middle-aged groups. A steady rise was observed for kidney
cancer rates (for incidence, from 6.0/100,000 in
1974-1978 to 9.2/100,000 in 1989-1993 in males, and from
3.2 to 5.0/100,000 in females), except for mortality in
the younger-middle aged group for both sexes over the
most recent calendar periods (from 5.8 to 4.2/100,000
males and from 2.7 to 2.1/100,000 females, between
1986 and 1991, respectively).
Lympho-haemopoietic neoplasms. Hodgkin's disease
rates declined in both sexes with respect to both
inci-dence (by about 40% in males and 10% in females) and
mortality (by about 80% in both sexes). While trends
in incidence are difficult to explain, although
attribut-able at least in part to changes in diagnostic
classifica-tion [23], the declines in mortality are largely due to
improved treatment of the disease [22]. In contrast,
incidence (90% increase in males) and mortality rates
(3-fold increase in both sexes) from all other
lympho-mas were appreciably on the rise, although this may be
partly due to changed criteria for diagnosis and
classifi-cation among the lymphomas, and between lymphomas
and chronic lymphoid leukaemias as well. Both
inci-dence and mortality from multiple myeloma were
stable (around 2-2.5/100,000 in 1989-1993),
con-firming the absence of steady epidemic rise from
myeloma in this population [24]. For leukaemias,
trends in mortality were generally more favourable than
for incidence, probably reflecting some improvement in
the treatment of the disease [22].
All neoplasms. There was a steady upward trend in
certified incidence for all cancers over the past two
decades, particularly in younger and middle age.
Over-all cancer incidence (excluding non-melanomatous
skin cancers) increased by 18%, from 259.8 to 306.3/
100,000 in males, and by 20%, from 191.5 to 229.7/
100,000 in females, and by over 30% in both sexes,
when non-melanomatous skin cancers were included.
In contrast, mortality was stable at all ages in both
sexes, and, if anything, declined in young and middle
age (mostly in males, by 14%) over the past decade.
Overall cancer mortality increased by 1.8% in males,
and decreased by 2.2% in females. A large proportion
of these diverging trends between incidence and
mor-tality is attributable to the rising incidence but stable
mortality for prostatic and breast cancers in males and
females, and for colorectal cancer in both sexes, and to
the few neoplasms, such as testicular cancer, Hodgkin's
disease and leukaemias, where the impact of treatment
on mortality has been noticeable. The remaining part is
probably due to a wide spectrum of moderately
hete-rogeneous trends for a number of different neoplasms,
including, among others, intestines, stomach, skin, and
cervix uteri.
Total cancer rates were also subdivided into the
seven major tobacco-related sites (lung, oral cavity and
pharynx, oesophagus, larynx, pancreas, bladder and
kidney) and all other sites ('non-tobacco-related sites').
Among males, a greater increase in incidence (+21% at
all ages, +25% at age 35-64) was observed for
non-tobacco-related cancers, whereas mortality declined
for non-tobacco-related cancers, mostly in middle age
(-25%), but increased for tobacco-related ones (+6%
at all ages, +2% at age 35-64). In females, both
inci-dence and mortality increased substantially for
tobac-co-related sites, mostly in middle age (+80% incidence,
+53% mortality), but declined by 11% to 17% for
non-tobacco-related ones.
Discussion
This systematic analysis of trends in cancer incidence
and mortality between 1974 and 1993 in a well-defined
and uniformly controlled population has shown a
substantial stability in death rates. This is due to a
level-ing off in the long-term increase of lung and other
tobacco-related neoplasms, and to the relatively
mod-est - as of now in absolute terms - increase in mortality
from tobacco-related neoplasms in females.
Thus, the different pattern of the tobacco-related
cancer epidemic in the two sexes and in various age
groups is a major determinant of cancer rates in this
population, and a simple distinction of major
tobacco-related sites shows a much more favourable pattern of
trends in both sexes, at least for mortality. With
refer-ence to specific cancer sites, some persisting upward
trends in mortality (e.g., for oral and pharyngeal
can-cers in males, for pancreatic, kidney cancan-cers or
lym-phomas) were counterbalanced by persisting declines
in mortality from stomach cancer in both sexes,
cer-vical cancer in females, as well as from testicular
can-cer, leukaemias, and Hodgkin's disease, i.e., the main
sites where substantial therapeutic improvements have
been achieved [22].
In contrast, overall cancer incidence increased by
20% to 30% in both sexes and various age groups. Two
major determinants of these diverging trends have been
identified, namely, breast and prostate cancers. This
illustrates the impact of screening and diagnostic
advancements on overall cancer rates over the last few
decades [25]. In fact, breast cancer treatment has only
moderately improved over the last calendar period
considered [26], and prostate cancer therapy has seen
only minor changes [27, 28]. The diagnosis of these
neoplasms, in contrast, has largely improved, due to the
introduction and widespread adoption of
mammogra-phy [25], prostate-specific antigen (PSA) [29] and other
diagnostic techniques.
Data from Washington State [30] and metropolitan
Atlanta [31] indicate that mammography partly
ac-counts for the increase in disease incidence, and the
impact of mammography on breast cancer detection
may reach 30% [32, 33]. Although the data are not
totally consistent [34], indirect evidence of the
influ-ence of mammography on breast cancer incidinflu-ence
derives from the observation that breast cancer
inci-dence rates are now consistently higher in North
America, where mortality rates are higher in Britain
and a few other European countries [35, 36]. If
screen-ing and earlier detection confer a survival benefit,
screening may account not only for an early increase in
incidence, but also for a subsequent decline in
mortal-ity, since the median survival for these neoplasms is
relatively high [33, 37]. Thus, the recent apparent
in-creases in the incidence of these neoplasms are
prob-ably largely or altogether artifactual.
A similar pattern, with increasing incidence but
stable or declining mortality, has been observed for
colorectal cancer as well, although the divergence is
smaller than for breast or prostate, and can also be
attributed to the impact of screening on incidence,
to-gether with some improvement in survival [38].
Similar trends were observed in other developed
countries. For instance between 1973 and 1989, cancer
incidence in the United States increased by 20.2% in
males and 22.6% in females, and mortality by only
5.9% in males and 6.2% in females [37]. Rises in cancer
incidence were also observed in more recent Swedish
cohorts, but they were not reflected in mortality trends
[39].
In a sense, the present data are reassuring, since they
are inconsistent with the existence of an ongoing cancer
epidemic in this European population. However, they
are also incompatible with the presence of major
ad-vancements in the prevention and treatment of cancer.
More generally, after due consideration of the variable
time lag between incidence and mortality for different
neoplasms [37, 39], these data underscore the
comple-mentary nature of cancer incidence and mortality rates,
and hence the importance of combining information
derived from incidence and mortality in order to clarify
the significance of complex underlying cancer trends at
the population level.
Acknowledgments
The contribution of the Aargau, St. Gall and Swiss
Leagues against Cancer, Bern (Grant FOR 305.93),
and of the Vaud Cancer Registry's staff are gratefully
acknowledged. The authors wish to thank Mrs. F.
Lucchini for her most helpful technical assistance.
References
1. Adami H-O, Sparen P, Bergstrom R et al. Increasing survival trend after cancer diagnosis in Sweden; 1960-1984. J Natl Cancer Inst 1989; 81: 1640-7.
2. Doll R. Are we winning the fight against cancer. An epidemio-logical assessment Eur J Cancer 1990; 26: 508-9.
3. Levi F, Te VC, Randimbison L, La Vecchia C. Cancer inci-dence registration and trends in the Canton of Vaud, Switzer-land. Eur J Cancer 1991; 27: 207-9.
4. Hill C, Benhamou E, Doyon F. Trends in cancer mortality, France 1950-1985. Br J Cancer 1991; 63: 587-90.
5. Ries LAG, Hankey BF, Miller BA et al. Cancer Statistics Re-view 1973-1988. National Cancer Institute, Bethesda MD, NIH Publication No. 91-2789,1991.
6. Adami H-O. What is progress against cancer? Cancer Causes and Control 1993; 4:483-7.
7. Hoel DG, Davis DL, Miller AB et al. Trends in cancer mortal-ity in 15 industrialized countries, 1969-1986. J Natl Cancer Inst 1992; 84: 313-20.
8. Polednak AP. Trends in cancer incidence in Connecticut, 1935-1991. Cancer 1994; 74: 2863-72.
9. Devesa SS, Blot WJ, Stone Bj et al. Recent trends in the United States. J Natl Cancer Inst 1995; 87:175-82.
10. McCredie M, Coates MS, Ford JM. The changing incidence of cancer in adults in New South Wales. Int J Cancer 1988; 42: 667-71.
11. Giles G, Farrugja H, Silver B. Cancer registration in Victoria, Australia, 1982-1987. Eur J Cancer 1991; 27:659-62. 12. Schraub S, Bougeois P, Merrier M. Cancer incidence
registra-tion and trends in the Department of Doubs, France. Eur J Cancer 1992; 28: 1759-^0.
13. Levi F, Te VC, La Vecchia C. Changes in cancer incidence in the Swiss canton of Vaud, 1978-87. Ann Oncol 1990; 1: 293-7.
14. Levi F, Te VC, Randimbison L et al. Statistics from the registry of the canton of Vaud, Switzerland, 1983-1987. In Parkin DM, Muir CS, Whelan SL et al. (eds): Cancer Incidence in Five Continents, Vol. VI, IARC Scientific Publication No. 120. Lyon: IARC 1992; 762-5.
15. Levi F, Delachaux A, Junod B, Wietlisbach V. Statistics from the registry of the canton of Vaud, Switzerland, 1975-1977. In Waterhouse JAH, Muir CS, Shanmugaratnam K et al. (eds): Cancer Incidence in Five Continents, Vol. IV, IARC Scientific Publication No. 42: Lyon, IARC 1982; 546-9.
16. Levi F, Gutzwiller F, Alain' R et al. Statistics from the registry of the canton of Vaud, Switzerland, 1978-1982. In Muir CS, Waterhouse JAH, Mack T et al. (eds): Cancer Incidence in Five Continents, Vol. V, IARC Scientific Publication No. 88. Lyon: IARC 1987; 634-9.
17. International Classification of Disease for Oncology (ICD-O). Geneva; WHO 1976.
18. Levi F, Randimbison L, Te VC et al. Trends in cancer survival in Vaud, Switzerland. Eur J Cancer 1992; 28:1490-5. 19. Doll R, Smith PG. Comparison between registries:
Age-stand-ardized rates. In Waterhouse JAH, Muir CS, Shanmugaratnam K et al. (eds): Cancer Incidence in Five Continents, Vol. IV, IARC Scient Publ. No. 42. Lyon: IARC 1982; 671-5.
20. Brewer MK, Chetner MP, Beatie J et al. Screening for prostatic carcinoma with prostate-specific antigen. J Urol 1992; 147: 841-5.
21. Jacobsen SJ, Katusic SK, Bergstralh EJ et al. Incidence of prostate cancer diagnosis in the eras before and after serum prostate-specific antigen testing. JAMA 1995; 274:1445-9. 22. La Vecchia C, Levi F, Lucchini F, Garattini S. Progress of
anti-cancer drugs in reducing mortality from selected anti-cancers in Europe: An assessment Anti-Cancer Drugs 1991; 2: 215-21. 23. Levi F, La Vecchia C, Lucchini F et al. Mortality from
Hodgkin's disease and other lymphomas in Europe, 1960-1990. Oncology 1995; 52: 93-6.
24. Levi F, La Vecchia C. Trends in multiple myeloma. Int J Cancer 1990; 46: 755-6.
25. Quinn M, Allen E. Changes of incidence of and mortality from breast cancer in England and Wales since introduction of screening. BMJ 1995; 311: 391-5.
26. Early Breast Cancer Trialists' Collaborative Group. Systematic treatment of early breast cancer by hormonal cytotoxic, or immune therapy. 133 randomized trials involving 31,000 re-currences and 24,000 deaths among 75,000 women. Lancet 1992; 339: 1-15, 71-85.
27. Denis LJ. Prostate cancer A continuum of controversy. Eur J Cancer 1995; 31: 839-40.
28. Catalona W. Management of cancer of the prostate. N Engl J Med 1994; 331: 996-1004.
29. Gann PH, Hennekens CH, Stampfer MJ. A prospective evalua-tion of plasma prostate-specific antigen for detecevalua-tion of pros-tatic cancer. JAMA 1995; 273: 289-94.
30. White E, Lee CY, Kristal AR. Evaluation of the increase in breast cancer incidence in relation to mammography use. J Natl Cancer Inst 1990; 82:1546-52.
31. Liff JM, Sung JFC, Chow W-H et al. Does increased detection account for the rising incidence of breast cancer? Am J Public Health 1991; 81:462-5.
32. La Vecchia C, Negri E, Bruzzi P et al. The impact of mam-mography on breast cancer detection. Ann Oncol 1993; 4: 41-4.
33. La Vecchia C, Levi F, Franceschi S. Screening for cancer, 1995: An update. Ann Oncol 1995; 6: 537-41.
34. Peeters PHM, Verbeek ALM, Straatman H et al. Evaluation of overdiagnosis of breast cancer in screening with mammogra-phy. Results of the Nijmegen programme. Int J Epidemiol 1989; 18: 295-9.
35. Boyle P. Epidemiology of breast cancer. Bailliere's Clin Oncol 1988; 2:1-57.
36. Levi F, Lucchini F, La Vecchia C. Worldwide patterns of can-cer mortality, 1985-1989. Eur J Cancan-cer Prev 1994; 3: 109-43.
37. Frey CM, McMillen MM, Cowan CD et al. Representativeness of the Surveillance, Epidemiology and End Results Program data; Recent trends in cancer mortality rates. J Natl Cancer Inst 1992; 84: 872-7.
38. Bonneux L, Barendregt JJ, Looman CWN, van der Maas PJ. Diverging trends in colorectal cancer morbidity and mortality.
Earlier diagnosis comes at a price. Eur J Cancer 1995; 31: 1665-71.
39. Adami H-O, Bergstrom R, Spar6n P, Baron J. Increasing can-cer risk in younger birth cohorts in Sweden. Lancet 1993; 341: 773-7.
Received 11 January 1996; accepted 26 March 1996.
Correspondence to:
Dr. F. Levi
Registre Vaudois des tumeurs CHUV
Falaises 1 1011 Lausanne Switzerland