3D EDX 0icroanalysis by FIB-SEM: Elemental 4uantification (nhancement
P. Burdet, C. Hébert, M. Cantoni
Interdisciplinary Centre for Electron Microscopy (CIME), Federal Institute of Technology of Lausanne (EPFL), Station 12, CH-1015 Lausanne, Switzerland.
The spatial resolution of EDX analysis of bulk sample is limited by interaction volume. This volume can be reduced lowering acceleration voltage, but the energy of the electron beam needs to be high enough to excite the characteristic X-rays [1]. This is particularly critical in the case of small features. The accuracy of an EDX analysis decreases drastically when the interaction volume becomes bigger than the feature size. In a FIB/SEM it is possible to remove material slice by slice
and to explore so the sample in the 3rd dimension. The subsequent slices reveal this way what the
electrons in the interaction volume have “seen” under the surface. The characterization by EDX can be done in 3D this way [2]. Using the additional spatial information, spectra from the 3D stack can be post-processed to enhance the accuracy of the quantification. In this work a first approach to such post-processing algorithm is proposed.
Considering 2D EDX analysis, the structure below the surface is unknown which leads to an uncertainty on the quantified composition. However, in some special cases, a good understanding of the variation of the X-ray ionization yield with depth has led to procedures to partially overcome this limitation [1]. For example, in the case of multilayer (stratified) samples, it is possible to calculate both layer thicknesses and composition. Pouchou and Pichoir suggested a recursive procedure based on the IU(z) curve (the X-ray generation yield with depth) [3]. We propose to apply this procedure to 3D EDX data obtained with a FIB/SEM in order to enhance elemental quantification.
To apply the stratified quantification procedure to 3D EDX data, the following recursive relation is suggested as illustrated in the figure 1:
CiA = f (k-ratiosi,Ci-1,Ci-2,...)
With C the concentration of element A in the i layer/FIB slice, k-ratio the X-ray intensity normalized to intensity from a standard and f the recurrence relation, here the stratified quantification procedure.
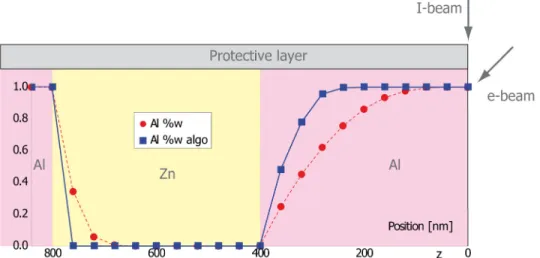
This approach is tested on several samples of simple geometry. An example for a stratified sample is given in figure 2. Simulated X-ray intensities are plotted as a function of z (direction of the FIB slicing progress). Compositions for each of these slices are calculated by the standard quantification procedure and by the approach suggested here. A general enhancement is observed for each layer. Based on this promising result, further tests are done on experimental measurements.
526
doi:10.1017/S1431927612004485 © Microscopy Society of America 2012Microsc. Microanal. 18 (Suppl 2), 2012
https://doi.org/10.1017/S1431927612004485
References
[1] J.I. Goldstein et al., Scanning Electron Microscopy and X-ray Microanalysis, Plenum, New York, 1992.
[2] M. Schaffer et al., Microchimica Acta 161 (2008) 421. [3] J. Pouchou and F. Pichoir, Scanning 12 (1990) 212. [4] This research is supported by Carl Zeiss SMT.
FIG. 1. Schematic picture of a material with 2 phases: The voxels of the 3D EDX acquisition are the dashed squares. Each voxel correspond to a (horizontal) slice removed by the ion beam.
FIG. 2. Simulated stratified sample: Sections are milled away by the ion beam. The electron beam has an incident angle of 36 degree. The aluminum composition (%w, standard quantification procedure) are displayed. The ones labeled “algo” are calculated with the approach suggested here.
Microsc. Microanal. 18 (Suppl 2), 2012 527
https://doi.org/10.1017/S1431927612004485