Published by Oxford University Press on behalf of the Society of Toxicology 2013. This work is written by (a) US Government employee(s) and is in the public domain in the US.
Identification of 2-Piperidone as a Biomarker of CYP2E1 Activity
Through Metabolomic Phenotyping
Jie Cheng,
*
,1Chi Chen,
*
,†
,1Krausz W. Kristopher,
*
Soumen K. Manna,
*
Mike Scerba,
‡
Fred K. Friedman,
*
Hans Luecke,
‡
Jeffrey R. Idle,
§
and Frank J. Gonzalez
*
,2*Laboratory of Metabolism, Center for Cancer Research, National Cancer Institute, National Institutes of Health, Bethesda, Maryland 20892; †Department
of Food Science and Nutrition, University of Minnesota, St Paul, Minnesota 55108; ‡Laboratory of Bioorganic Chemistry, National Institute of Diabetics and
Digestive and Kidney Diseases, National Institutes of Health, Bethesda, Maryland 20892; and §Hepatology Research Group, Department of Clinical Research,
University of Bern, 3010 Bern, Switzerland
1These authors contributed equally to this work.
2To whom correspondence should be addressed at Laboratory of Metabolism, Center for Cancer Research, National Cancer Institute, Building 37,
Room 3106, Bethesda, MD 20892. Fax: (301) 496-8419. E-mail: [email protected]. Received April 15, 2013; accepted June 17, 2013
Cytochrome P450 2E1 (CYP2E1) is a key enzyme in the met-abolic activation of many low molecular weight toxicants and also an important contributor to oxidative stress. A noninvasive method to monitor CYP2E1 activity in vivo would be of great value for studying the role of CYP2E1 in chemical-induced toxicities and stress-related diseases. In this study, a mass spectrometry– based metabolomic approach was used to identify a metabolite biomarker of CYP2E1 through comparing the urine metabolomes of wild-type (WT), Cyp2e1-null, and CYP2E1-humanized mice. Metabolomic analysis with multivariate models of urine metab-olites revealed a clear separation of Cyp2e1-null mice from WT and CYP2E1-humanized mice in the multivariate models of urine metabolomes. Subsequently, 2-piperidone was identified as a uri-nary metabolite that inversely correlated to the CYP2E1 activity in the three mouse lines. Backcrossing of WT and Cyp2e1-null mice, together with targeted analysis of 2-piperidone in mouse serum, confirmed the genotype dependency of 2-piperidone. The accumulation of 2-piperidone in the Cyp2e1-null mice was mainly caused by the changes in the biosynthesis and degradation of 2-piperidone because compared with the WT mice, the conversion of cadaverine to 2-piperidone was higher, whereas the metabo-lism of 2-piperidone to 6-hydroxy-2-piperidone was lower in the
Cyp2e1-null mice. Overall, untargeted metabolomic analysis
iden-tified a correlation between 2-piperidone concentrations in urine and the expression and activity of CYP2E1, thus providing a non-invasive metabolite biomarker that can be potentially used in to monitor CYP2E1 activity.
Key Words: CYP2E1; biomarker; metabolomics; 2-piperidone;
cadaverine.
Cytochromes P450 (P450) are the most important enzymes
in xenobiotic metabolism (
Guengerich and Cheng, 2011
).
CYP2E1 is involved in the oxidative metabolism of numerous
therapeutic agents and environmentally important chemicals
such as alcohol, aliphatic and aromatic hydrocarbons, and
solvents and industrial monomers. Many CYP2E1-catalyzed
reactions not only generate reactive metabolites but also
pro-duce reactive oxygen species (ROS), such as superoxide and
hydrogen peroxide (
Trafalis et al., 2010
). The involvement of
CYP2E1 in metabolic bioactivation of oxidative stress indicates
that this P450 plays an important role in many toxic events,
par-ticularly in the liver where it is constitutively expressed (
Caro
and Cederbaum, 2004
). It was shown that CYP2E1-catalyzed
biotransformation might be responsible for some
chemical-induced carcinogenesis (
Leon-Buitimea et al., 2012
;
Trafalis
et al
., 2010
) and tissue injury (
Chen et al., 2008
), whereas
CYP2E1-mediated ROS production and lipid peroxidation
con-tribute to the pathogenesis of diabetes (
Schafer et al., 2010
) and
nonalcoholic steatohepatitis (
Abdelmegeed et al., 2012
;
Aubert
et al
., 2011
). The increased risk of malignancy and metabolic
diseases has been associated with elevated CYP2E1
expres-sion and activity, which can be caused by chronic exposure to
acetone, alcohol, isoniazid, and other compounds (
Gonzalez,
2005
) or genetic polymorphisms (
Catanzaro et al., 2012
;
Lu
et al
., 2011
;
Sotsuka et al., 2011
).
Determination of the role of CYP2E1 in disease would
be greatly facilitated by real-time evaluation of CYP2E1
expression and activity. Chlorzoxazone (CNZ), a muscle
relaxant, has been used as a selective probe substrate for
measuring CYP2E1 activity in vivo (
Ernstgård et al., 2007
).
CNZ assays require the intake of a pharmacologically active
compound, multiple blood samplings, and the bioanalysis
of CNZ and its metabolite (6-hydroxy-CNZ) (
Emery et al.,
1999
;
Vesell and Korsunsky, 1998
), which makes it invasive
and inconvenient. In addition, the accuracy of this method is
affected by factors such as the dose and the involvement of
other P450s (
Ernstgård et al., 2004
). A preferred solution is to
Advance Access publication June 28, 2013identify endogenous substrates that can function as noninvasive
biomarkers of CYP2E1 activity. Cyp2e1-null mice (
Lee et al.,
1996
) and CYP2E1-humanized mice (
Cheung et al., 2005
)
could provide the ideal experimental platform for screening
and characterizing endogenous biomarkers of CYP2E1 activity
because the metabolic consequences of the loss of mouse
CYP2E1 activity in the Cyp2e1-null mice and the introduction
of human CYP2E1 activity in the CYP2E1-humanized mice
can be directly examined in these models.
Metabolomics, as a high-throughput systems biology tool,
possesses the analytical power to comprehensively examine the
metabolism of both exogenous or endogenous substances and
to determine the metabolizing properties of enzymes and their
physiological functions in the biological system (
Johnson et al.,
2012
). In this study, a mass spectrometry–based metabolomics
approach was applied to examine the metabolic differences
among the wild-type (WT), Cyp2e1-null, and
CYP2E1-humanized mice. 2-Piperidone was identified and characterized
as a potential biomarker of CYP2E1 activity.
MATErIAlS And METhOdS
Animals and chemicals. The WT, Cyp2e1-null, and CYP2E1-humanized
mice used in this study were on the 129/Sv background. All mice were housed in temperature- and light-controlled rooms and were given water and pelleted chow
ad libitum. Animal experiments were carried out in accordance with the Institute of Laboratory Animal Resources guidelines and approved by the National Cancer Institute Animal Care and Use Committee. 2-Piperidone, cadaverine, glutarim-ide, disulfiram, acetone, and the solvents for liquid chromatography and organic synthesis were obtained from Sigma-Aldrich (St Louis, MO). 3-Hydroxy-2-piperidone, 4-hydroxy-2-3-Hydroxy-2-piperidone, and 5-hydroxy-2-piperidone were obtained from Ark Pharm (Libertyville, IL).
Sample collection and preparation. Pathogen-free mice (2- to
3-month-old) were housed individually in Nalgene metabolic cages (Tecniplast, Exton, PA), and urine was collected for 24 h to avoid the effects of diurnal variation. Blood was collected by retro-orbital bleeding and processed to serum, and liver samples were harvested after killing. Liver microsomes were prepared by ultra-centrifugation. All samples were stored at −80°C.
Diets and chemical treatments. NIH-31 diet was used as the maintenance
chow for WT, Cyp2e1-null, and CYP2E1-humanized mice but was replaced by AIN-93G purified diet 6 days prior to chemical treatments. To determine the biotransformation of 2-piperidone or cadaverine in vivo, male WT mice were treated with 2-piperidone (ranging from 0.1 to 40 mg/kg) or cadaverine (20 mg/kg), respectively, by ip injection, and urine was collected for 24 h. The inhibition of CYP2E1 in WT mice was achieved by ip injection of disulfiram (20 mg/kg), whereas the induction of CYP2E1 in WT mice was achieved by ip injection of acetone (2 g/kg) for 3 days.
Primary hepatocyte extraction and culture. Primary hepatocytes were
isolated from the WT and Cyp2e1-null mice using a two-step perfusion tech-nique, which involves the sequential perfusion of the liver with a solution con-taining EDTA and collagenase (Seglen, 1976). Cells were treated with 100µM of 2-piperidone or 100µM of cadaverine dissolved in DMSO. After 12- and 24-h treatment periods at the prescribed time points, the cells were harvested and subjected to metabolite analysis.
Metabolomic analyses of urine and serum samples. Urine samples were
prepared by mixing 40 µl of urine with 160 µl of 50% aqueous acetonitrile and centrifugation at 18,000 × g for 10 min to remove protein and particulates.
Serum samples were denatured by the addition of 40-fold dilution of acetonitrile (66% vol:vol water). The supernatants were injected into the UPLC (Waters Corporation, Milford, MA) and metabolites separated by a gradient ranging from water to 95% aqueous acetonitrile containing 0.1% formic acid over a 10-min run. An Acquity UPLC BEH C18 column (Waters) was used to sep-arate chemical components at 35°C. The mobile phase flow rate was 0.5 ml/ min with an aqueous acetonitrile gradient containing 0.1% formic acid over a 10-min run. The QTOF Premier mass spectrometer (Waters) was operated in the positive electrospray ionization mode. Capillary voltage and cone voltage were maintained at 3 kV and 20 V, respectively. Source temperature and des-olvation temperature were set at 120°C and 350°C, respectively. Nitrogen was used as both cone gas (50 l/h) and desolvation gas (600 l/h), and argon was used as collision gas. For accurate mass measurement, the time-of-flight mass spec-trometry was calibrated with sodium formate solution (ranging 100–1000 m/z) and monitored by the intermittent injection of the lock mass sulfadimethoxine ([M + H]+ = 311.0814 m/z) in real time. Mass chromatograms and mass spectral
data were acquired and processed by MassLynx software (Waters) in centroid format. Metabolites were quantitated via peak areas that were normalized using an internal standard.
Gas chromatography-mass spectrometry analysis of urine samples.
Diluted urine samples and standard solutions containing 5µM 4-nitrobenzoic acid as the internal standard were applied to Waters Oasis HLB SPE columns, washed with water, and eluted with methanol. The eluate was dried under nitrogen, resus-pended in acetonitrile, and derivatized with N,O-bis(trimethylsilyl)trifluoroaceta-mide/10% trimethylchlorosilane. Samples were heated at 60°C for 30 min and then transferred to autoinjector vials. Gas chromatography-mass spectrometry (GC-MS) analysis was conducted using an Agilent GC 6890N/MS 5973N system. The initial oven temperature of 100°C was held for 2 min, then ramped at 10°C/min, and held for 2 min at 220°C. The injector temperature was 200°C, and the interface temperature was 220°C. One microliter of sample was injected onto the column using helium as the carrier gas, held at a constant flow of 1 ml/min. The mass spec-trometer was operated in scan mode (50–550 amu) with a solvent delay of 7 min.
Multivariate analysis of metabolomic data. Chromatographic and spectral
data were deconvoluted by MarkerLynx (Waters) software. A multivariate data matrix containing information on sample identity, ion identity (retention time and
m/z), and ion abundance was generated through centroiding, deisotoping, filter-ing, peak recognition, and integration. The intensity of each ion was calculated by normalizing the single ion counts versus the total ion counts in the whole chromatogram. The data matrix was exported into SIMCA-P software (Umetrics, Kinnelon, NJ) and transformed by mean-centering and Pareto scaling. Principal components of urine were generated by principal components analysis (PCA) or partial least squares discriminant analysis (PLS-DA) and were depicted in a scores scatter plot. The ions contributing to the separation of sample groups were identified in the respective loadings plot (Chen et al., 2007).
Synthesis of 6-hydroxy-2-piperidone. An oven-dried 100 ml round-bottomed flask was equipped with a stir bar and charged with glutarimide (0.20 g, 1.8 mmol, 1.0 eq.). The system was placed under an atmosphere of nitrogen, and 20 ml of dichloromethane was added. After cooling to 0°C, a solution of diisobutylaluminium hydride (DIBAL) in toluene (1.5M, 1.2 ml, 1.8 mmol, 1.0 eq.) was injected over the course of 5 min. When effervescence had ceased, the reaction was stirred for another 10 min. Then, an additional portion of DIBAL (1.5M, 1.3 ml, 1.9 mmol, 1.05 eq.) was injected over the course of 5 min. The reaction was monitored by thin-layer chromatography and stirred to completion on ice.
Analysis on 2-piperidone and cadaverine in mouse chows. After
dry-ing, 100 mg of NIH-31 diet and 100 mg of AIN-93G diet were homogenized in acetonitrile. The supernatants were obtained through centrifuging thrice at 10,000 × g for 10 min and diluted 10 times by acetonitrile. Five microliters of supernatant were injected into the liquid chromatography-mass spectrometry (LC-MS) or GC-MS systems. Target molecules were quantitated via peak areas that were normalized using an internal standard compared with standard curves of 2-piperidone and cadaverine.
Statistical analysis. Experimental values are expressed as mean ± SD.
Statistical analysis was performed using two-tailed Student’s t-test, except for the in vitro metabolism of 2-piperidone that was analyzed by one-way ANOVA. A value of p < 0.05 is considered statistically significant.
rESulTS
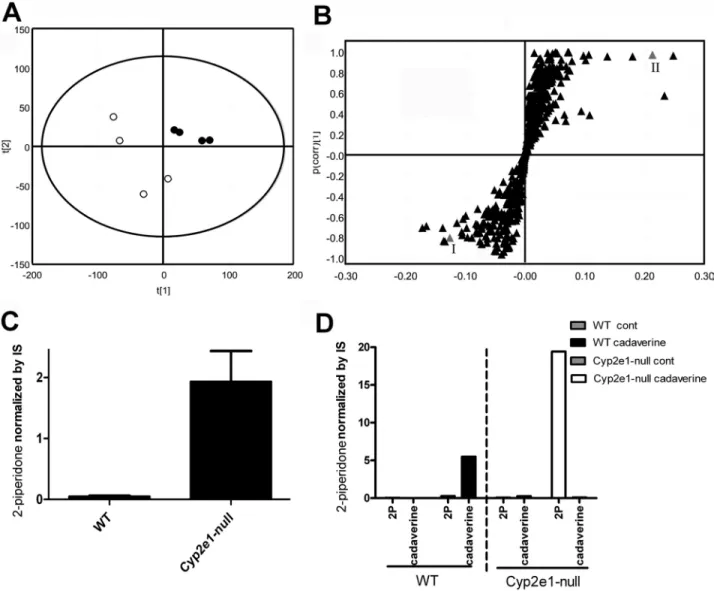
Urinary Metabolomics of WT and Cyp2e1-null Mice
Following LC-MS analysis of urine samples from male WT
and Cyp2e1-null mice, a clear separation of metabolites between
the two groups was revealed in a PLS-DA model (
Fig. 1A
).
A similar separation was observed between female WT and
Cyp2e1
-null mice (
Fig. 1B
). More importantly, the loading plots
of both male and female urinary metabolomes (
Figs. 1C
and
D
)
showed a metabolite with [M + H]
+= 100.077
+m/z as a major
contributor to the distinctive separation of WT and Cyp2e1-null
mice in the PLS-DA models. The elemental composition and
chemical structure of this metabolite were proposed based on
the accurate mass measurements and MS/MS fragmentography.
This compound was finally determined to be 2-piperidone by a
comparison with authentic standard (
Fig. 2
).
Distribution of 2-Piperidone in the Urine of WT,
Cyp2e1-null, and
CYP2E1-humanized Mice
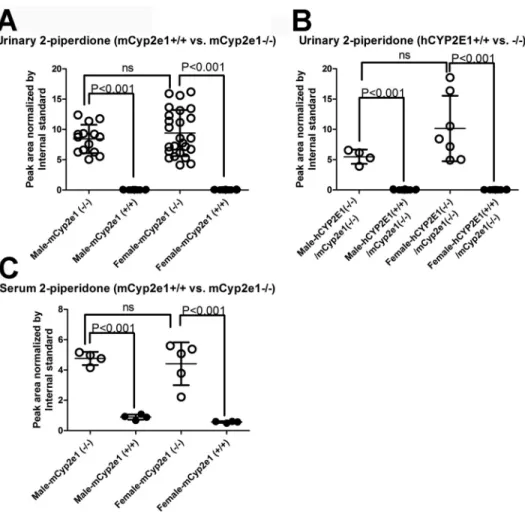
Quantitative analysis confirmed that 2-piperidone was
pre-sent at high levels in the urine of Cyp2e1-null mice but virtually
undetectable in the WT mice (p < 0.001) (
Fig. 3A
). A similar
distribution pattern of 2-piperidone was also observed in the
urine samples of CYP2E1-humanized mice [hCYP2E1(+/+),
mCyp2e1(−/−)], and their littermate controls [hCYP2E1(−/−),
mCyp2e1(−/−)] (p < 0.001) (
Fig. 3B
) and further confirmed
by examining its levels in serum samples from both male and
female WT and Cyp2e1-null mice (
Fig. 3C
). These results
strongly suggested that the level of 2-piperidone in mouse
bio-fluids was highly correlated with the presence of both mouse
and human CYP2E1.
Backcrossing of WT and
Cyp2e1-null Mice to Confirm That
2-Piperidone Is Related to CYP2E1 Expression
The correlation between 2-piperidone and Cyp2e1 genotypes
was further examined by backcrossing of WT and
Cyp2e1-null mice. The heterozygous mCyp2e1(+/−) male and female
mice were generated as the F1 generation. Subsequently, three
FIg. 1. Metabolomic analysis of urine samples from the WT (● ) and Cyp2e1-null mice (○). Urine samples were analyzed in positive mode in a LC-MS
system. Data were processed using Markerlynx and SIMCA-P+ software. (A) Scores plot of the PLS-DA model on male WT and Cyp2e1-null mice. The fitness
(R2 value) and prediction power (Q2 value) of the model were 0.315 and 0.196, respectively. (B) Ion ([M + H]+ = 100.077+ m/z) is shown as a box which is located
in the lower left corner of the loading plot. (C) Scores plot of the PLS-DA model on female WT and Cyp2e1-null mice. R2 value and Q2 value of the model were
0.424 and 0.289, respectively. Loading plot of the PLS-DA model on male WT and Cyp2e1-null mice. (D) Loading plot of the PLS-DA model on female WT and
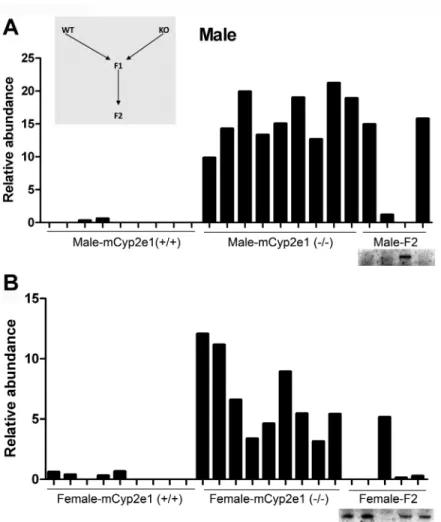
genotypes, mCyp2e1(+/+), mCyp2e1(+/−), and mCyp2e1(−/−)
mice, were produced at the expected Mendelian ratios in the
F2 generation after crossing the F1 mice. Similar to the
par-ent WT and mCyp2e1-null mice, the distribution of
2-piperi-done in the urine of F2 mice was consistent with the genotypes
in both genders, i.e., 2-piperidone was abundant in
back-crossed mCyp2e1(−/−) mice but deficient in backback-crossed
mCyp2e1(+/+) and mCyp2e1(+/−) mice (
Figs. 4A
and
B
). This
backcrossing experiment further confirmed that 2-piperidone
is inversely correlated to CYP2E1 expression and therefore a
potential biomarker for CYP2E1 activity. A higher variability
in 2-piperidone levels was noted in the females compared with
males (
Figs. 3
and
4
). The mechanism of this gender variability
is not known, although it could be due to differences in estrous
cycle and hormones in the female mice under study.
In Vivo Metabolism of 2-Piperidone
The contrast between the high abundance of 2-piperidone in
Cyp2e1
-null mice and its low abundance in WT mice suggested
2-piperidone as a potential CYP2E1 substrate. To investigate this
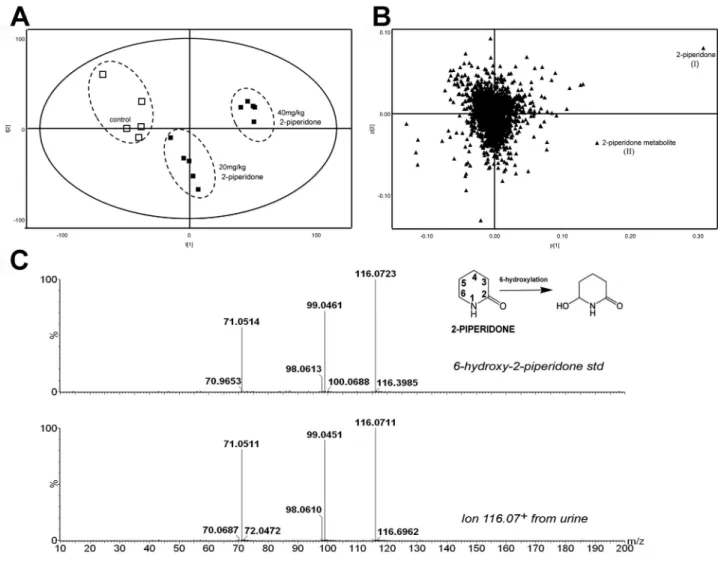
possibility, two doses of 2-piperidone (20 and 40 mg/kg) were
administered to WT mice. The resulting metabolomic profiles
showed separation of 2-piperidone-treated mice from control
mice in a dose-dependent manner (
Fig. 5A
). 2-Piperidone (I) and
a metabolite with [M + H]
+= 116.0709
+m/z (II) were identified
as the major contributors to the separation of sample groups in the
loadings plot (
Fig. 5B
). Metabolite II was assumed to be a
hydrox-ylated 2-piperidone, with the possible sites of hydroxylation at
the carbon-3, -4, -5, or -6 position of 2-piperidone. The chemical
identity of metabolite II was finally determined to be
6-hydroxy-2-piperidone after comparing the chromatograph and MS/MS
fragmentography of this metabolite with a synthesized standard
of 6-hydroxy-2-piperidone and other hydroxylated
2-piperi-done standards (
Fig. 5C
;
Supplementary fig. 1
). The retention
times of 3-hydroxy-2-piperidone, 4-hydroxy-2-piperidone, and
5-hydroxy-2-piperidone were 0.48, 0.61, and 0.39 min,
respec-tively. 6-Hydroxy-2-piperidone in urine and the
6-hydroxy-2-pi-peridone standard have a retention time of 0.53 min. The MSMS
fragmentation of 6-hydroxy-2-piperidone in urine only matched
the MSMS pattern of the 6-hydroxy-2-piperidone standard.
To further confirm the role of CYP2E1 in the conversion of
2-piperidone to 6-hydroxy-2-piperidone, WT mice were treated
FIg. 2. Identification of 2-piperidone through a comparison of MS/MS spectra. MS/MS fragmentography is shown for the fragmentograms of urinary ion
with six doses of 2-piperidone (0.1, 0.2, 1, 2, 10, and 20 mg/kg).
In addition, disulfiram, a CYP2E1 inhibitor (
Emery et al.,
1999
), was coadministered with the 20 mg/kg 2-piperidone
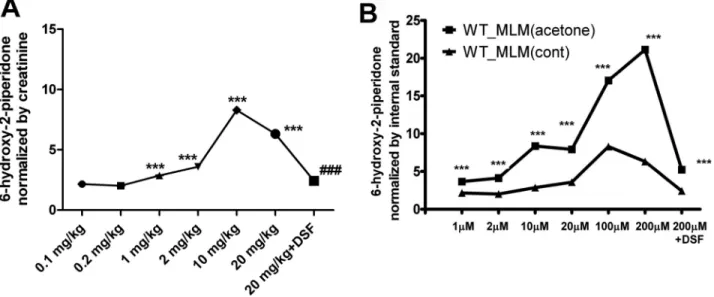
dose. The level of 6-hydroxy-2-piperidone in urine increased
dose dependently after treating 2-piperidone ranging from
0.1 to 10 mg/kg (
Fig. 6A
), suggesting that 2-piperidone is the
direct precursor of 6-hydroxy-2-piperidone. Interestingly,
the production of 6-hydroxy-2-piperidone from the 20 mg/kg
2-piperidone treatment was lower than that from the 10 mg/
kg 2-piperidone treatment, which could be due to substrate
inhibition of CYP2E1 (
Jones et al., 2011
;
Lee and Kim, 2013
).
Cotreatment of disulfiram led to the decrease of
6-hydroxy-2-piperidone in WT mice, thus further suggesting a catalytic role for
CYP2E1 in the biotransformation of this compound (
Fig. 6A
).
Moreover, when WT mice were treated with acetone, a CYP2E1
inducer (
Bondoc et al., 1999
;
Sinclair et al., 2000
), incubation
of 2-piperidone with liver microsomes from control and
acetone-treated mice showed that 2-piperidone 6-hydroxylase
activity in mouse liver was significantly induced by acetone
and dramatically inhibited by disulfiram (
Fig. 6B
). These data
indicate that CYP2E1 is the major enzyme responsible for
converting 2-piperidone to 6-hydroxy-2-piperidone both in vivo
and in vitro.
Identifying Mouse Chow as a Source of 2-Piperidone
In Vivo
In order to identify the source of 2-piderione in urine, a
diet-switching experiment was performed. The normal NIH-31
chow, which contains both seasonal plant and animal
materi-als, was replaced with AIN-93G chow that comprised purified
nutritional components. After feeding the AIN-93G purified
diet, PCA analysis of urinary metabolomics did not show a clear
separation between WT and Cyp2e1-null mice (
Supplementary
fig. 2A
). 2-Piperidone was also not detected in the sera of
AIN-93G diet-fed WT and Cyp2e1-null mice (
Supplementary fig. 2B
).
Therefore, the observed contrast between the feeding of NIH
chow (
Fig. 1
) and the feeding of AIN-93G diet (
Supplementary
fig. 2
) suggested the dietary relevance of 2-piperidone.
To determine whether the mouse chow is the only source of
2-piperidone in vivo, a mass balance experiment was conducted
FIg. 3. Genotype-dependent distribution of 2-piperidone. Relative abundance of 2-piperidone was expressed by the peak area normalized by internal
stand-ard. (A) Distribution of 2-piperidone in the urine of male and female WT (mCyp2e1+/+) and Cyp2e1-null (mCyp2e1−/−) mice. (B) Distribution of 2-piperidone in the urine of male and female CYP2E1-humanized mice (hCYP2E1+/+, mCyp2e1−/−) and their littermates (hCYP2E1−/−, mCyp2e1−/−). (C) Distribution of 2-piperidone in the serum of male and female WT and Cyp2e1-null mice. ns, no significant difference.
by comparing the quantity of 2-piperidone in the NIH diet
consumed by mice with the quantity of 2-piperidone excreted
in the urine. The amount of 2-piperidone in the NIH chow was
determined as 87 ng/kg chow, but none was detected in the
AIG-93G purified diet. Dietary chow uptake was around 2–3 g per
mouse per day, equivalent to 175–262 ng 2-piperidone per mouse
per day. However, the average amount of 2-piperidone in urine
was determined to be 507 ± 62 ng/day in a Cyp2e1-null mouse and
6.2 ± 4.1 ng/day in a WT mouse (n = 7). The quantitative difference
between 2-piperidone in urine and 2-piperidone in dietary intake
suggested that in addition to its dietary source, 2-piperidone in the
Cyp2e1
-null mice might also come from endogenous metabolism.
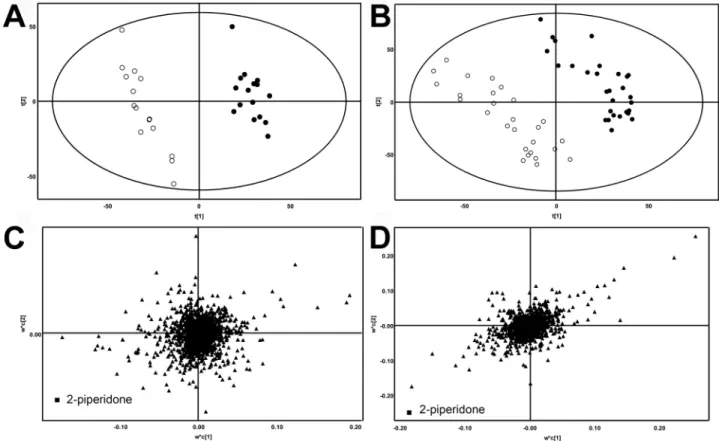
Identification of Cadaverine as a Potential Precursor
Metabolite of 2-Piperidone
Cadaverine is known to be metabolized to 2-piperidone
through formation of 1-piperideine (
Callery and Geelhaar,
1984
), which is subsequently metabolized to 2-piperidone via
amine oxidase–mediated oxidation (
Naila et al., 2010
). To
examine whether cadaverine is another source of 2-piperidone
in vivo
, GC-MS analysis of urine samples was conducted. The
result of GC-MS-based metabolomics revealed clear separation
between WT and Cyp2e1-null mice in a PCA model (
Fig. 7A
).
Among the urinary metabolites that contributed to differences
between the two mouse lines, a higher level of 2-piperidone
was correlated with the Cyp2e1-null mice, whereas a higher
level of cadaverine was correlated with the WT mice (
Fig. 7B
).
Dietary analysis indicated that, in contrast to 2-piperidone,
cadaverine is undetectable in either NIH chow or purified
diet (
Supplementary fig. 3
). Furthermore, cadaverine was
not detected in the urine from the mice fed purified diet but
detected from urine of mice fed NIH diet (
Supplementary
fig. 3
). To examine whether cadaverine metabolism contributes
to the genotype-dependent distribution of 2-piperidone,
cadaverine was administered to both WT and Cyp2e1-null
mice fed the AIN-93G purified diet. Subsequent metabolite
FIg. 4. The influence of backcrossing between WT and Cyp2e1-null mice on 2-piperidone distribution in urine. (A) Distribution of 2-piperidone in male
WT, Cyp2e1-null, and F2 generation mice. The procedure of backcrossing to produce F1 and F2 generations is illustrated in the insert. The genotypes of male F2 generation mice are shown in an inlaid image of Cyp2e1 genotyping. (B) Distribution of 2-piperidone in female WT, Cyp2e1-null, and F2 generation mice. The genotypes of female F2 generation mice are shown in an inlaid image of Cyp2e1 genotyping.
analysis revealed a high abundance of 2-piperidone and a low
abundance of cadaverine in the urine of Cyp2e1-null mice,
while an opposite distribution pattern was found in the urine of
WT mice, suggesting that efficient conversion of cadaverine to
2-piperidone occurred in the Cyp2e1-null mice but not in WT
mice (
Fig. 7C
). This observation on the in vivo biosynthesis of
2-piperidone from cadaverine was further confirmed by in vitro
incubations because primary hepatocytes from the Cyp2e1-null
mice were far more effective than their counterparts from the
WT mice for converting cadaverine to 2-piperidone (
Fig. 7D
).
The expression of Cyp2e1 was not changed in primary
hepatocytes of WT and Cyp2e1-null mice treated with either
2-piperidone or cadaverine.
dISCuSSIOn
2-Piperidone, also called δ-valerolactam, is a widely used
monomer for synthesizing polymers (nylon-5) in industry
(
Mahjoub et al., 2011
). However, the appearance of 2-piperidone in
urine and serum has not been reported previously. Metabolomic
analysis of WT, Cyp2e1-null, and CYP2E1-humanized mice
demonstrated that the distribution of 2-piperidone in mice
is genotype dependent. More importantly, 2-piperidone was
identified as a potential biomarker of CYP2E1 activity based
on genotype-dependent distribution, backcrossing of WT and
Cyp2e1
-null mice, and in vitro assays. 2-Piperidone bears the
structural features of typical CYP2E1 substrates, such as small
size, ring structure, and modest hydrophilicity (
Li et al., 2012
).
Indeed, the conversion of 2-piperidone to its main metabolite
6-hydroxy-2-piperidone was inhibited by disufiram, a CYP2E1
inhibitor, and elevated by pretreatment of mice with acetone, a
CYP2E1 inducer. Another important observation was the dietary
association of 2-piperidone. Two different mouse chows were
used in this study. One is NIH-31 diet, an open-formula diet
based on cereal and fish meal, and the other is AIN-93G diet,
which contains refined ingredients including proteins, sugars,
FIg. 5. Identification of 6-hydroxy-2-piperidone as a 2-piperidone metabolite. (A) Separation of control WT (□) mice from the WT mice (■) treated with 20 and 40 mg/kg of 2-piperidone in the scores plot of a PLS-DA model on the urine metabolomes. (B) Identification of 2-piperidone (I) and 2-piperidone metabolite (II) in the loadings plot. (C) A comparison of MS/MS spectra of urinary 2-piperidone metabolite ([M + H]+ = 116.07 m/z) and synthesized 6-hydroxy-2-piperidone standard.
oils, vitamins, and minerals (
Reeves, 1997
). 2-Piperidone was
detected in urine from mice fed regular NIH-31 diet that
con-tains 2-piperidone but not from the mice fed AIN-93G purified
diet that lacks 2-piperidone. Therefore, the genotype-dependent
distribution of 2-piperidone in mouse urine can be partially
attributed to the presence of CYP2E1-mediated metabolism of
2-piperidone in the WT and CYP2E1-humanized mice and the
absence of the same reaction in the Cyp2e1-null mice.
Dietary exposure of 2-piperidone could not be the sole
source of urinary 2-piperidone in the Cyp2e1-null mice because
quantitative analysis revealed that the daily dietary intake
of 2-piperidone was less than the amount of 2-piperidone
excretion in urine. Through GC-MS–based metabolomics,
cadaverine, a common urine and semen metabolite derived
from the decarboxylation of lysine (
Bardocz, 1993
;
Seiler,
2004
), was defined as another potential source of 2-piperidone
because the urinary excretion of 2-piperidone was correlated
to the cadaverine intake in the Cyp2e1-null mice in a
dose-dependent manner. Therefore, besides its proven role in the
catabolism of 2-piperidone, CYP2E1 can also negatively affect
the biogenesis of 2-piperidone, in which cadaverine functions
as a precursor of 2-piperidone. Further investigations on the
source and metabolism of cadaverine in this study provided
some mechanistic insights on how cadaverine can contribute to
CYP2E1-dependent levels of 2-piperidone.
Treatment of WT and Cyp2e1-null mice with cadaverine
resulted in more 2-piperidone in the Cyp2e1-null mice.
In addition, a higher conversion rate from cadaverine to
2-piperidone was observed in primary hepatocytes from
Cyp2e1
-null mice compared with hepatocytes from WT
mice. Similar to 2-piperidone, the distribution of cadaverine
is also diet dependent. Cadaverine was present in the urine
from mice fed the NIH-31 diet but absent in the urine from
the mice fed the AIN-93G diet. Because cadaverine was not
detected in both NIH-31 and AIN-93G diets used in this
study, the observed correlation between NIH-31 diet with
urinary cadaverine suggest that NIH-31 diet may stimulate
the production of cadaverine in vivo, subsequently leading to
the increase of urinary 2-piperidone, especially in the
Cyp2e1-null mice. Thus, 2-piperidone metabolism is not only related
to CYP2E1 and other enzymes in the WT and Cyp2e1-null
mice but can also be altered in a diet-dependent manner. In
fact, it was reported that consuming food rich in polyphenols,
such as cocoa, tea, and fruit, can promote the production of
valerolactone, an analogue of 2-piperidone in human and rat
urine (
Jurikova et al., 2011
;
Schantz et al., 2010
;
Urpi-Sarda
et al
., 2009
). Overall, the results from animal and in vitro
incubation experiments in this study indicated that the observed
inverse correlation between 2-piperidone and CYP2E1 can be
attributed to the changes in the biosynthesis and degradation of
2-piperidone. Compared with the 2-piperidone metabolism in
the WT mice, the conversion of cadaverine to 2-piperidone was
higher, whereas the metabolism of 2-piperidone to
6-hydroxy-2-piperidone was lower in the Cyp2e1-null mice, leading to
the accumulation of 2-piperidone in the urine of Cyp2e1-null
mice. The putative metabolic events contributing to the inverse
correlation between urinary 2-piperidone and CYP2E1 are
outlined in
Figure 8
.
FIg. 6. The influence of 2-piperidone treatment and CYP2E1 activity on the production of 6-hydroxy-2-piperidone in vivo and in vitro. (A) WT mice were
treated with 0.1, 0.2, 1, 2, 10, and 20 mg/kg of 2-piperidone by ip injection. The influence of CYP2E1 inhibitor in vivo was examined by cotreatment with 20 mg/ kg disulfiram (DSF) coadministered by ip injection with 20 mg/kg of 2-piperidone. (***p < 0.001, compared with 0.1 mg/kg of 2-piperidone treatment; ###p < 0.001, compared with 20 mg/kg of 2-piperidone treatment). (B) 2-Piperidone ranging from 1 to 200µM was incubated with mouse liver microsomes (MLM) from control and acetone-treated WT mice. The influence of CYP2E1 inhibitor on microsomal incubation was examined by the cotreatment of 200µM disulfiram and 200µM 2-piperidone (***p < 0.001, compared with the incubation using control MLM).
FIg. 7. Identification of cadaverine as a source of 2-piperidone in vivo. (A) Separation of WT (●) and Cyp2e1-null (○) mice in a PCA model on GC-MS analysis of urine samples. (B) Contribution of cadaverine and 2-piperidone to the separation of WT and Cyp2e1-null mice in the S-plot of urinary metabolites. (C) Levels of 2-piperidone in the urine of WT and Cyp2e1-null mice after feeding cadaverine together with AIN-93G purified diet (***p < 0.001, compared with WT mice). (D) The production of 2-piperidone after incubating cadaverine with primary hepatocytes from the WT and Cyp2e1-null mice. No cadaverine was added in the control.
FIg. 8. Metabolic events contributing to the inverse correlation between urinary 2-piperidone and CYP2E1. Dietary 2-piperidone and endogenous cadaverine
are two sources of 2-piperidone in vivo and in the urine. (A) Biogenesis and metabolic fate of 2-piperidone in the WT mice. (B) Biogenesis and metabolic fate of 2-piperidone in the Cyp2e1-null mice.
The applicability of 2-piperidone as a noninvasive and
clini-cal biomarker of CYP2E1 activity requires further studies to
determine the correlation between CYP2E1 activity and the
content of urinary 2-piperidone in humans. Data from this
mouse-based study suggest that besides the factors that can
affect human CYP2E1 activities, such as genetic
polymor-phism and physiological status, the influence of human diet
on the biogenesis of 2-piperidone should also be considered.
Proper control of these experimental factors will likely reduce
the chance of identifying false positive or false negative
cor-relations between CYP2E1 and 2-piperidone.
In summary, this is the first study to investigate an
endogenous biomarker of CYP2E1 expression and activity
through metabolomics phenotyping of WT, Cyp2e1-null, and
CYP2E1
-humanized mice. The identification of a correlation
between the levels of 2-piperidone in urine and the activity
of CYP2E1 provides an opportunity to establish a clinically
applicable biomarker that can be used to monitor CYP2E1
activity through noninvasive measurements.
SuPPlEMEnTArY dATA
Supplementary data are available online at
http://toxsci.
oxfordjournals.org/
.
FundIng
National Cancer Institute Intramural Research Program.
rEFErEnCES
Abdelmegeed, M. A., Banerjee, A., Yoo, S. H., Jang, S., Gonzalez, F. J., and Song, B. J. (2012). Critical role of cytochrome P450 2E1 (CYP2E1) in the development of high fat-induced non-alcoholic steatohepatitis. J. Hepatol.
57, 860–866.
Aubert, J., Begriche, K., Knockaert, L., Robin, M. A., and Fromenty, B. (2011). Increased expression of cytochrome P450 2E1 in nonalcoholic fatty liver disease: Mechanisms and pathophysiological role. Clin. Res. Hepatol.
Gastroenterol. 35, 630–637.
Bardocz, S. (1993). The role of dietary polyamines. Eur. J. Clin. Nutr. 47, 683–690. Bondoc, F. Y., Bao, Z., Hu, W. Y., Gonzalez, F. J., Wang, Y., Yang, C. S., and
Hong, J. Y. (1999). Acetone catabolism by cytochrome P450 2E1: Studies with CYP2E1-null mice. Biochem. Pharmacol. 58, 461–463.
Callery, P. S., and Geelhaar, L. A. (1984). Biosynthesis of 5-aminopenta-noic acid and 2-piperidone from cadaverine and 1-piperideine in mouse. J.
Neurochem. 43, 1631–1634.
Caro, A. A., and Cederbaum, A. I. (2004). Oxidative stress, toxicology, and pharmacology of CYP2E1. Annu. Rev. Pharmacol. Toxicol. 44, 27–42. Catanzaro, I., Naselli, F., Saverini, M., Giacalone, A., Montalto, G., and
Caradonna, F. (2012). Cytochrome P450 2E1 variable number tandem repeat polymorphisms and health risks: a genotype-phenotype study in cancers associated with drinking and/or smoking. Mol. Med. Report 6, 416–420. Chen, C., Gonzalez, F. J., and Idle, J. R. (2007). LC-MS-based metabolomics
in drug metabolism. Drug Metab. Rev. 39, 581–597.
Chen, C., Krausz, K. W., Idle, J. R., and Gonzalez, F. J. (2008). Identification of novel toxicity-associated metabolites by metabolomics and mass isotopomer analysis of acetaminophen metabolism in wild-type and Cyp2e1-null mice.
J. Biol. Chem. 283, 4543–4559.
Cheung, C., Yu, A. M., Ward, J. M., Krausz, K. W., Akiyama, T. E., Feigenbaum, L., and Gonzalez, F. J. (2005). The cyp2e1-humanized transgenic mouse: Role of cyp2e1 in acetaminophen hepatotoxicity. Drug Metab. Dispos. 33, 449–457.
Emery, M. G., Jubert, C., Thummel, K. E., and Kharasch, E. D. (1999). Duration of cytochrome P-450 2E1 (CYP2E1) inhibition and estimation of functional CYP2E1 enzyme half-life after single-dose disulfiram administra-tion in humans. J. Pharmacol. Exp. Ther. 291, 213–219.
Ernstgård, L., Johanson, G., Karlsson, A. S., and Warholm, M. (2007). Phenotyping of cytochrome P450 2E1 in vitro and in vivo. Curr. Drug
Metab. 8, 493–498.
Ernstgård, L., Warholm, M., and Johanson, G. (2004). Robustness of chlor-zoxazone as an in vivo measure of cytochrome P450 2E1 activity. Br. J. Clin.
Pharmacol. 58, 190–200.
Gonzalez, F. J. (2005). Role of cytochromes P450 in chemical toxicity and oxidative stress: Studies with CYP2E1. Mutat. Res. 569, 101–110. Guengerich, F. P., and Cheng, Q. (2011). Orphans in the human cytochrome
P450 superfamily: Approaches to discovering functions and relevance in pharmacology. Pharmacol. Rev. 63, 684–699.
Johnson, C. H., Patterson, A. D., Idle, J. R., and Gonzalez, F. J. (2012). Xenobiotic metabolomics: Major impact on the metabolome. Annu. Rev.
Pharmacol. Toxicol. 52, 37–56.
Jones, J. P., Joswig-Jones, C. A., Hebner, M., Chu, Y., and Koop, D. R. (2011). The effects of nitrogen-heme-iron coordination on substrate affinities for cytochrome P450 2E1. Chem. Biol. Interact. 193, 50–56.
Jurikova, T., Rop, O., Mlcek, J., Sochor, J., Balla, S., Szekeres, L., Hegedusova, A., Hubalek, J., Adam, V., and Kizek, R. (2011). Phenolic profile of edible honeysuckle berries (genus lonicera) and their biological effects. Molecules
17, 61–79.
Lee, K. S., and Kim, S. K. (2013). Direct and metabolism-dependent cytochrome P450 inhibition assays for evaluating drug-drug interactions. J.
Appl. Toxicol. 33, 100–108.
Lee, S. S., Buters, J. T., Pineau, T., Fernandez-Salguero, P., and Gonzalez, F. J. (1996). Role of CYP2E1 in the hepatotoxicity of acetaminophen. J. Biol.
Chem. 271, 12063–12067.
León-Buitimea, A., Rodríguez-Fragoso, L., Lauer, F. T., Bowles, H., Thompson, T. A., and Burchiel, S. W. (2012). Ethanol-induced oxidative stress is associ-ated with EGF receptor phosphorylation in MCF-10A cells overexpressing CYP2E1. Toxicol. Lett. 209, 161–165.
Li, J., Wei, D. Q., Wang, J. F., Yu, Z. T., and Chou, K. C. (2012). Molecular dynamics simulations of CYP2E1. Med. Chem. 8, 208–221.
Lu, D., Yu, X., and Du, Y. (2011). Meta-analyses of the effect of cytochrome P450 2E1 gene polymorphism on the risk of head and neck cancer. Mol. Biol.
Rep. 38, 2409–2416.
Mahjoub, A., Hochlaf, M., Poisson, L., Nieuwjaer, N., Lecomte, F., Schermann, J. P., Grégoire, G., Manil, B., Garcia, G. A., and Nahon, L. (2011). Slow pho-toelectron spectroscopy of δ-valerolactam and its dimer. Chemphyschem 12, 1822–1832.
Naila, A., Flint, S., Fletcher, G., Bremer, P., and Meerdink, G. (2010). Control of biogenic amines in food–existing and emerging approaches. J. Food Sci.
75, R139–R150.
Reeves, P. G. (1997). Components of the AIN-93 diets as improvements in the AIN-76A diet. J. Nutr. 127(5 Suppl), 838S–841S.
Schafer, A., Galuppo, P., Fraccarollo, D., Vogt, C., Widder, J. D., Pfrang, J., Tas, P., Barbosa-Sicard, E., Ruetten, H., Ertl, G., et al. (2010). Increased cytochrome P4502E1 expression and altered hydroxyeicosatetraenoic acid
formation mediate diabetic vascular dysfunction: rescue by guanylyl-cyclase activation. Diabetes 59, 2001–2009.
Schantz, M., Erk, T., and Richling, E. (2010). Metabolism of green tea cat-echins by the human small intestine. Biotechnol. J. 5, 1050–1059.
Seglen, P. O. (1976). Preparation of isolated rat liver cells. Methods Cell Biol.
13, 29–83.
Seiler, N. (2004). Catabolism of polyamines. Amino Acids 26, 217–233. Sinclair, P. R., Gorman, N., Walton, H. S., Bement, W. J., Szakacs, J., Gonzalez,
F. J., Dalton, T. P., Nebert, D. W., and Sinclair, J. F. (2000). Relative roles of CYP2E1 and CYP1A2 in mouse uroporphyria caused by acetone. Arch.
Biochem. Biophys. 384, 383–390.
Sotsuka, T., Sasaki, Y., Hirai, S., Yamagishi, F., and Ueno, K. (2011). Association of isoniazid-metabolizing enzyme genotypes and
isoniazid-induced hepatotoxicity in tuberculosis patients. In Vivo 25, 803–812.
Trafalis, D. T., Panteli, E. S., Grivas, A., Tsigris, C., and Karamanakos, P. N. (2010). CYP2E1 and risk of chemically mediated cancers. Expert Opin.
Drug Metab. Toxicol. 6, 307–319.
Urpi-Sarda, M., Monagas, M., Khan, N., Lamuela-Raventos, R. M., Santos-Buelga, C., Sacanella, E., Castell, M., Permanyer, J., and Andres-Lacueva, C. (2009). Epicatechin, procyanidins, and phenolic microbial metabo-lites after cocoa intake in humans and rats. Anal. Bioanal. Chem. 394, 1545–1556.
Vesell, E. S., and Korsunsky, Z. (1998). Pedigree analysis of a subject with abnormally slow renal elimination of 6-hydroxychlorzoxazone.
![FIg. 2. Identification of 2-piperidone through a comparison of MS/MS spectra. MS/MS fragmentography is shown for the fragmentograms of urinary ion ([M + H] + = 100.077 m/z) (top) and 2-piperidone (bottom).](https://thumb-eu.123doks.com/thumbv2/123doknet/14891627.649528/4.891.77.796.98.615/identification-piperidone-comparison-spectra-fragmentography-fragmentograms-urinary-piperidone.webp)