Aged 50
–79 Years
Isabelle Peytremann-Bridevaux, MD, MPH, DSc
1,2and Brigitte Santos-Eggimann, MD, MPH, DrPH
11Health Services Research Unit, Institute for Social and Preventive Medicine, University of Lausanne (IUMSP), Lausanne, Switzerland;2Institute of Health Economics and Management, University of Lausanne (IEMS), Lausanne, Switzerland.
BACKGROUND: Although frequent contacts with health
care systems may represent more opportunities to
receive preventive services, excess body weight has
been linked to decreased access to preventive services
and quality of care.
OBJECTIVE: The objective of the study is to examine
whether obese and overweight, compared to normal
weight persons, have different experiences of preventive
care.
DESIGN: The study design is cross-sectional. Baseline
data (2004) of a population-based survey conducted in
10 European countries.
PARTICIPANTS: The participants were
noninstitution-alized adults, 13,859, (50–79 years) with body mass
index (BMI)
Q18.5 kg/m
2, who answered the baseline
and supplementary questionnaires (overall response
rate of 51.3%) of the Survey of Health, Ageing and
Retirement in Europe (SHARE).
MEASUREMENTS: BMI was divided into normal weight
(BMI, 18.5–24.9 kg/m
2), overweight (BMI, 25.0–29.9
kg/m
2), and obesity (BMI >30 kg/m
2). Reported
depen-dent variables were: influenza immunization, colorectal
and breast cancer screening, discussion and
recommen-dation about physical activity, and weight measurement.
We performed multivariate logistic regressions,
adjust-ing for age, sex, education, income, smokadjust-ing, alcohol
consumption, physical activity, and country.
RESULTS: Overweight and obesity were associated
with higher odds of receiving influenza immunization
but not with receipt of breast or colorectal cancer
screening. Overweight and obese individuals mentioned
more frequently that their general practitioner
dis-cussed physical activity or checked their weight, which
was not explained by chronic diseases or the number of
ambulatory care visits.
CONCLUSIONS: These first data from SHARE did not
suggest that overweight or obesity were associated with
decreased use of preventive services.
KEY WORDS: obesity; overweight; population-based study; preventive services.
DOI: 10.1007/s11606-007-0181-9
© 2007 Society of General Internal Medicine 2007;22:923–929
INTRODUCTION
Obesity is associated with a high incidence of chronic condi-tions,1–3high overall mortality, high mortality from cardiovas-cular diseases and cancers,4–7 and increased health care utilization.8–12 On the one hand, frequent contacts with the
health care systems may represent more opportunities to receive preventive services, on the other hand, because of systems’, patients’, physicians’, and/or societal factors, among others, excess body weight may be linked to decreased access to preventive services and quality of care. While prior studies demonstrated that obese women were less likely to receive breast, cervix, or colorectal cancer screening than normal weight women,13–21others showed conflicting results concerning influ-enza immunization.22–24 Most of those results were based on
data from the United States, and an overall European picture is lacking. In Europe, an almost universal population coverage by health insurance or social security may reduce differences in access to care between individuals with normal and excess weight. Indeed, compared to the more than 40 million uninsured US residents,25almost all Europeans are covered by a health insurance plan.26
We used nationally representative data from 10 countries participating in the Survey of Health, Ageing and Retirement in Europe (SHARE) to examine the association between body weight and receipt of preventive services. We were interested in targeting evidence-based preventive measures commonly performed, such as screening of breast and colorectal cancer, influenza vaccina-tion, weight checks, and physical activity recommendations. Our basic assumption was that these preventive services should be at least as frequent in overweight and obese as in normal weight individuals.
METHODS
Data Source and Participants
SHARE is a new international data source on ageing.27 In 2004, representative samples of noninstitutionalized indivi-duals aged 50 years and over were drawn from 10 European countries: Austria, Denmark, France, Germany, Greece, Italy, the Netherlands, Spain, Sweden, Switzerland (sampling frame An abstract presenting these results has been accepted for oral
presentation at the Annual Meeting of the American Public Health Association in Boston (“Health Services Research: Quality of Care and Patient Satisfaction” session, November 2006).
Received August 12, 2006 Revised January 25, 2007 Accepted March 16, 2007 Published online April 3, 2007
country-specific and fully described elsewhere28). A response
rate of 61.8% was obtained for the baseline interview data collection, varying across countries from 50.2 to 73.6%, except in Switzerland, which achieved only 37.6%28. To respondents
to the baseline questionnaire, a supplementary self-administered questionnaire was given that had to be filled in and sent back to the investigators. We pooled the responses from all 10 countries and restricted the sample to 17,303 respondents aged 50– 79 years. Of those, we excluded 438 (2.5%) persons with missing or implausible information regarding height, weight, or body mass index, and 170 (1%) underweight individuals [body mass index (BMI) <18.5 kg/m2]. Out of 16,695 individuals aged 50–79 years with a BMI <18.5 kg/m2, 13,859 (83%) responded to the supplementary self-administered naire (response rate to baseline and supplementary question-naire: 51.3%). Among those, 10,804 said they had a general practitioner (Fig.1).
Baseline SHARE data was collected both using standardized face-to-face interviews, which were conducted by specially trained interviewers, and using a self-administered supple-mentary questionnaire (entire generic English and translated survey questionnaires, available online: http://www.share-project.org/). Except for preventive service information, which came from the supplementary questionnaire, data included in this study were extracted from the baseline questionnaire.
Measurements
All measures were self-reported, including height and weight. BMI was calculated as the weight in kilograms divided by the square of the height in meters (kg/m2) and categorized into normal weight (BMI 18.5–24.9 kg/m2), overweight (BMI 25.0– 29.9 kg/m2), and obesity (BMI >30 kg/m2).
The following dependent variables (indicators of care) were abstracted from the supplementary questionnaire and dichot-omized (0/1): (1) colorectal cancer screening: we classified an individual (agedQ50 years and without history of colorectal cancer) as having had colorectal cancer screening if he/she reported having undergone endoscopic screening within the last 10 years. The question on which this was based was:“Have you ever had a sigmoidoscopy or colonoscopy? If so, about how long ago did you have the most recent one? Less than 10 years ago/10 or more years ago/never had any of these tests”; (2) breast cancer screening: based on the question:“If you are a woman: in the last 2 years, have you had a mammogram (x-ray of the breast)? Yes/no”, women aged Q50 years (without history of breast cancer) were classified as having been screened for breast cancer if they had had mammography during that period; (3) influenza vaccination: men and women aged 65 years or over were considered eligible for the analysis of influenza vaccination and were classified as having been immunized according to the question:“In the last year, have you had a flu vaccination? Yes/no”; (4) We considered general practitioners to have ever asked about physical activity, recommended physical activity, checked the patient’s weight, if the respondents answered“at every visit” or “at some visits”, vs “never”, to the following questions:“ How often does your general practitioner: ask how much physical activity you do? ... tell you that you should get regular exercise? ... check your weight?” This last set of data was only collected among the respondents who reported having a general practitioner.
The preventive services considered in this analysis were chosen because they have been recommended for many years by several international and national organizations and asso-ciations,29–31 and therefore, had enough time for
dissemina-tion by 2004. This is true for influenza immunizadissemina-tion, breast and colorectal cancer screening, and obesity screening. Recommendations concerning the counseling of physical activity in the general population diverge. While the United States Preventive Services Task Force (USPSTF)29 says that there is not enough evidence to recommend for or against physical activity, the American Heart Association suggests physicians advise their patients about it because of its relevance to many conditions.34Community recommendations
for the promotion of physical activity are now also proposed by the World Health Organization32 and the Commission of
European Communities.33
Individuals aged
50-79y,with
BMI > 18.5
n = 16 695
Respondents to
supplementary self-
administered
questionnaire
n = 13 859
(response rate to
baseline and
supplementary
questionnaires:
51.3%)
Non-respondents to
supplementary
self-administered
questionnaire
n = 2 836
Individuals having a
general practitioner
n = 10 804
Individuals do not
have a general
practitioner
n = 2 606
Missing data
n = 449
SHARE respondents
to baseline
questionnaire
(response rate:
61.8%)
The variables considered as potential confounders of the association between BMI and the receipt of preventive services were age, gender, socioeconomic status as measured by marital status, years of education and purchasing power parity-household income (euros) adjusted for the size of the household (ppp-household income),35current smoking,
phys-ical inactivity, excessive alcohol consumption, and country of residence. In a second step, we also used self-reported medical diagnosis of hypertension, heart diseases, diabetes, cholester-ol, arthritis, or the reported number of ambulatory care visits, to determine the extent to which associations could be explained by diseases known to be related to excess weight or by a higher number of health care opportunities.
Statistical Analysis
First, we compared the individuals’ characteristics across BMI categories, using Chi-squared tests and analysis of variance (ANOVA) for categorical and continuous variables, respectively.
Then, we built multiple logistic regression models to examine the relation between BMI and each separate dichotomous outcome, adjusting for the aforementioned potential confoun-ders.
The joint Wald test was used to evaluate interactions between BMI levels and country of residence, and BMI levels and gender. All analyses were performed on data weighted for age, gender, and nonresponse, to make the samples represen-tative of each country’s population. None of the variables considered had≥2% missing data, and P values<0.05 were considered significant.
RESULTS
Respondents (n=13,859) and nonrespondents (n=2,836) to the supplementary questionnaire did not differ when considering age, gender, employment, BMI, number of chronic diseases, smoking, and drinking status. However, respondents were slightly more likely to be married, have a better education, were wealthier, were more often physically active, and report a better subjective health.
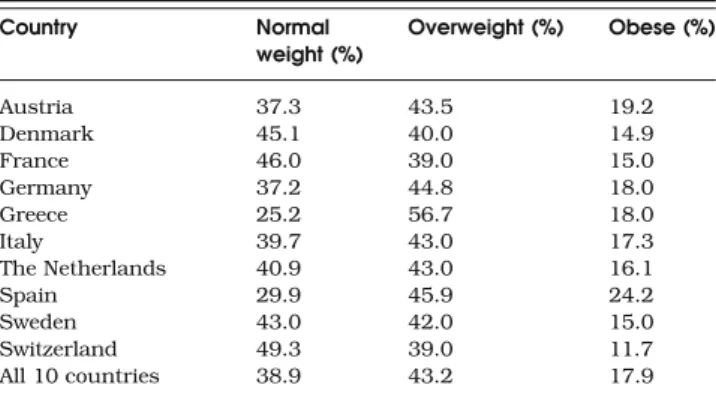
The estimated prevalence of overweight and obesity across the 10 European countries included in the SHARE baseline analysis were found to be highest in Austria, Germany, Greece and Spain (Table1). Table 2 summarizes the differences in selected characteristics, stratified by BMI category. Heavier individuals were more likely to be older, retired, less educated, physically inactive, and nonsmoker. Also, they reported more chronic diseases and symptoms, higher levels of physical disability, and declared a worse subjective health.
Of the eligible individuals, 50.9% reported influenza im-munization, 56.6% and 15% received breast and colorectal cancer screening, respectively, 55% had their weight checked at least once, and to 49% of the individuals, physicians recom-mended physical activity. The full description of the use of Table 1. Estimated Prevalence of Normal Weight (BMI 18.5–24.9),
Overweight (BMI 25.0–29.9), and Obesity (BMI>30.0) at the Age 50–79 years, by Country (n=13,859) Country Normal weight (%) Overweight (%) Obese (%) Austria 37.3 43.5 19.2 Denmark 45.1 40.0 14.9 France 46.0 39.0 15.0 Germany 37.2 44.8 18.0 Greece 25.2 56.7 18.0 Italy 39.7 43.0 17.3 The Netherlands 40.9 43.0 16.1 Spain 29.9 45.9 24.2 Sweden 43.0 42.0 15.0 Switzerland 49.3 39.0 11.7 All 10 countries 38.9 43.2 17.9
Table 2. Characteristics of the Studied Population, by BMI (n=13,859)
Characteristics Normal weight (BMI 18.5–24.9) Overweight (BMI 25.0–29.9) Obese (BMI≥30.0) P value*
(n=5,365) (n=6,043) (n= 2,451)
Age, mean (SD) 62.5 (0.2) 63.0 (0.2) 63.1 (0.3) 0.03
Aged > 65 years 41.1% 42.4% 44.0% 0.29
Years of education, mean (SD) 10.7 (0.1) 10.0 (0.1) 9.1 (0.2) <0.001
Married or registered partnership 70.0% 74.4% 69.5% 0.003
Retired 45.5% 49.5% 50.0% <0.001
Currently smoking 22.5% 19.2% 15.6% <0.001
Neither moderatenor vigorous physically active (physical inactivity)
7.9% 7.3% 11.6% 0.003
Drinking≥2 glasses of alcohol 5/6 days a week 16.7% 19.1% 15.2% 0.02
Number of chronic diseases <0.001
0 34.6% 24.6% 15.7%
1 33.9% 33.7% 28.5%
2 or more 31.5% 41.7% 55.8%
Number of health complaints <0.001
0 35.8% 31.8% 19.6%
1 34.0% 33.4% 30.1%
2 or more 30.1% 34.8% 50.3%
Good, fair or poor subjective health (vs excellent and very good)
68.1% 75.0% 84.8% <0.001
Difficulties in any of 5 activities of daily living 5.0% 7.2% 12.3% <0.001
Respondents having a general practitioner 89.5% 90.9% 92.9% <0.001
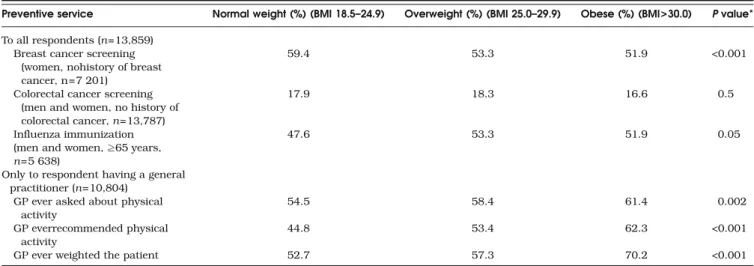
preventive services, by BMI group, shows the absence of association between body weight and the receipt of colorectal cancer screening and influenza immunization and a significant decrease of receipt of mammography with increasing BMI, while recommendations about physical activity and weight checks were significantly more frequent with higher BMI (Table3).
The adjusted odds ratios and 95% confidence interval for preventive care indicators are presented in Table 4. Neither overweight nor obesity was associated with decreased or increased receipt of cancer screening tests or influenza immunization for obese individuals. Only overweight was associated with 30% higher odds of receiving influenza immu-nization, but the association did not remain statistically significant when adjusting also for chronic conditions. For patients who reported having a general practitioner, over-weight and obese individuals mentioned significantly more frequently that their general practitioner asked about physical activity, recommended physical activity, or checked weight. These associations remained significant and decreased only slightly after further adjustment for chronic diseases or the annual number of ambulatory care visits. In addition to the presence of similar associations, subdividing obesity (BMI> 30 kg/m2) into obesity class I (BMI 30.0–34.9 kg/m2) and
obesity class II and III (BMI>35.0 kg/m2) revealed a “dose– response” relationship for the odds ratios previously shown to be significant.
The interaction between BMI categories and country of residence was only statistically significant (P value<0.01) for physical activity questions and recommendations and weight-ing of the patient. However, country-level analyses showed that estimated ORs for overweight and obesity were consistently >1, even though not always significant and of diverse magnitudes, except for France in two instances, where estimated odds ratios of overweight compared to normal weight individuals were <1 but not significant (GP ever asked about physical activity: 0.8, 95% CI 0.6–11; GP ever weighted the patient: 0.9, 95% CI 0.6–1.4). Statistical testing of the gender by BMI interaction was not significant, and gender-stratified analyses showed similar results both for men and women.
DISCUSSION
Our study findings suggest that in the European countries participating in the SHARE study, overweight and obesity did not represent a barrier to the receipt of preventives services. Table 4. Adjusted Odds Ratios for Preventive Services
Preventive service Overweight (BMI 25.0-29.9) Obesity (BMI>30.0)
Crude Adjusted* Crude Adjusted*
OR† 95% CI OR† 95% CI OR† 95% CI OR† 95% CI
To all respondents
Breast cancer screening (women, no history of breast cancer) 0.9 (0.8–1.1) 1.1 (0.9–1.3) 0.7 (0.5–0.8) 0.8 (0.7–1.1) Colorectal cancer screening (men and women, no history of
colorectal cancer)
1.0 (0.9–1.2) 1.1 (0.9–1.2) 0.9 (0.8–1.1) 1.0 (0.8–1.2) Influenza immunization (men and women,≥65 years) 1.3 (1.0–1.5) 1.2 (1.0–1.4) 1.2 (0.9–1.5) 1.2 (0.9–1.5) Only to respondent having a general practitioner
GP ever asked about physical activity‡ 1.2 (1.0–1.3) 1.2 (1.0–1.3) 1.3 (1.1–1.6) 1.4 (1.2–1.7) GP ever recommended physical activity‡ 1.4 (1.2–1.6) 1.4 (1.2–1.6) 2.0 (1.7–2.4) 2.1 (1.7–2.5)
GP ever weighted the patient 1.2 (1.1–1.4) 1.3 (1.1–1.5) 2.1 (1.8–2.5) 2.4 (2.0–2.9)
In bold: ORs with P-value<0.05
*Adjusting for age, gender, country, ppp-household income, education, current smoking, physical inactivity, and excessive alcohol consumption †Ref. category = BMI 18.5–24.9 kg/m2
‡Not adjusted for physical activity
Table 3. Use of Preventive Services, Across BMI Categories
Preventive service Normal weight (%) (BMI 18.5–24.9) Overweight (%) (BMI 25.0–29.9) Obese (%) (BMI>30.0) P value* To all respondents (n=13,859)
Breast cancer screening (women, nohistory of breast cancer, n=7 201)
59.4 53.3 51.9 <0.001
Colorectal cancer screening (men and women, no history of colorectal cancer, n=13,787)
17.9 18.3 16.6 0.5
Influenza immunization (men and women,≥65 years, n=5 638)
47.6 53.3 51.9 0.05
Only to respondent having a general practitioner (n=10,804)
GP ever asked about physical activity
54.5 58.4 61.4 0.002
GP everrecommended physical activity
44.8 53.4 62.3 <0.001
GP ever weighted the patient 52.7 57.3 70.2 <0.001
On the contrary, these results support our initial hypothesis suggesting that overweight and obese individuals would receive at least similar levels of preventive services than normal weight persons, because of the increased number of health care opportunities and the physicians’ awareness of the morbidity and mortality burden associated with excess weight. Similar trends were found for both gender and in all 10 countries despite their diverse health care systems and utilization patterns.
Strengths of our study included a large database of representative samples of noninstitutionalized individuals from 10 European countries and the use of standardized questionnaires and procedures. However, the data source had some potential limitations. First, height and weight were self-reported. Because persons generally overestimate their height and underestimate their weight, particularly if they are obese, BMI tends to be underestimated.36,37The true
percent-age of the overweight and obese population may therefore be higher than our estimates. Second, selection bias cannot be ruled out because respondents to the supplementary ques-tionnaire showed slightly more favorable health and health-related attitudes and because the overall response rate to the latter was moderate (51%), particularly due to a poor partici-pation in Switzerland. Nonetheless, the age, sex, subjective health, and BMI characteristics of the Swiss sample were similar to those of the 2002 Swiss Health Care Survey (unpublished results). In addition, results of the country-level analysis were the same, in spite of differences in the countries’ response rates. Third, because of the unavailability of stratum and cluster information, we could not completely take into account SHARE’s complex survey design, and our variances might have been underestimated. However, as we did not found a significant association between BMI and cancer screening or influenza immunization, and the calculated 95% CI of the significant associations were relatively small, our results and discussion should be robust to slightly larger variances. Finally, the use of self-reported data could result in reporting and/or recall biases, which are however, unlikely to be different across BMI categories. This non-differential misclassification across BMI classes may also be true for colorectal cancer screening time windows, which were longer than those usually considered (10 years limits considered in our study, instead of sigmoidos-copy every 5 years and colonossigmoidos-copy every 10 years).38
Our results run counter to the BMI-screening association observed in population-based studies from the United States and elsewhere, which showed obesity-related screening dis-parities: multifactorial causes delayed and/or prevented the receipt of preventive services of excess weight individ-uals.13–15,18,20 There could be several explanatory hypotheses
for this. In fact, differences in health insurance coverage (almost universal health insurance coverage in Europe in contrast to the more than 40 millions of un- or underinsured U.S. residents25,26) may explain inequalities in health care accessibility. However, adjustment for insurance status did not fully explain the negative associations found in the United States,13–15,18,20 and Amy39 recently suggested that low
screening rates among obese American women were not necessarily a consequence of decreased health care access, as 90% of their study participants had health insurance. In addition, studies from European countries with almost uni-versal health insurance coverage showed conflicting results. In Germany40and Australia,19but not in Spain,23authors found
negative associations between BMI and preventive services. However, these later three studies did not adjust for insurance status. Then, residual and/or unmeasured confounding by socioeconomic status may still be present despite their adjust-ment in the modeling process. Because excess weight indivi-duals are more likely to have a lower socioeconomic status,41,42 the decreased odds ratios for preventive services may in fact reflect socioeconomic rather than weight-related differences, in these European studies. Other explanations could be study design differences (low vs high response rates; use of self-administered vs interview-based questionnaires) and/or the overall low uptake of screening test in SHARE compared to American studies, which could make it more difficult to detect differences between groups. The absence of decreased receipt of preventive services among obese, com-pared to normal weight Europeans, may also be because of Europe–United States possible differences in the prevalence of moderately and severely obese individuals, particularly of obesity classes II (BMI 35–39.9 kg/m2) and III (BMI>40 kg/ m2), which are more prevalent, and disproportionately in-creased in recent years in the United States.43 While in the United States, the adult prevalence of obesity class III was 4.8%,44and the veterans’ prevalence of obesity classes II and III was close to 9%,45the overall prevalence of obesity classes
II and III was only 4% among SHARE participants aged 50– 79 years. As barriers to health care seem to increase with BMI,39 this difference in the BMI distribution of Europeans
and Americans may have obscured a BMI-screening associ-ation mostly determined by extreme obesity. However, sub-sidiary analyses of SHARE data, looking at the specific effect of obesity class I and classes II–III, did not reveal different trends. Finally, we may hypothesize that weight bias and discrimination, shown to be present among health care professionals,46,47 and also reported by obese individuals
themselves,48–50 might be less pronounced in Europe than in the United States.
In conclusion, this study sheds light on the association between body weight and preventive services in the10 Euro-pean countries participating in SHARE. As expected from the greater disease burden of overweight and obese individuals, a trend towards an increased use of these services, even though not always of great magnitude and significance, was described, irrespective of the health care system and country considered. Generalization to other indicators of quality of care is however not possible. Therefore, further research is needed to reexam-ine this issue in Europe, to assess health care accessibility and quality in other domains of care.
Acknowledgments: This paper uses data from the early release 1 of SHARE 2004. The SHARE data collection has been primarily funded by the European Commission through the 5th framework program (project QLK6-CT-2001-00360 in the thematic program Quality of Life). Additional funding came from the US National Institute on Aging (U01 AG09740-13S2, P01 AG005842, P01 AG08291, P30 AG12815, Y1-AG-4553-01, and OGHA 04-064). Data collection in Austria (through the Austrian Science Fund, FWF), Belgium (through the Belgian Science Policy Office) and Switzerland (through BBW/OFES/UFES) was nationally funded. The SHARE data set is introduced in Börsch-Supan et al. (2005)51;
methodolog-ical details are contained in Börsch-Supan and Jürges (2005)28.”
Corresponding Author: Isabelle Peytremann-Bridevaux, MD, MPH, DSc; Health Services Research Unit, IUMSP, 17 Bugnon, CH-1005, Lausanne, Switzerland (e-mail: [email protected]).
REFERENCES
1. Field AE, Coakley EH, Must A, et al. Impact of overweight on the risk of developing common chronic diseases during a 10-year period. Arch Intern Med. 2001;161:1581–6.
2. Lean ME, Han TS, Seidell JC. Impairment of health and quality of life using new US federal guidelines for the identification of obesity. Arch Intern Med. 1999;159:837–43.
3. Must A, Spadano J, Coakley EH, Field AE, Colditz G, Dietz WH. The disease burden associated with overweight and obesity. JAMA. 1999;282:1523–9.
4. McGee DL. Body mass index and mortality: a meta-analysis based on person-level data from twenty-six observational studies. Ann Epidemiol. 2005;15:87–97.
5. Flegal KM, Graubard BI, Williamson DF, Gail MH. Excess deaths associated with underweight, overweight, and obesity. JAMA. 2005;293:1861–67.
6. Calle EE, Rodriguez C, Walker-Thurmond K, Thun MJ. Overweight, obesity, and mortality from cancer in a prospectively studied cohort of U. S. adults. N Engl J Med. 2003;348:1625–38.
7. Calle EE, Thun MJ, Petrelli JM, Rodriguez C, Heath CW, Jr. Body-mass index and mortality in a prospective cohort of U.S. adults. N Engl J Med. 1999;341:1097–1105.
8. Raebel MA, Malone DC, Conner DA, Xu S, Porter JA, Lanty FA. Health services use and health care costs of obese and nonobese individuals. Arch Intern Med. 2004;164:2135–40.
9. Andreyeva T, Sturm R, Ringel JS. Moderate and severe obesity have large differences in health care costs. Obes Res. 2004;12:1936–43. 10. Luchsinger JA, Lee WN, Carrasquillo O, Rabinowitz D, Shea S. Body
mass index and hospitalization in the elderly. J Am Geriatr Soc. 2003;51:1615–20.
11. Guallar-Castillon P, Lopez GE, Lozano PL, et al. The relationship of overweight and obesity with subjective health and use of health-care services among Spanish women. Int J Obes Relat Metab Disord. 2002;26:247– 52.
12. Quesenberry CP, Jr., Caan B, Jacobson A. Obesity, health services use, and health care costs among members of a health maintenance organization. Arch Intern Med. 1998;158:466–72.
13. Zhu K, Wu H, Jatoi I, Potter J, Shriver C. Body mass index and use of mammography screening in the United States. Prev Med. 2006;42:381– 5.
14. Wee CC, Phillips RS, McCarthy EP. BMI and cervical cancer screening among white, African-American, and Hispanic women in the United States. Obes Res. 2005;13:1275–80.
15. Wee CC, McCarthy EP, Davis RB, Phillips RS. Obesity and breast cancer screening. J Gen Intern Med. 2004;19:324–31.
16. Heo M, Allison DB, Fontaine KR. Overweight, obesity, and colorectal cancer screening: disparity between men and women. BMC Public Health. 2004;4:53.
17. Rosen AB, Schneider EC. Colorectal cancer screening disparities related to obesity and gender. J Gen Intern Med. 2004;19:332–8. 18. Fontaine KR, Heo M, Allison DB. Body weight and cancer screening
among women. J Womens Health Gend Based Med. 2001;10:463–70. 19. Reidpath DD, Crawford D, Tilgner L, Gibbons C. Relationship between
body mass index and the use of healthcare services in Australia. Obes Res. 2002;10:526–31.
20. Wee CC, McCarthy EP, Davis RB, Phillips RS. Screening for cervical and breast cancer: is obesity an unrecognized barrier to preventive care? Ann Intern Med. 2000;132:697–704.
21. Fontaine KR, Faith MS, Allison DB, Cheskin LJ. Body weight and health care among women in the general population. Arch Fam Med. 1998;7:381–4.
22. Ostbye T, Taylor DH, Jr., Yancy WS, Jr., Krause KM. Associations between obesity and receipt of screening mammography, Papanicolaou tests, and influenza vaccination: results from the Health and Retirement
Study (HRS) and the Asset and Health Dynamics Among the Oldest Old (AHEAD) Study. Am J Public Health. 2005;95:1623–30.
23. Leon-Munoz LM, Guallar-Castillon P, Lopez GE, Banegas JR, Gutierrez-Fisac JL, Rodriguez-Artalejo F. Relationship of BMI, waist circumference, and weight change with use of health services by older adults. Obes Res. 2005;13(8):1398–1404.
24. Stehr-Green PA, Sprauer MA, Williams WW, Sullivan KM. Predictors of vaccination behavior among persons ages 65 years and older. Am J Public Health. 1990;80:1127–9.
25. Kuttner R. The American health care system. Health insurance coverage. N Engl J Med. 1999;340:163–8.
26. Private health insurance in OECD countries: the benefits and costs for individuals and health systems. Paris: OCDE; 2004.
27. Börsch-Supan A, Hank K, Jürges H. A new comprehensive and international view on ageing: introducing the“Survey of Health, Ageing and Retirement in Europe”. Eur J Ageing. 2005;2:245–53.
28. Borsch-Supan A, Jürges H (eds). The survey of health, ageing and retirement in Europe: Methodology. Mannheim: Mannheim Research Institute for the Economics of Aging (MEA); 2005.
29. U.S. Preventive Services Task Force. The guide to clinical preventive services. Washington, DC: Agency for healthcare research and quality; 2005.
30. Recommendations on cancer screening in the European Union. Advisory committee on cancer prevention. Available at: http://ec.europa.eu/ health/ph_determinants/genetics/cancer_screening_en.pd. Accessed January 16, 2007.
31. Aymard M, Cox NJ, Dubois G, et al. Recommendations on the 7th European meeting of influenza and its prevention. Eur J Epi. 1994;4:525– 6.
32. World Health Organization. A guide for population-based approaches to increasing levels of physical activity : implementation of the WHO global strategy on diet, physical activity and health. WHO 2007.
33. Green Paper. Promoting healthy diets and physical activity: a Europe-an dimension for the prevention of overweight, obesity Europe-and chronic diseases. Available at: http://ec.europa.eu/health/ph_determinants/ life_style/nutrition/documents/nutrition_gp_en.pdf. Accessed January 16, 2007.
34. Fletcher GF. How to implement physical activity in primary and secondary prevention. A statement for healthcare-professionals from the Task Force on Risk-reduction, American Heart Association. Circula-tion. 1997;96:355–7.
35. Huisman M, Kunst AE, Mackenbach JP. Socioeconomic inequalities in morbidity among the elderly; a European overview. Soc Sci Med. 2003;57:861–73.
36. Connor Gorber S, Tremblay M, Moher D, Gorber B. A comparison of direct vs. self-reported measures for assessing height, weight and body mass index: a systematic review. Obes Rev Published article online 26-Jan-2007, doi10.1111/j.1467-789X.2007.00347.x
37. Rowland ML. Self-reported weight and height. Am J Clin Nutr. 1990;52:1125–33.
38. Winawer S, Fletcher R, Rex D, et al. Colorectal cancer screening and surveillance: clinical guidelines and rationale—update based on new evidence. Gastroenterology. 2003;124:544–60.
39. Amy NK, Aalborg A, Lyons P, Keranen L. Barriers to routine gynecological cancer screening for White and African-American obese women. Int J Obes (Lond). 2006;30:147–55.
40. Meisinger C, Heier M, Loewel H. The relationship between body weight and health care among German women. Obes Res. 2004;12:1473–80. 41. Molarius A, Seidell JC, Sans S, Tuomilehto J, Kuulasmaa K.
Educational level, relative body weight, and changes in their association over 10 years: an international perspective from the WHO MONICA Project. Am J Public Health. 2000;90:1260–8.
42. Stunkard AJ, Sorensen TI. Obesity and socioeconomic status—a complex relation. N Engl J Med. 1993;329:1036–7.
43. Sturm R. Increases in clinically severe obesity in the United States, 1986–2000. Arch Intern Med. 2003;163:2146–8.
44. Ogden CL, Carroll MD, Curtin LR, McDowell MA, Tabak CJ, Flegal KM. Prevalence of overweight and obesity in the United States, 1999– 2004. JAMA. 2006;295:1549–55.
45. Arterburn DE, McDonell MB, Hedrick SC, Diehr P, Fihn SD. Associ-ation of body weight with condition-specific quality of life in male veterans. Am J Med. 2004;117:738–46.
46. Brown I. Nurses’ attitudes towards adult patients who are obese: literature review. J Adv Nurs. 2006;53:221–32.
47. Schwartz MB, Chambliss HO, Brownell KD, Blair SN, Billington C. Weight bias among health professionals specializing in obesity. Obes Res. 2003;11:1033–9.
48. Schwartz MB, Vartanian LR, Nosek BA, Brownell KD. The influence of one’s own body weight on implicit and explicit anti-fat bias. Obesity (Silver Spring) 2006;14:440–7.
49. Rogge MM, Greenwald M, Golden A. Obesity, stigma, and civilized oppression. ANS Adv Nurs Sci. 2004;27:301–15.
50. Carr D, Friedman MA. Is obesity stigmatizing? Body weight, perceived discrimination, and psychological well-being in the United States. J Health Soc Behav. 2005;46:244–59.
51. Börsch-Supan A, Jürges H (eds). Health, ageing and retirement in Europe: first results from the survey of health, ageing and retirement in Europe. Mannheim Research Institute for the Economics of Ageing (MEA); 2005.