Advance Access Publication 24 July 2012
Bite force and its association with stability following Class II/1
functional appliance treatment
Gregory S. Antonarakis
*
,**
Heidrun Kjellberg
*
and Stavros Kiliaridis
**
*Department of Orthodontics, Institute of Odontology, The Sahlgrenska Academy, University of Gothenburg, Sweden and **Department of Orthodontics, School of Dentistry, University of Geneva, Switzerland
Correspondence to: Gregory S. Antonarakis, Department of Orthodontics, School of Dentistry, University of Geneva, 19, rue Barthélemy-Menn, 1205 Geneva, Switzerland. E-mail: [email protected]
SUMMARY The aims of this study were to investigate the value of pre-treatment maximal molar bite force as
a predictive variable in determining post-treatment changes and stability following functional appliance treatment in Class II malocclusion children. Twenty-eight Class II malocclusion children having undergone functional appliance treatment were followed for at least 1 year post-treatment. Maximal molar bite force measurements, lateral cephalograms, and study casts were taken before treatment, after treatment, and after post-treatment follow-up. Relationships between pre-treatment maximal molar bite force and dental or cephalometric changes post-treatment were examined. Patients were divided into stable and unstable groups, based on dental sagittal changes (overjet and molar relationship), and differences between the two groups of patients determined.
Post-treatment changes varied widely. Thirteen children showed dentoalveolar sagittal relapse, namely a shift in molars towards a Class II relationship and an increase in overjet, while 15 did not. The unstable group demonstrated a lower pre-treatment maximal molar bite force, as well as a more obtuse gonial angle, than the stable group. The gonial angle was found to be negatively correlated to maximal molar bite force and may thus be a cephalometric indicator partly reflecting the functional condition of the masticatory muscles.
Children with a lower pre-treatment maximal molar bite force were more prone to dentoalveolar sagittal relapse following functional appliance treatment.
Introduction
Long-term stability following Class II malocclusion treat-ment is the fundatreat-mental key to a successful treattreat-ment out-come, and of prime concern for patients and orthodontists alike. A large amount of variability is seen between patients as regards post-treatment changes, implying that in some patients the result is stable while in others this is not the case. Relapse, however, cannot be predicted at an individ-ual level. In some patients, relapse tendencies are inevita-ble, but their extent and clinical significance are variable (Herzberg, 1973; Fidler et al., 1995).
Several factors have been proposed to explain variability in the stability of treatment results. A major factor contribut-ing to stability is the growth pattern of the patients ( Ormis-ton et al., 2005). A favourable growth pattern, in addition to correct diagnosis, treatment, and retention protocols in mo-tivated patients, probably increases the likelihood of stable long-term treatment results (Lerstøl et al., 2010). Prediction of relapse and/or stability after orthodontic treatment seems to be difficult as the dentition constantly changes through-out life, with or withthrough-out orthodontic treatment (Bondevik, 1998). Besides growth, forces derived from the surrounding orofacial tissues are believed to promote stability (Melrose and Millet, 1998). When dental changes are in harmony
with the tongue and facial muscles, the result is thought to be more stable (Nanda et al., 1993).
Good occlusal intercuspidation following Class II mal-occlusion treatment has been reported to be necessary to prevent skeletal and dental relapse (Pancherz, 1991; Wies-lander, 1993). Nanda et al. (1993) suggest good occlusion and cuspal interdigitation, a constant intercanine width, and no proclination of the lower incisors as some of the most im-portant factors for long-term stability following orthodontic treatment. Intercuspidation, as a proposed factor affecting stability, would come into play when the teeth are in oc-clusion. In healthy patients without parafunctions, the teeth come into occlusion during mastication and swallowing, and forces derived from the masticatory musculature and the soft tissues are important in performing these functions.
A factor that may, therefore, influence the stability of treatment results, following functional appliance treatment in Class II malocclusion children, is the functional capacity of the masticatory muscles. These muscles, which are directly involved in the mode of action of functional appliances, may also play a role in determining the post-treatment effects once the functional appliance is discontinued.
The aim of this study was to investigate the predict-ive value of pre-treatment masticatory muscle functional
capacity, as evaluated by maximal molar bite force meas-urements, in determining post-treatment changes, and re-lapse potential, following functional appliance treatment in Class II division 1 malocclusion children.
Material and methods
Subjects
Twenty-eight children in the mixed dentition and with a Class II division 1 malocclusion (16 male and 12 female), between the ages of 8.5 and 14.2 (mean age 10 years 6 months) at the start of the study, were chosen according to the following criteria: the presence of a skeletal Class II relationship (ANB > 4°), a retrognathic mandible (SNB ≤ 78°), a distal molar relationship of at least one premolar cusp width on one side and half premolar cusp width on the other side, an overjet ≥6 mm, and no transverse discrepan-cies. This sample of children was derived from a larger sam-ple of Class II division 1 malocclusion children mentioned in Kjellberg et al. (1995).
Treatment procedure and experimental design
The children were treated with an activator according to
Schwarz (Graber and Neumann, 1977) by a single
opera-tor (HK) for a period of approximately 1 to 2 years (mean, 1.6 years; SD, 0.4). They were subsequently followed for at least 1 year after the completion of treatment (mean, 2.2 years; SD, 0.9) without any further fixed appliance or other treatment during this period. Before treatment (T1), after treatment (T2), and after the post-treatment follow-up pe-riod (T3), height measurements, maximal molar bite force measurements, maximal finger force measurements, lateral cephalograms, and impressions for study casts were taken.
Bite force
The maximum voluntary molar bite force (measured in Newtons) was determined using a bite force recorder as described by Helkimo et al. (1975). The subject was seated upright, the bite fork placed between the first molars on each side, and instructed to bite as hard as possible, with-out inflicting pain. All recordings were made twice in each position. To obtain as high bite force levels as possible, the subjects were encouraged to ‘do their best’. The highest value recorded was used as the maximum bite force level.
Maximal finger force, as an indicator of general muscle force (Kiliaridis et al., 1993), was similarly recorded with the bite fork placed between the thumb and index fingers of both left and right hands, and recorded twice for each hand. The higher of the two values was recorded for each child.
Cephalometry
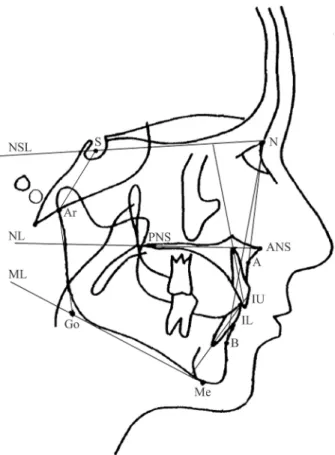
Lateral cephalograms were taken of all children in cen-tric occlusion using the same machine (Figure 1). The
radiographs obtained were digitized and analysed twice, by one operator (HK), using a computerized cephalomet-ric analysis (PC-DIG version 5.1 data system; Dr John McWilliam, Karolinska Institute, Stockholm, Sweden). The mean values between the two measurements were used in the study.
Study casts
Overjet, overbite, and molar relationships were measured by one operator (GA). The molar relationship was recorded as a percentage of the Angle Class II relationship. An Angle Class I relationship of molars was denoted by 0 per cent and a full Angle Class II relationship of molars was denoted
by 100 per cent (Staudt and Kiliaridis, 2010). Dental
developmental stage was recorded, using the classification of Thilander et al. (2001).
Stability
As an evaluation of post-treatment stability of dental chang-es, patients were separated into two groups, namely stable and unstable. Cases with a shift towards a Class II molar relationship (at least one molar was shifted ≥25 per cent to-wards a Class II molar relationship) and with an increase in
Figure 1 Landmarks and reference lines used in the cephalometric
analy-sis. S, sella; N, nasion; ANS, anterior nasal spine; PNS, posterior nasal spine; A, cephalometric point A; B, cephalometric point B; Me, menton; Ar, articulare; Go, Gonion; NSL, nasion-sella line; NL, maxillary line; ML, mandibular line; IU, upper incisor; IL, lower incisor.
overjet (≥0.5 mm) post-treatment were judged as unstable, whereas cases where no post-treatment relapse in overjet or molar relationship occurred were judged as stable. Cases where the molars were towards a Class III relationship after treatment and shifted to a Class I relationship after follow-up were judged as stable despite a shift in molar Class, since a Class I molar relationship was the final result. In cases that lost the second deciduous mandibular molars during the follow-up period, changes in overjet were given priority.
Statistics
All statistical analyses were performed using the Statis-tical Package for Social Sciences version 15.0 (SPSS Inc, Chicago, Illinois, USA). Maximal molar bite force and maximal finger force changes during the treatment and follow-up periods were evaluated using paired t-tests. Multiple regression analyses were used to determine possible correlations between initial maximal molar bite force and dental or cephalometric changes during the follow-up period, controlling for age, gender, and initial dental or cephalometric relationships. Since there was a rather large variation in the duration of the post-treat-ment follow-up period, changes were annualized and the statistical analyses were carried out with the annualized values. The correlations were considered significant at the
P < 0.05 level.
Considering the stable and unstable groups of patients, independent sample t-tests were performed looking at dif-ferences between the two groups in maximal molar bite force, height, height changes, age, age changes, dental developmental stage, dental and cephalometric variables, and dental and cephalometric changes. Chi-squared sta-tistics were used to evaluate the differences in gender, treatment dental developmental stage, as well as post-treatment intercuspidation (Class I molar versus Class II molar) between the stable and unstable groups.
Error of method
Dahlberg’s formula (Dahlberg, 1940) was used to deter-mine the error of the method for bite force, cephalometric, and study cast measurements. In using Dahlberg’s formula (√Σd2/2n), Σd2 denotes the sum of the squared differences
between pairs of recordings, while n denotes the number of duplicate measurements.
The methodological error for maximal molar bite force measurements was studied by repeated measurements of 20 randomly selected patients on two separate occasions, 2 to 4 weeks apart, and found to be 69 N.
The error of the method for the cephalometric and study cast variables was calculated by duplicate determinations on 15 randomly selected cephalometric radiographs and study casts with a 2-week interval between the measurements. For linear cephalometric measurements the error of the method did not exceed 0.7 mm, while for angular measurements
this did not exceed 0.9 degrees except for the incisal an-gle measurements, where the error varied from 1.0 to 1.5 degrees. For linear study cast measurements, the error of the method was 0.3 mm for both overjet and overbite. For the molar relationship measurements, the error of the method was 8 per cent (where 100 per cent represents a full cusp width).
Results
Dental development
The children at T1 were all in the mixed dentition phase, either the late-mixed dentition stage (20 children) or the early-mixed dentition stage (8 children). At T2, 11 of the children were in the late-mixed dentition stage while 17 of the children were in the permanent dentition stage.
Bite force and finger force changes
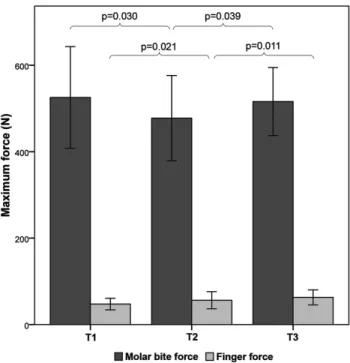
Maximal molar bite force was seen to decrease during the treatment period (T2–T1), while during the post-treatment period (T3–T2) maximal molar bite force increased, reach-ing approximately the pre-treatment levels. Freach-inger force, on the other hand, increased progressively throughout the treatment and post-treatment periods. No associations were found in this sample between bite force and either gender or age (Figure 2 and Table 1).
Figure 2 Maximal molar bite force and finger force measurements of the
patient sample. Bars represent means while whiskers represent standard deviations for each time period (T1, T2, T3). The P values for the differ-ences in maximal molar bite force and maximal finger force between the time periods are also shown.
Table 1 Maximal molar bite force and finger force changes in the patient sample.
T2–T1 T3–T2
Mean SD lower 95% CI upper 95% CI Mean SD lower 95% CI upper 95% CI Maximal molar bite
force changes (N)
–47.7 116.9 –90.6 –4.9 32.1 71.8 5.30 61.2
Finger force changes (N) 8.6 20.5 1.4 16.4 10.8 18.2 2.7 18.9
Maximal molar bite
force annualized changes (N) –29.7 66.1 –53.9 –5.5 13.5 53.7 2.7 36.2 Finger force changes
annualized (N) 4.9 13.3 0.1 9.8 5.5 12.1 0.2 10.9
Mean, standard deviation (SD), and 95% confidence interval (95% CI) values for maximal molar bite force and maximal finger force changes during the treatment (T1 to T2) and post-treatment (T2 to T3) periods are shown.
Dental and skeletal changes
The observed changes, after 1.6 mean years of functional appliance treatment, were characterized by an increase in SNB and subsequent decrease in ANB, a decrease in the intermaxillary angle (ML/NL), retroclination of maxillary and proclination of mandibular incisors, a decrease in overjet, and an improvement in molar relationships. The post-treatment response during the 2.2 mean years of follow-up varied. Some children showed relapse, namely a shift towards a Class II molar relationship and increase in overjet, while others showed no relapse or an improvement during the post-treatment period. Statistical significant post-treatment changes were the following: a closing of the mandibular plane angle, intermaxillary angle, and gonial angle, and a retroclination of the mandibular incisors (Table 2).
Regression analyses
Regression analyses did not show any significant correla-tions between pre-treatment (T1) maximal molar bite force and annualized cephalometric or dental changes during the post-treatment follow-up period (T3–T2) and when con-trolling for gender, age, and pre-treatment cephalometric values.
No correlations were found when looking at age, treat-ment (T2–T1) and post-treattreat-ment (T3–T2) duration, height, height changes, or dental developmental stage in relation to dental or cephalometric changes during the post-treatment follow-up period (T3–T2).
Stable and unstable groups
When cases were divided into stable or unstable, referring to their post-treatment (T3–T2) dental changes, the stable group consisted of 15 patients, while the unstable group consisted of 13 patients. The unstable group revealed a mean increase in overjet of 1.4 mm (SD, 0.9 mm), and a relapse of the molar sagittal relationship towards a Class II situation of 18.3 per cent (SD, 10.4 per cent). How was the
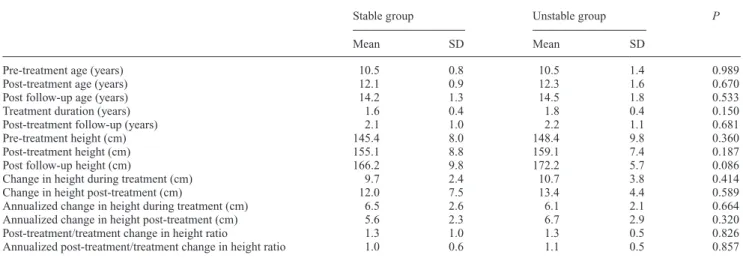
change in the stable group? No significant differences were found between the two groups as regards gender, dental developmental stage, age, treatment or post-treatment duration, height, and height changes (Table 3).
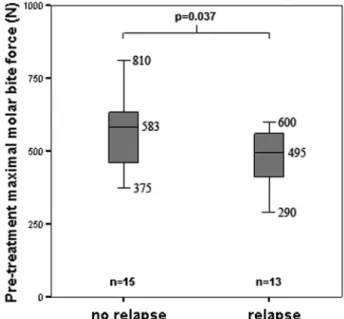
Cases judged as stable showed a significantly higher pre-treatment (T1) maximal molar bite force than those judged as unstable (Figure 3). Maximal molar bite force at T2 and T3, although higher in the stable group, did not show significant differences between the groups. When comparing initial (T1) dental and cephalometric charac-teristics, only the gonial angle showed a significant dif-ference (P = 0.035), where the unstable group presented a larger gonial angle pre-treatment than the stable group (Table 4). In this sample, pre-treatment maximal molar bite
Figure 3 Box plots of pre-treatment maximal molar bite force in the
sta-ble (no relapse) and unstasta-ble (relapse) groups. The boxes in the box plots display the lower quartile, median, and upper quartile. The whiskers display the smallest observation (minimum) and largest observation (maximum). The sample size in each group is indicated by n. The P value for the inde-pendent sample t-test comparing pre-treatment maximal molar bite force values in the two groups is also shown.
Table 2 Cephalometric and dental characteristics of the patient sample.
T1 T2 T3 T2–T1 P T3–T2 P
Mean SD Mean SD Mean SD Mean SD Mean SD
Sagittal (Cephalometric) SNA (°) 81.3 2.9 81.0 2.9 81.3 3.2 –0.3 1.3 0.641 0.3 1.1 0.898 SNB (°) 75.4 2.9 76.5 2.9 76.7 3.1 1.1 1.0 <0.001*** 0.2 1.2 0.440 ANB (°) 5.9 1.5 4.5 1.8 4.7 2.0 –1.4 0.9 <0.001*** 0.2 1.0 0.840 Vertical (Cephalometric) ML/NSL (°) 32.8 4.8 32.6 5.1 32.2 5.6 –0.2 1.4 0.274 –0.4 1.6 0.010* NL/NSL (°) 7.0 2.4 7.6 2.3 7.5 2.6 0.6 1.6 0.069 –0.1 2.2 0.690 ML/NL (°) 26.0 4.0 25.0 4.4 24.7 4.8 –1.0 1.8 0.018* –0.3 1.6 0.006**
Gonial angle (Ar–Go–Me) (°) 123.5 4.6 123.9 5.1 122.4 4.7 0.4 2.2 0.306 –1.5 2.6 0.001** Dental (Cephalometric)
IU/NL (°) 112.8 4.9 108.3 4.7 108.4 5.8 –4.5 4.3 <0.001*** 0.1 4.0 0.704
IL/ML (°) 98.4 5.2 99.6 5.0 97.8 4.7 1.2 3.9 0.041* –1.8 3.6 0.022*
Dental (Study models)
Overjet (mm) 8.6 1.2 4.4 1.3 4.7 1.2 –4.2 1.8 <0.001*** 0.3 1.3 0.196
Overbite (mm) 3.2 1.7 2.7 1.2 3.0 1.4 –0.5 1.0 0.008** 0.3 0.8 0.074
Left molar relationship (% Class II) 85.5 28.0 30.6 27.2 34.6 30.2 –54.9 40.0 <0.001*** 4.0 28.9 0.444 Right molar relationship (% Class II) 84.7 24.7 23.4 27.3 25.0 31.6 –61.3 34.1 <0.001*** 1.6 26.6 0.989 Average molar relationship (% Class II) 85.1 20.1 27.0 23.1 29.8 26.6 –58.1 31.0 <0.001*** 2.8 22.8 0.495 Mean and standard deviation (SD) values of measured cephalometric and dental variables are shown for each time period (T1, T2, T3) as well as for changes during the treatment (T1 to T2) and post-treatment (T2 to T3) periods. P-values (P) presented refer to the paired t-tests carried out. P < 0.05 is considered significant.
*P < 0.05; **P < 0.01; ***P < 0.001.
force showed significant correlation with the pre-treatment gonial angle (Pearson correlation, –0.386; P = 0.032).
Evaluating post-treatment (T2) overjet as a variable in determining relapse potential, no significant difference was found between the stable and unstable groups. Evalu-ating post-treatment (T2) intercuspidation as a variable in determining relapse potential, no differences were found in the presence of relapse of molars between those that fin-ished treatment in a Class I molar relationship versus those that finished treatment in a ≥25 per cent Class II molar relationship (Figure 4).
Discussion
In this patient sample, consisting of growing children with dental and skeletal Class II relationships treated with functional appliances, the post-treatment response varied. Some children showed relapse, while others showed a more stable post-treatment result. Bite force may be associated with sagittal stability of functional appliance treatment, whereby children with a lower pre-treatment maximal mo-lar bite force may be more prone to sagittal dentoalveomo-lar relapse.
Table 3 Age, treatment and post-treatment duration, height, and height changes in the two groups of patients (stable and unstable).
Stable group Unstable group P
Mean SD Mean SD
Pre-treatment age (years) 10.5 0.8 10.5 1.4 0.989
Post-treatment age (years) 12.1 0.9 12.3 1.6 0.670
Post follow-up age (years) 14.2 1.3 14.5 1.8 0.533
Treatment duration (years) 1.6 0.4 1.8 0.4 0.150
Post-treatment follow-up (years) 2.1 1.0 2.2 1.1 0.681
Pre-treatment height (cm) 145.4 8.0 148.4 9.8 0.360
Post-treatment height (cm) 155.1 8.8 159.1 7.4 0.187
Post follow-up height (cm) 166.2 9.8 172.2 5.7 0.086
Change in height during treatment (cm) 9.7 2.4 10.7 3.8 0.414
Change in height post-treatment (cm) 12.0 7.5 13.4 4.4 0.589
Annualized change in height during treatment (cm) 6.5 2.6 6.1 2.1 0.664
Annualized change in height post-treatment (cm) 5.6 2.3 6.7 2.9 0.320
Post-treatment/treatment change in height ratio 1.3 1.0 1.3 0.5 0.826
Annualized post-treatment/treatment change in height ratio 1.0 0.6 1.1 0.5 0.857 Means and standard deviations (SD) are shown. P-values (P) presented refer to the independent sample t-tests carried out.
Figure 4 Pie charts displaying the number and proportion of
post-treat-ment (T2) molars in a Class I compared to a ≥25 per cent Class II rela-tionship (on the left or right sides) that were stable or unstable during the follow-up period (T3–T2). A comparison between the two groups using a chi-squared test did not show statistical significance.
Table 4 Pre-treatment (T1) cephalometric and dental characteristics of the two groups of patients (stable and unstable).
Stable group Unstable group P
Mean SD Mean SD Sagittal (Cephalometric) SNA (°) 81.0 3.0 81.7 2.8 0.458 SNB (°) 75.3 3.0 75.5 2.9 0.830 ANB (°) 5.7 1.2 6.2 1.7 0.310 Vertical (Cephalometric) ML/NSL (°) 32.6 5.0 33.0 4.8 0.793 NL/NSL (°) 7.3 2.8 6.7 2.0 0.505 ML/NL (°) 25.6 4.2 26.4 4.0 0.627
Gonial angle (Ar–Go–Me) (°) 121.8 4.7 125.2 3.9 0.035*
Dental (Cephalometric)
IU/NL (°) 111.7 4.8 114.1 4.8 0.178
IL/ML (°) 98.4 4.8 98.4 5.7 0.994
Dental (Study models)
Overjet (mm) 8.3 1.2 8.8 1.1 0.250
Overbite (mm) 3.0 1.9 3.5 1.5 0.485
Left molar relationship (% Class II) 82.8 28.5 88.3 28.1 0.591
Right molar relationship (% Class II) 82.8 23.7 86.7 26.5 0.673
Average molar relationship (% Class II) 82.8 18.2 87.5 23.1 0.538
Means and standard deviations (SD) are shown. P-values (P) presented refer to the independent sample t-tests carried out. P < 0.05 is considered significant.
*P < 0.05.
Bite force changes
A stable occlusion has been shown to be a prerequisite for maximal muscle activity during biting (Ingervall and Egermark-Eriksson, 1979; Ingervall et al., 1979; Bakke and
Møller, 1980). During functional appliance treatment (T1– T2), maximal molar bite force decreased. This was possi-bly due to mild muscular atrophy because of the decreased functional activity of masticatory muscles, related to oc-clusal instability. This decreased functional activity showed a certain amount of recovery after the interruption of func-tional appliances, increasing post-treatment (T2–T3). This increase in maximal molar bite force is in all probability the result of normal growth, and may be associated with a gen-eral increase in muscle force, evaluated in this investigation by measuring finger force.
Bite force and post-treatment changes
It has been previously proposed that, generally speak-ing, individuals with a lower bite force or thinner masseter muscles seem to show a greater dentoalveolar sagittal change in response to functional appliance treatment ( Kiliaridis et
al., 2010; Antonarakis et al., 2012). The proposition put for-ward to explain this difference in treatment outcome is that the exertion of weaker masticatory forces may decrease the anchorage of the mandibular dentition, suggesting that it is easier to ‘jump’ the occlusion in those with a weaker bite force. Weaker masticatory forces in the present investigation were associated with a less stable dentoalveolar sagittal result and thus with a greater tendency towards relapse, namely an increase in overjet and a shift of the molar relationship to-wards a Class II. A possible reason for this difference may be that in those with a weaker bite force, even though it may be easier to jump the occlusion, it may also be more difficult to maintain the sagittal relationship, implying an easier shift
back towards a Class II relationship. This may be explained by the eruption pattern of teeth following different jaw rota-tions, namely that those with a forward rotation of the jaws show a resulting forward eruption path of the molars and a forward shift of the lower dental arch, as opposed to a more vertical or backward eruption path in those exhibiting a back-ward rotation (Björk and Skieller, 1972). Hence, children with a stronger bite force may show more forward eruption of the lower molars and hence a better chance for dentoal-veolar stability and conservation of the molar relationships.
Another possible reason for the differences is that bone density may also be important as regards stability. The man-dibular trabecular bone is subject to physiological remodel-ling throughout life, and can be influenced by masticatory demands (Jonasson and Kiliaridis, 2004), thus individuals with a lower bite force may exhibit lower bone density, and hence easier tooth movement. In rats, lower bone density has been associated with faster orthodontic tooth move-ment, than in those with significantly higher bone density (Bridges et al., 1988).
It is also interesting to note that the group of patients that showed a more unstable result post-treatment tended to have not only a weaker bite force pre-treatment, but also a more obtuse gonial angle. Ingervall and Helkimo (1978) found that individuals with a lower bite force have on average a more obtuse gonial angle than individuals with a higher bite force, which was also found in the present patient sample. The gonial angle can be assumed to be a cephalometric in-dicator partly reflecting the initial condition and functional capacity of the masticatory muscles. Different responses post-treatment in individuals with obtuse or acute gonial angles may not be due to the cephalometric difference as such, but rather to the functional capacity of the masicatory muscles, investigated by measuring bite force. The gonial angle is known to be an adaptive morphological region of the mandible, which can adapt to function.
Our findings are in line with those of Pancherz and Anehus (1978), who found that the electromyographic ac-tivity from the temporal and masseter muscles seems to be less on average in patients who show relapse than in those where the treatment is considered stable.
Comments on material and methods
Maximal molar bite force measurements are associated with a rather large type II error that might mask possible associations. No associations were found in the present sample between initial bite force and either gender, age, or dental developmental stage. Bite force variation in the pre-sent patient sample was thus due principally to individual variation rather than to heterogeneity of the sample. Gender, at the ages of the children examined, does not seem to have an important influence on bite force (Kiliaridis et al., 1993).
The sample size of this study is limited. This is especially true when dividing the patients into two groups, namely stable and unstable, thus diminishing the statistical power
of the study. When performing independent sample t-tests to detect differences between the two groups, the statistical power was approximately 75 per cent. The findings should thus be corroborated with further evidence.
Relapse and growth
All occlusal traits relapse gradually over time (Al Yami
et al., 1999). Changes obtained during the active treatment
period of a successful functional appliance therapy tend to relapse towards the initial malocclusion in the post-treatment years (DeVincenzo, 1991). It is not possible, however, to identify if relapse post-treatment is the result of actual relapse following orthodontic treatment alone, or the result of physiological changes in the dentition and sur-rounding tissues during the follow-up period (Bondemark
et al., 2007). Mandibular growth seems to be important both during and after active treatment. It has thus been proposed that significant long-term changes in occlusal relationships can be achieved with functional appliance therapy only when the functional treatment includes the growth spurt (Faltin et al., 2003). In the present patient sample, growth changes did not seem to influence stability.
Variation in post-treatment stability
Variation in post-treatment stability following Class II mal-occlusion treatment may depend on several factors besides growth, such as malocclusion severity, intercuspidation, molar change, and overjet reduction. Janson et al. (2004)
found that initial Class II malocclusion severity and molar relationship did not present any correlation with relapse, but that initial overjet did. Moreover, if there was a greater mo-lar change during treatment, this was less stable. Pancherz and Hansen (1986) also noticed that a greater molar change during treatment is more prone to relapse. Correspondingly,
Drage and Hunt (1990) found a small correlation between the amount of overjet corrected during functional appliance therapy and relapse. In this study, no such correlations were found. This may have been due to the small size of the sam-ple investigated or the short length of the follow-up period. Some authors suggest that good clinical intercuspida-tion is necessary to prevent skeletal and dental relapse (Pancherz, 1991; Nanda et al., 1993; Wieslander, 1993). This, however, was not found in this study when compar-ing relapse in patients who finished treatment in a Class I versus a 25–50 per cent Class II molar relationship, which is in accordance with Fidler et al.(1995). Ferguson (2010) maintains that post-treatment ideal sagittal molar intercus-pidation does not guarantee post-treatment stability.
Masticatory muscle factors and relapse
It is known that among growing individuals, the size of the masticatory muscles varies widely (Raadsheer et al., 1996). This variation in muscle thickness may imply a variation in bite force, which may explain in part the variation in
treatment and post-treatment outcomes. The masticatory muscles are thought to play a pivotal role not only in con-tributing to the etiology of malocclusions and the applica-tion of treatment mechanics but also in the potential success of treatment outcomes (Hunt, 2010) and perhaps in the sta-bility of treatment and post-treatment changes.
Conclusions
In this sample, children who showed dentoalveolar sagittal relapse following functional appliance treatment were more likely to have a lower bite force pre-treatment, as well as a more obtuse gonial angle. The functional capacity of the mas-ticatory muscles may play a role in contributing to the vari-ation seen as regards post-treatment outcomes and stability.
References
Al Yami E A, Kuijpers-Jagtman A M, van’t Hof M A 1999 Stability of orthodontic treatment outcome: follow-up until 10 years postretention. American Journal of Orthodontics and Dentofacial Orthopedics 115: 300–304
Antonarakis G S, Kjellberg H, Kiliaridis S 2012 Predictive value of molar bite force on Class II functional appliance treatment outcomes. Euro-pean Journal of Orthodontics 34: 244–249
Bakke M, Møller E 1980 Distortion of maximal elevator activity by unilat-eral premature tooth contact. Scandinavian Journal of Dental Research 88: 67–75
Björk A, Skieller V 1972 Facial development and tooth eruption. An implant study at the age of puberty. American Journal of Orthodontics 62: 339–383
Bondemark L et al. 2007 Long-term stability of orthodontic treatment and patient satisfaction. A systematic review. Angle Orthodontist 77: 181–191
Bondevik O 1998 Changes in occlusion between 23 and 34 years. Angle Orthodontist 68: 75–80
Bridges T, King A, Mohammed A 1988 The effect of age on tooth move-ment and mineral density in the alveolar tissues of the rat. American Journal of Orthodontics and Dentofacial Orthopedics 93: 245–250 Dahlberg G 1940 Statistical methods for medical and biological students.
Allen and Unwin, London
DeVincenzo J P 1991 Changes in mandibular length before, during, and after successful orthopedic correction of Class II malocclusions, using a functional appliance. American Journal of Orthodontics and Dentofacial Orthopedics 99: 241–257
Drage K J, Hunt N P 1990 Overjet relapse following functional appliance therapy. British Journal of Orthodontics 17: 205–213
Faltin K J, Faltin R M, Baccetti T, Franchi L, Ghiozzi B, McNamara J A Jr 2003 Long-term effectiveness and treatment timing for Bionator therapy. Angle Orthodontist 73: 221–230
Ferguson J W 2010 Changes in sagittal molar relationship during and after fixed appliance extraction treatment. Journal of Orthodontics 37: 16–28 Fidler B C, Årtun J, Joondeph D R, Little R M 1995 Long-term stabil-ity of Angle Class II, division 1 malocclusions with successful occlusal results at end of active treatment. American Journal of Orthodontics and Dentofacial Orthopedics 107: 276–285
Graber T M, Neumann B 1977 The activator: use and modifications. In: Graber T M and Neumann B (eds) Removable orthodontic appliances. Saunders, Philadelphia, pp. 213–215
Helkimo E, Carlsson G E, Carmeli Y 1975 Bite force in patients with func-tional disturbances of the masticatory system. Journal of Oral Rehabili-tation 2: 397–406
Herzberg R 1973 A cephalometric study of Class II relapse. Angle Ortho-dontist 43: 112–118
Hunt N P 2010 Introduction. Seminars in Orthodontics 16: 91
Ingervall B, Egermark-Eriksson I 1979 Function of temporal and masseter muscles in individuals with dual bite. Angle Orthodontist 49: 131–140 Ingervall B, Helkimo E 1978 Masticatory muscle force and facial
mor-phology in man. Archives of Oral Biology 23: 203–206
Ingervall B, Ridell A, Thilander B 1978 Changes in activity of the tem-poral, masseter and lip muscles after surgical correction of mandibular prognathism. International Journal of Oral Surgery 8: 290–300 Janson G, Caffer Dde C, Henriques J F, de Freitas M R, Neves L S 2004
Stability of Class II, division 1 treatment with the headgear activator combination followed by edgewise appliance. Angle Orthodontist 74: 594–604
Jonasson G, Kiliaridis S 2004 The association between the masseter mus-cle, the mandibular alveolar bone mass and thickness in dentate women. Archives of Oral Biology 49: 1001–1006
Kiliaridis S, Kjellberg H, Wenneberg B, Engström C 1993 The relationship between maximal bite force, bite force endurance, and facial morphol-ogy during growth. Acta Odontologica Scandinavica 51: 323–331 Kiliaridis S, Mills C M, Antonarakis G S 2010 Masseter muscle thickness
as a predictive variable in treatment outcome of the twin-block appliance and masseteric thickness changes during treatment. Orthodontics and Craniofac Research 13: 203–213
Kjellberg H, Fasth A, Kiliaridis S, Wenneberg B, Thilander B 1995 Crani-ofacial structure in children with juvenile chronic arthritis (JCA) com-pared with healthy children with ideal or postnormal occlusion. Ameri-can Journal of Orthodontics and Dentofacial Orthopedics 107: 67–78 Lerstøl M, Torgot O, Vandevska-Radunovic V 2010 Long-term stability of
dentoalveolar and skeletal changes after activator-headgear treatment. European Journal of Orthodontics 32: 28–35
Melrose C, Millett D T 1998 Toward a perspective on orthodontic reten-tion. American Journal of Orthodontics and Dentofacial Orthopedics 113: 507–514
Nanda R, Burzin J, Kim J M 1993 Factors influencing the stability of orthodontically treated dentitions. In: Hösl E, Baldauf A (eds). Reten-tion and long-term stability. 8th InternaReten-tional Conference for Orthodon-tists Hüthig, Heidelberg, pp. 41–46
Ormiston J P, Huang G J, Little R M, Decker J D, Seuk G D 2005 Retro-spective analysis of long-term stable and unstable orthodontic treatment outcomes. American Journal of Orthodontics and Dentofacial Orthope-dics 128: 568–574
Pancherz H 1991 The nature of Class II relapse after Herbst appliance treatment: a cephalometric long-term investigation. American Journal of Orthodontics and Dentofacial Orthopedics 100: 220–233
Pancherz H, Anehus M 1978 Masticatory function after activator treat-ment. An analysis of masticatory efficiency, occlusal conditions and EMG activity. Acta Odontologica Scandinavica 36: 309–316
Pancherz H, Hansen K 1986 Occlusal changes during and after Herbst treatment: a cephalometric investigation. European Journal of Ortho-dontics 8: 215–228
Raadsheer M C, Kiliaridis S, Van Eijden T M, Van Ginkel F C, Prahl-An-dersen B 1996 Masseter muscle thickness in growing individuals and its relation to facial morphology. Archives of Oral Biology 41: 323–332 Staudt C B, Kiliaridis S 2010 Association between mandibular asymmetry
and occlusal asymmetry in young adult males with Class III malocclu-sion. Acta Odontologica Scandinavica 68: 131–140
Thilander B, Pena L, Infante C, Parada S S, deMayorga C 2001 Preva-lence of malocclusion and orthodontic treatment need in children and adolescents in Bogota, Colombia. An epidemiological study related to different stages of dental development. European Journal of Orthodon-tics 23: 153–167
Wieslander L 1993 Long-term effect of treatment with the headgear-Herbst appliance in the early mixed dentition. Stability or relapse? American Journal of Orthodontics and Dentofacial Orthopedics 104: 319–329