DOI 10.1007/s00148-009-0267-2 O R I G I N A L P A P E R
Kids or courses? Gender differences in the effects
of active labor market policies
Michael Lechner· Stephan Wiehler
Received: 5 March 2008 / Accepted: 10 June 2009 / Published online: 6 November 2009
© Springer-Verlag 2009
Abstract We investigate active labor market programs in Austria. We find
only small effects, if any, for most of the programs. However, the programs may have unintended consequences for women. In particular for younger women, a key effect of the programs and one reason for the male–female effect differential that is observed in the literature is to reduce or postpone pregnancies and to increase their attachment to the labor force. Furthermore, the variables capturing pregnancies and times of parental leave play a key role in removing selection bias.
Keywords Active labor market policy· Matching estimation · Program
evaluation· Panel data
JEL Classification J68
Responsible editor: James Albrecht
The first author is also affiliated with ZEW, Mannheim, CEPR, London, IZA, Bonn, PSI, London, and IAB Nuremberg. Financial support by the Austrian Federal Ministry of Economics and Labor (BMWA) and by the European Commission is gratefully acknowledged. We benefited from many helpful comments from Johannes Schweighofer, Gottfried Wetzel (both BMWA), and from Helmut Mahringer (Austrian Institute of Economic Research). The data were prepared in cooperation with Helmut Scheer from SIEMENS Austria. A previous version of the paper has been presented in workshops at the BMWA in Vienna, at the Universities of Aarhus, Freiburg, and St. Gallen, and at IAB, Nuremberg, and SOFI, Copenhagen. We are grateful to the participants of those workshops for their helpful comments and suggestions.
M. Lechner (
B
)· S. WiehlerSwiss Institute for Empirical Economic Research (SEW), University of St. Gallen, Varnbüelstrasse 14, CH-9000 St. Gallen, Switzerland
1 Introduction
There seems to be a consensus emerging that women benefit more from labor market programs than men, e.g., see the surveys by Bergemann and van
den Berg (2006) for Europe and Heckman et al. (1999) for the USA. Our
comprehensive evaluation of the Austrian active labor market programs shows that the effect differentials disappear once information on pregnancies and parental leave is incorporated or once the analysis is focused on unemployed with age above 40 years where pregnancies and parental leaves are hardly an issue anymore.
Many recent European studies have emphasized the role of effect
hetero-geneity on the program level.1 In terms of participant heterogeneity Puhani
(1999) and Kluve et al. (1999, 2008) find sex-specific program effects for
Poland. Friedlander et al. (1997) and Heckman et al. (1999) feature sex
differences for the US and other western economies. Lechner et al. (2009)
look at employment effects for certain subgroups of participants in West Germany. They find effect heterogeneity with respect to residence, previous
occupation, and sex. For East Germany, Lechner et al. (2007) find that for
some training programs, the employment effects for women were much larger than for men. They attributed this heterogeneity to specifics of the selection process that resulted in a higher probability of men being trained with skills for the construction sector which then collapsed. However, such a precise identification of the reasons for gender differences is not always possible, and the puzzle remains in many other studies. Bergemann and van den Berg
(2006) survey 15 studies on effect differentials for men and women in Europe.
Thirteen of those studies report effect premia for women. Heckman et al.
(1999) survey 16 studies for the USA and also provide broad evidence for
effect premia for women in terms of earnings. The key explanations that are put forward are gender differences with respect to labor supply elasticity, eagerness to learn, responsiveness to wage changes, and with respect to the larger choice set for women, i.e., including times of parental leave in addition to work and leisure. Their overall conclusion is that labor market programs seem to work better for women in countries where the female labor force participation rate is relatively small, which is also the case in Austria.
1For job creation schemes in Switzerland, see Gerfin and Lechner (2002). Similar results appear
in Lechner and Wunsch (2009) and in Caliendo et al. (2004,2006,2008) for Germany. For wage or integration subsidies in Sweden, see Sianesi (2008) and Forslund et al. (2004) and for Switzerland in Lalive et al. (2008) and Gerfin et al. (2005). For business start-up programs in Sweden, we refer to Carling and Gustafson (1999). For training measures comprising formal qualification, further training of any kind, and retraining, see Richardson and van den Berg (2001) and Carling and Richardson (2004) for Sweden and Gerfin and Lechner (2002) and Hujer et al. (2005) for Switzerland and Germany. Lechner et al. (2009) investigate long-run effects for Germany. Winter-Ebmer and Zweimüller (1996), Hofer and Weber (2004a,b), and Lutz et al. (2005) investigate employment effects for different instruments of the Austrian ALMP.
Due to a unique and informative database of the Austrian labor force, we show that those estimated differentials between men and women consist of two components. The first component is a selection bias due to the lack of controlling for the occurrence of pregnancies before or at the start of the programs, leading to more pregnancies in the group of non-participants than in the group of participants. Thus, estimated effects that ignore this information show biases in favor of the programs. Second, the remaining differential in the employment effect appears because program participation postpones or reduces fertility, which in turn implies that programs have an adverse effect on other policies that are designed to foster birthrates. Once those two components are accounted for, the effect heterogeneity between men and women can be explained. In that context, it is interesting to note that information on pregnancy status has not been available in many studies
surveyed by Bergemann and van den Berg (2006). In addition, one third of
those studies even lacked information on dependent children. Thus, linking our findings to the latter study, we demonstrate that in countries like Austria
with a low female labor force participation rate,2 it is even more important
to have information about the outside opportunities of women, in particular times of parental leave.
The underlying data are made available by the Federation of Austrian Social Insurance Institutions and the Austrian Public Employment Service. We possess a rich set of information on the employment history, times of unem-ployment, the counseling process, personal characteristics, parental leaves, and times of program participation as well as regional characteristics. Assuming conditional independence of the selection mechanism and potential outcomes, we employ an advanced version of a semi-parametric matching estimator that is very popular in the policy evaluation literature and was used previously, for
instance, by Lechner et al. (2009).
The paper is organized as follows. Section2briefly summarizes the
institu-tional background of the Austrian labor market policy. Section3introduces
the underlying data and identification strategy as well as a first description of the population of interest. The estimation method and first results of
the program allocation analysis can be found in Section 4. Section 5shows
estimation results and omitted variable checks and Section 6 concludes.
Details concerning the data, the estimation method, and results are provided
in an Internet appendix that can be downloaded fromwww.sew/lechner/at.
2 Labor market policies in Austria
The Public Employment Service Act constitutes the legal foundation of the Austrian labor market policy. It determines the objectives of the Public
2Bergemann and van den Berg (2006) classify countries to have a low female labor force
Employment Service by defining the following six principles. (1) The Public Employment Service has to match job seekers and vacancies efficiently, (2) remove any barrier that prevents this matching, (3) increase the flow of information about potential matches, (4) mitigate quantitative and qualitative differences between labor demand and supply, (5) secure sustainable employ-ment, (6) and provide funds for the unemployed in case of a job loss. As many other countries, Austria uses active and passive labor market policies to implement those principles.
2.1 Passive labor market policy
Passive labor market policy in Austria is designed to cover earning losses caused by various types of non-employment. To receive unemployment benefit payments, the unemployed have to be registered at the Public Employ-ment Service, be eligible and willing to work, and have a predefined record of employment with unemployment insurance (UI) contributions. The pre-unemployment employment requirement is a cumulated UI contribution pe-riod of 52 weeks within the last 24 months for the first draw on benefits. Subsequent benefits require 28 weeks within the previous 12 months.
Ex-ceptions regarding age exist.3 The standard replacement ratio is 55% of the
former net income and the minimum entitlement period is 20 weeks. Extra payments depending on family status and the number of children may be added. After unemployment benefits expire, the unemployed are entitled to unemployment assistance if they are still available for work. Unemployment assistance payments are means-tested, but are not subject to a time limit. 2.2 Parental leave subsidies
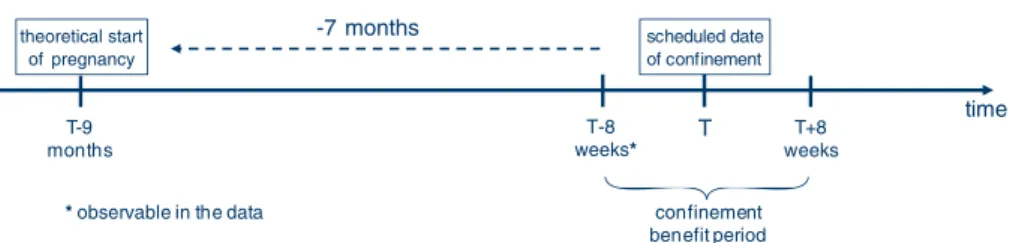
There are three different types of subsidies for women in parental leave. Eight weeks before and after the scheduled confinement, women receive so-called confinement benefits, which are granted up to the average net wage of the
previous 3 months.4After the expiration of those benefits (and before January
2002), women had to apply for parental leave benefits. This benefit was granted subject to the same UI contribution requirements as unemployment benefits, which excluded women who failed to prove the required previous contribution
times.5 After January 2002, women may apply for childcare benefit which is
no longer linked to previous contribution times and granted to everyone with
3The UB claim, for instance, for a 40-year-old unemployed person, who paid UI contributions for
312 weeks in the last 120 months, is 39 weeks. See the Internet appendix for a summary table of the various exceptions.
4Unemployed receive a fixed quota of currently 7.42 euros a day. Multiple births prolong the
period after confinement to 12 weeks.
5The default entitlement period was 549 days, which could be prolonged between July 2001 and
scheduled date of confinement T T+8 weeks T-8 weeks* confinement benefit period theoretical start of pregnancy T-9 months -7 months
* observable in the data
time
Fig. 1 Construction of the pregnancy start date
an amount of 14.53 euro a day for a maximum period of 30 months.6Eighteen
months of this entitlement period are counted as regular contribution times to the pension schemes. All periods in which such benefits have been paid out are recorded in the social security records. Therefore, this information is available in the current study. We use this information to construct the theoretical start date of a pregnancy by employing the usual 9-month pregnancy period as illustrated in Fig.1.
2.3 Active labor market policy
Apart from counseling and placement services, there are a variety of active labor market programs offered by the Public Employment Service in order to overcome specific reintegration obstacles of the unemployed.
The first group of programs promotes vocational flexibility. Those programs can be classified into orientation measures, active job search, job coaching, and qualification measures. Orientation measures assess the individual situation and aptitude of the unemployed person and serve as an upfront decision process for subsequent (re-)integration activities. Active job search aims at improving job acquisition skills, like writing an application or interview training. Job coaching deals with the long-term unemployed and groups with specific placement handicaps, like disabled persons, by means of a combination of counseling, qualification, and on-the-job training. Qualification measures comprise further education and various forms of vocational training. The range of program stretches from courses requiring only basic skill levels, like catering courses, to high-level software courses and up to formal educational and vocational degrees. Participants are either allocated by the Public Employment Service or find a program on their own and then apply for course subsidies with the Public Employment Office.
Another group of programs consists of the so-called job creation schemes. Socioeconomic enterprises and non-profit sector projects are designed to cap-ture the long-term unemployed individuals and other problematic cases, like,
6If the parents share child care times, the maximum entitlement period is prolonged to 36 months.
If they fail to prove regular medical consultations, child care benefits are reduced to 7.27 euros per day. Extra earnings are allowed up to a maximum of 14.600 euros per year without leading to a reduction in benefits.
for instance, individuals with psychological diseases, etc. Such programs offer a quasi-realistic work environment. In principle, those jobs are restricted to 1 year. They are sometimes augmented by socio-pedagogical treatment to gradually reintegrate the participants into the regular labor market. With integration subsidies, the Public Employment Service supports special groups of unemployed, like the disabled, long-term unemployed, or older people, by means of a wage subsidy for the first 150 days of a new employment. Encouraging individuals to become self-employed, the Public Employment Service offers the so-called business start-up program, which supports young entrepreneurs starting with a business idea until the actual foundation of their own firm. Furthermore, the Public Employment Service supports young individuals who have been searching unsuccessfully for an apprenticeship by providing different courses aimed at endowing the participants with human capital that is similar to the level of the first year of a regular apprenticeship of 3 years. A hybrid form of labor market programs is the so-called beneficence for labor, which is organized in collaboration with local firms in order to compensate sudden local excess demand or supply of workers caused by,
e.g., business foundation or sudden firm closures.7 Finally, there are also
qualification programs for employees to enhance sustainable employment for workers threatened by unemployment.
To get an impression of the magnitude of the programs, Table 1reports
the overall expenditures and number of participants per program type. It can be seen that active job search and qualification measures are the most important programs with respect to the number of participants. Over time, we observe that the number of active job search programs increases, whereas participation in qualification measures drops to 70% in 2002 compared to 2000. Integration subsidies feature far less participants but a considerable amount of expenditures because the respective subsidies can amount up to 100% of the wage bill of the new employment. The same holds for socioeconomic enterprises and non-profit sector projects which are also characterized by high average costs per participation of, for instance, over 11,000 euros for non-profit sector projects in 2000. In contrast, course subsidies appear to be on average
a rather low-cost measure of around 600 euros per participation in 2000.8
For the year 2002, we also calculated expenditures per day. Again, we can see that socioeconomic enterprises, non-profit sector projects, and integration subsidies are the most expensive measures per day. The former two are even more costly since the respective expenditures do not only cover the wage of the participants but also the coverage of potential losses of the job-creating firm.
7In case of a business foundation, future workers are trained with specific skills for the new firm.
In case of a firm closure, the dismissed are trained to adjust their skills for further employment in a new firm.
8For business start-up programs (BSU), qualification for employees (QFE), and integration
subsidies (IS), we find decreasing costs per participation over time. BSU are less frequently accompanied by other courses. QFE measures are more and more redesigned into smaller specialized measures. The refund rate of IS, granted to the employers, decreases over time.
Table 1 Expenditures a nd number o f p articipants b y p rogram type Program P articipation Expenditures E xp./part. P articipation Expenditures E xp./part. P articipation Expenditures E xp./part. E xp. p er day 2000 2001 2002 Socioeconomic 3,400 31 9,265 5,700 39 6,807 5,800 49 8,362 56 enterprises Non-profit 2,900 33 11,448 3,600 33 9,056 3,800 36 9,500 59 sector projects Orientation 8 ,000 28 3,511 11,800 29 2,451 18,200 28 1,535 19 measures Job coaching 1 ,700 10 5,915 2,700 11 4,180 4,100 10 2,447 18 Active job search 22,600 41 1,788 35,000 37 1,063 46,200 41 892 21 Qualification 77,700 110 1,411 65,600 104 1,591 54,400 123 2,262 29 measures Course subsidies 17,200 11 622 26,900 19 710 33,100 23 695 14 Business start-up 11,900 31 2,613 22,300 32 1,448 34,300 34 980 8 program Qualification 7,600 18 2,316 27,200 28 1,044 44,300 35 763 17 programs for employees Beneficence 3,400 8 2 ,412 3,600 5 1 ,472 4,400 4 909 4 for labor Integration subsidies 16,100 105 6,522 18,300 97 5,301 18,000 69 3,839 26 Overall expenditures 0 .52 0 .5 0.56 for ALMP a s a % of GDP Expenditures in m illion e uros. E xpenditures p er participation a nd per d ay are in e uros. T he numbers in the column “ participation” denote cases, not p ersons (multiple p articipations occur frequently). Sources: Basisinformationsbericht Ö sterreich (2004), A MS Data W arehouse, OECD source database
Beneficences for labor have very low costs per day since most of the costs are carried by the cooperating firms.
3 Data and identification strategy
3.1 Data
The three data sources that are used for the program evaluation comprise administrative registers from the Federation of Austrian Social Insurance In-stitutions and the Austrian Public Employment Service, including information from the program register data. We make use of all the Austrian population in-stead of a random sample as is usually the case. Using the population increases computation time considerably, but maximizes the precision of our evaluation results. For example, due to the resulting large number of observations, it will be possible to non-parametrically estimate program effects fairly precisely even for smaller subgroups of participants and programs.
We use the Social Insurance data to obtain information about times in employment (employment states: employed, self-employed, or civil servants; with earnings and employer information), retirement, and other periods rel-evant for social insurance contributions from 1985 to 2005. Since all financial support during times of parental leave are granted relative to the scheduled confinement date, we identify not only times of parental leave but also the pregnancy status for women, which will be a key control variable in the analysis. Information about the counseling process of the Public Employ-ment Service, i.e., beginning and end of an unemployEmploy-ment period, regional identifiers, personal characteristics like sex, marital status, nationality, current profession and desired profession, education, disability status, number of job offers received, or times of previous labor market program participation, is available from the Public Employment Service data from 1990 until 2005. Finally, the Public Employment Service data give us detailed information about the type of labor market program from 2000 to 2005.
Most of the data are available on a daily basis, but to condense the infor-mation into a manageable form, we chose to aggregate the daily inforinfor-mation into 2-week intervals (which is more precise than the usual grids used by evaluation studies that are commonly based on monthly, quarterly, or even yearly information).
However, although this dataset is well suited for an evaluation exercise, the nature of the data nevertheless imposes some restrictions with respect to the definition of the participation window and the follow-up period, which will be discussed in detail later on. Furthermore, we have to rely on a quite broad
definition of the type of qualification measures.9
9All variables that can potentially be used to further distinguish the wide range of qualification
3.2 Identification strategy
In the current analysis, we concentrate on the average program effects com-pared to non-participation. The identification problem in non-experimental program evaluations is that participants in one program differ, sometimes substantially, from potential comparison observations in the non-participation state with respect to characteristics that may influence the outcome variables under inspection as well. Since our data are very informative but contains no obvious instrumental variable, i.e., a variable that influences the outcome only by influencing the participation decision, we chose the so-called conditional independence assumption (CIA) to overcome the resulting identification prob-lem. It states that if we are able to observe all factors that jointly influence the participation decision and the outcomes, then, conditional on those factors, we can learn the (potential) non-participation outcomes of the participants from the observable non-participation outcomes of the non-participants with the same distribution of characteristics, which identifies our parameter of
interest. This identification strategy goes back to Rubin (1974) for the case of
comparing participants to non-participants. Imbens (2000) and Lechner (2001)
generalize this idea to the case of multiple treatments and provide similar identification conditions. However, the CIA strongly hinges on the availability of a comprehensive set of covariates. To justify its applicability in the present framework, we now discuss three important issues of program allocation: the allocation decision of the caseworker of the Public Employment Service, the willingness and collaboration of the unemployed individual, as well as relevant eligibility criteria in general.
The standard allocation procedure is initially based on a face-to-face inter-view between the unemployed person and the caseworker. Several aspects, like education, family affairs, past behavior on the labor market, features of the last employment, and individual program history, are discussed. As a result of this interview and in light of the local characteristics of the labor market, the caseworker decides whether or not the unemployed person should be sent into a specific labor market program. Multiple refusals of program offers can lead to temporary suspensions of the benefit payments. However, such punishments are rarely observed in the data. The data contain a large set of covariates that are suitable to map most of those aspects. In addition to variables like age, sex, foreigner status, family status, education, information on the job, and the previous sector of employment, we construct a rich set of variables that summarizes the entire labor market history of the unemployed person. This history covers up to 15 years before the actual entry into unemployment under inspection on a fine 2-week scale. We construct variables covering previous
times of (un-)employment, program participation, times of childcare,10
mili-tary service, times of non-registration, which we call out-of-labor-force times
10Childcare in general is universally available. Our remaining conditioning variables in the
propensity score capture their determinants so that there is no problem for the validity of the CIA.
(OLF) from now on. By means of this, we are also confident to possess suitable proxy variables for unobservable variables like motivation or the general attitude towards employment. In addition, we use characteristics of the local
labor markets relevant for each specific individual.11
From the perspective of the unemployed, all points mentioned above cer-tainly play a role for the participation decision. Another component of the indi-vidual consideration might be the question whether the currently unemployed person was satisfied with the kind of his/her former job. Since we observe data on the current and the desired profession, we are able to identify or at least approximate this feature. Furthermore, since unemployment insurance contributions are paid during the time of program participation, the individual decision might take into account the remaining time of the unemployment benefits. Thus, we also compute the remaining unemployment benefits claim at the time of (hypothetical) program entry. Another important determinant will certainly be the existence of dependent children, which is available in this data. Thus, we control for all previous times in parental leave (and thus for the complete childbearing history), but also for the month of pregnancy for women during the unemployment spell under consideration, i.e., the pregnancy status right before the hypothetical program entry, which has not been available in previous studies on effect differentials for men and women. Furthermore, we assess all previous control variables to be also relevant for the outcome variable “parental leave” which is used later on, especially, age, marital status, and education. The desire for vocational change is also a key determinant, since unemployed who desire a vocational change are presumably less focused on family planning.
From an institutional point of view, a key eligibility requirement for program participation is being unemployed (whether the individual receives unemployment benefits or unemployment assistance is irrelevant). We will resolve this issue by choosing an adequate inflow of eligibles into unem-ployment. Finally, there are number of guidelines that define specific types of unemployed to receive preferential treatment in certain programs. We explicitly account for this by tailoring the selection models to the comparisons of the specific programs under consideration, i.e., using flexible specifications that include key determinants for the selection into the respective programs. Overall, we plausibly pin down most important factors that drive the allocation decision and the potential outcomes. Thus, assuming CIA appears to be a credible identification strategy.
3.3 Definition of the population and the programs of interest
To be included in our evaluation, programs and the respective participants have to meet five requirements. First, the identification strategy strongly
11The local labor market data were provided by the Austrian Institute of Economic Research and
are merged to the individual unemployed via regional identifiers of the local Public Employment Service office.
hinges on the existence of a long labor market history before the entry into unemployment. Second, the follow-up period after program attendance should not be influenced by perturbing events like the possibility of (early) retirement. As a result of those arguments, we concentrate on the age groups of the labor force between 25 and 50 years. Third, the data must provide all relevant information about the selection into the different labor market programs. Fourth, since we employ non-parametric estimation techniques, the number of observations in the different programs has to be sufficiently large. Finally, we require the program content to be more substantial than the usual counseling process. Under those restrictions, we end up with six program types that can be credibly evaluated: socioeconomic enterprises, non-profit sector projects, job coaching, active job search, qualification measures, and course subsidies.
The nature of the data drives the definition of the population used in the estimation. Information on program participation is only available from the year 2000 onwards. The follow-up period is restricted by the end of the
observation period in 2005. Hence, we consider the first inflow of individuals12
from employment into unemployment or one of the six labor market programs
between 2000 and 2002.13By means of this, we observe enough participants in
each program and have a follow-up period of at least 3 years, which enables us to identify effects that are less affected by initial lock-in effects. Doing so, we end up with a population of 797,034 persons.
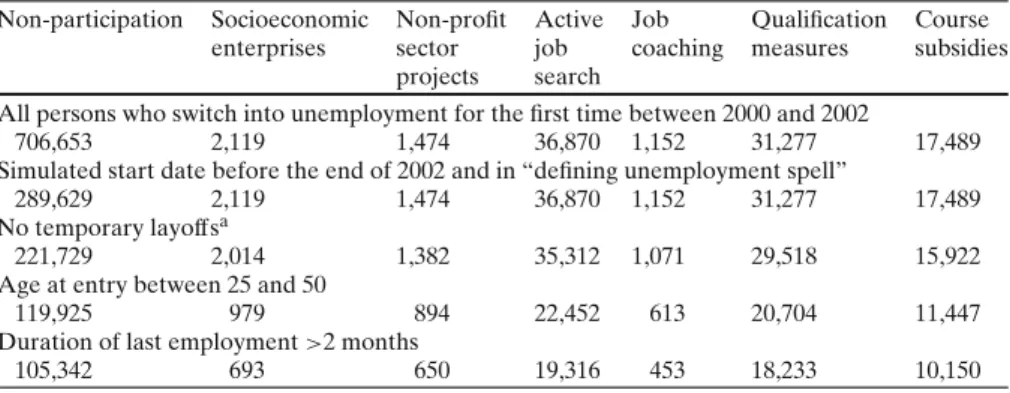
The next step is to divide all persons who passed this criterion into par-ticipants and non-parpar-ticipants. In that population, we define a participant to be a person who took part in a program before the end of 2002 (without an employment spell between inflow and participation). Thus, non-participants are persons who moved from employment into unemployment and have not been allocated to a program between 2000 and 2002 or took up an employment before being allocated to a program. The resulting numbers of observations are
shown in the first row of Table2.
However, we impose a number of further restrictions. Some control vari-ables, like the remaining unemployment insurance benefit claim or the dura-tion in unemployment before the entry into a program, require a reference data (artificial program start date) for the non-participants. To obtain such
a reference date, we employ an approach suggested by Lechner (1999). We
simulate start dates for the non-participants by drawing start dates from the distribution of the participants. If the non-participant is not eligible at the simulated reference date, then this non-participant is not considered in the evaluation. The fairly drastic reduction in the number of observations is not particularly important though, since (1) participants are in abundant supply and (2) they serve only as comparison observations for participants and are not interesting per se. In Austria, temporary layoffs are widely spread. Especially workers in the tourism or construction sector are laid off with a more or less
12As in Lechner et al. (2007,2009).
Table 2 Selection of the population used in the estimation
Non-participation Socioeconomic Non-profit Active Job Qualification Course enterprises sector job coaching measures subsidies
projects search
All persons who switch into unemployment for the first time between 2000 and 2002
706,653 2,119 1,474 36,870 1,152 31,277 17,489
Simulated start date before the end of 2002 and in “defining unemployment spell”
289,629 2,119 1,474 36,870 1,152 31,277 17,489
No temporary layoffsa
221,729 2,014 1,382 35,312 1,071 29,518 15,922
Age at entry between 25 and 50
119,925 979 894 22,452 613 20,704 11,447
Duration of last employment>2 months
105,342 693 650 19,316 453 18,233 10,150
aOnly sample without a fixed future reemployment date (information provided by the caseworker)
binding reemployment guarantee. Since such reemployment guarantees may differ substantially with respect to how binding they are and since we do not observe such differences that most likely influence participation and labor market outcomes, we require that all persons are laid off permanently. The age restriction, for reasons described above, is applied as well. Furthermore, we re-quire the duration of the last employment before the inflow into our sample to be longer than 2 months. By means of this, we make sure that prior participants in subsidized employment are not employed further for a couple of days after the end of the program, which would cause a short employment spell before becoming unemployed again. We observe that especially the age restriction reduces the number of participants and non-participants considerably. The resulting number of observations, however, still allows reliable results from non-parametric estimation.
3.4 A descriptive analysis of the selection into the programs
As a first description of the selection process, Table3shows mean
character-istics by participation status for selected variables.14In general, the numbers
exhibit many aspects of the institutional environment in Austria as well as the general allocation policy of the Public Employment Service. Except for socioe-conomic enterprises and active job search, the fraction of female participants is above 50%. Qualification measures even have a female participation rate of 62%, which underlines gender mainstreaming requirements anchored in the Guiding Principles of the Federal Ministry of Economics and Labor. Conse-quently, those participants feature higher average mean durations in times of parental leave before the defining unemployment period. We computed
14The entire set of variables that are used in the estimation part of this paper is available from the
Internet appendix. It covers personal characteristics, like family status, education, last profession, last industry sector, last firm size, last salary, remaining benefit duration at program entry, different aspects of the labor market history, and times of child care, program history, and a set of regional indicators.
Table 3 Mean characteristics o f selected variables (mean or share in % ) Variable Non-participation Socioecon. Non-profit sector Active job Job Qualification Course enterprises p rojects search coaching measure subsidies Number of observations 105,342 693 650 19,316 453 18,233 10,150 Personal characteristics (in % ) Female 5 1 4 9 5 4 5 0 5 4 6 2 5 5 Disabled 5 2 1 2 2 7 22 10 10 Foreigner 2 0 1 2 7 21 11 13 14 Age a t (hypothetical) program e ntry 36 40 37 37 37 37 37 Desires vocational change 1 8 2 6 2 1 2 9 2 3 2 2 2 0 Pregnant a t the (hypothetical) program start 2.5 0 1.7 0 .3 0.4 0 .5 0.5 (only w omen subsample) a Average month o f p regnancy (only w omen subsample 5.4 0 3.6 3 .7 3.5 3 .6 3.6 with pregnancy) a Education (in %) No formal education 3 3 4 6 4 2 3 Compulsory school 34 50 40 35 46 28 26 Apprenticeship 35 32 29 30 27 37 35 Schooling d egree with vocational qualification 6 5 7 6 8 1 0 9 Schooling d egree with university entrance qualification 9 4 7 1 1 4 12 12 Academic d egree 5 .9 9 5 4 4 7 Education m issing 8 4 4 8 6 8 8 Income (in E UR/day) Last earnings 4 2 3 8 3 4 4 5 3 7 4 3 4 3 Unemployment insurance benefit claim a t 2 2 1 0 1 0 1 7 1 1 1 9 1 9 (hypothetical) program e ntry Last employment (in months) Duration of last employment 2 8 2 0 2 0 2 8 2 3 3 2 3 3 Fractions of entire period in data (in % ) Fraction of unemployment 1 2 2 2 2 1 1 4 1 8 1 2 1 1 Fraction of employment 6 8 5 9 5 3 6 7 6 0 6 7 6 8 Fraction of remaining time 20 19 27 19 22 21 22
Table 3 (continued) Variable Non-participation Socioecon. Non-profit sector Active job Job Qualification Course enterprises p rojects search coaching measure subsidies Mean duration (in months) Employment o ver 5 years b efore 2 1 1 6 1 4 2 1 1 7 2 4 2 5 Out o f labor force o ver 5 years b efore 1 .5 1.5 1 .8 1.3 1 .6 1.4 1 .5 Parental leave over 5 years b efore 2 .1 1.6 2 .6 2.0 2 .0 2.6 2 .1 Program h istory (in % ) Last program o f the same kind – 2 3 1 7 1 7 1 4 1 5 1 4 Information o n current unemployment spell Entry 1 st quarter of the year (in % ) 2 7 3 2 4 4 3 1 2 9 2 9 2 8 2nd quarter (in % ) 2 3 2 4 2 0 2 6 2 0 2 4 2 3 3rd quarter (in % ) 2 3 2 2 2 3 2 5 2 6 2 5 2 6 4th quarter (in % ) 2 8 2 2 1 3 1 9 2 5 2 2 2 4 Time in unemployment b efore (hypothetical) 3.1 7 .8 6.3 5 .7 7.5 4 .9 4.9 program e ntry (in m onths) Regional information (in %) UE rate 2000 7.0 6 .7 6.9 8 .5 6.2 7 .2 6.7 Local fraction unemployment a ssistance recipients 2001 32 32 32 44 28 35 32 Local fraction o f long-term unemployed 2000 20 19 20 29 15 22 19 Residence in the state o f V ienna 23 17 5 6 5 7 30 23 Employment a fter b egin o f p rogram (in % ; outcome) Employed 1 year after b egin 6 2 3 7 4 1 5 3 3 7 5 1 5 9 Employed 2 years a fter b egin 6 4 4 5 5 0 5 8 4 7 6 2 6 8 Employed 3 years a fter b egin 6 4 4 9 5 4 5 9 5 3 6 6 7 0 If not stated otherwise, w e compute a ll variables of the employment h istory at the e ntry into the d efining unemployment spell aPregnancy is the only variable that is computed on the w omen’s subsample
the pregnancy state for women right before the hypothetical program start. It can be seen that pregnancy is hardly an issue for the program groups, except for non-profit sector projects. Furthermore, we observe that the fraction of pregnant female non-participants is higher compared to female participants of all programs so that pregnancy status is indeed an important variable to control for in the remainder of the analysis.
For programs which are specifically designed for unemployed with cer-tain reintegration obstacles, like socioeconomic enterprises, non-profit sector projects, and job coaching, we observe a fraction of disabled participants of almost 22% which is nearly three times higher than for active job search and more than two times higher than for qualification measures and course subsidies. Participants of socioeconomic enterprises are also on average the oldest and the ones with the shortest mean duration in childcare. This distinc-tion between programs for unemployed with stronger reintegradistinc-tion problems on the one hand and programs for unemployed with “usual” reintegration problems on the other hand can be observed in many dimensions. For the for-mer group, we observe predominantly participants with compulsory schooling (9 years) as the highest education level, jobs in the production and construction sector, higher average times in unemployment, shorter durations of the last employment spell, and a lower overall fraction in employment over the entire observation period in the data. Furthermore, those participants have much lower remaining benefit claims at the time of program entry and lower past earnings.
A peculiarity that is observed for all program groups is that 15–23% of the participants attended a program of the same kind in a previous unemployment spell. Active job search measures, primarily used to endow participants with special job application and interview skills, are also used as a screening instru-ment for long-term unemployed in order to renew and tighten the contact to
the local Public Employment Service office. This is also reflected in Table3
since participants in active job search live in regions with a higher average fraction of long-term unemployment. It can be observed that non-profit sector projects and job coaching are rarely used in the state of Vienna compared to the rest of Austria. In terms of employment in the period after the program, we find that participants in socioeconomic enterprises, non-profit sector projects, and job coaching have considerably lower employment rates 1 year after the program start, which is not surprising given program lengths of up to 1 year. Participants in shorter programs exhibit higher employment rates. Overall, participants catch up after 2 or 3 years.
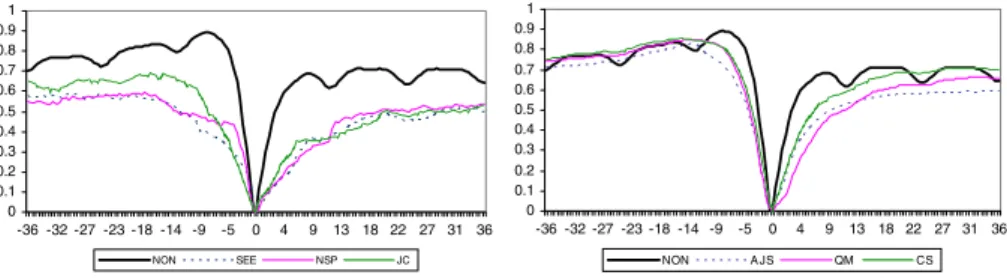
Figure2provides a more complete picture of pre- and post-program
em-ployment rates. The abscissa shows the months before and after the (hypo-thetical) start of the program. The ordinate measures the employment rate for different program groups. The left picture shows that participants in socioe-conomic enterprises, non-profit sector projects, and job coaching differ quite substantially from non-participants with respect to their employment history 3 years before the program. Hence, interpreting post-program employment rate differences as program effects is not appropriate. The same holds for
0 0.1 0.2 0.3 0.4 0.5 0.6 0.7 0.8 0.9 1 -36 -32 -27 -23 -18 -14 -9 -5 0 4 9 13 18 22 27 31 36 NON SEE NSP JC 0 0.1 0.2 0.3 0.4 0.5 0.6 0.7 0.8 0.9 1 -36 -32 -27 -23 -18 -14 -9 -5 0 4 9 13 18 22 27 31 36 NON A JS QM CS
Fig. 2 Employment 3 years before and after program entry. NON non-participation, SEE
socioeconomic enterprises, NSP non-profit sector projects, JC job coaching, AJS active job search,
QM qualification measure, CS course subsidy
active job search, qualification measures, and course subsidies. Here, the pre-program differences are also visible, but not as large as for the first group of programs.
4 Econometric methodology
As discussed before, the identification of the program effects hinges on the existence of the variables that jointly influence program participation and potential outcomes. For every comparison of different program states (includ-ing non-participation), the estimation strategy is to form comparison groups that do not differ from the respective program groups with respect to the distribution of those conditioning variables. We employ an advanced version of a semi-parametric two-stage propensity score matching approach. This class of estimators is popular in the program evaluation literature because it allows for individual effect heterogeneity while not requiring a parametric specification for the relation of the outcome variable and the variables controlling for the
selection bias correction. Rosenbaum and Rubin (1983) show that if the CIA
holds, given all relevant covariates, then it also holds for a particular scalar function of those covariates, i.e., the participation probability conditional on the control variables (propensity scores). Hence, a first-step procedure esti-mates those conditional program participation probabilities. The advantage is that the construction of control groups can be done on the basis of the
propensity score. Those points are discussed in Heckman et al. (1999) and
Imbens (2004) for the binary treatment and in Imbens (2000) and Lechner
(2001) for the multiple treatment case.
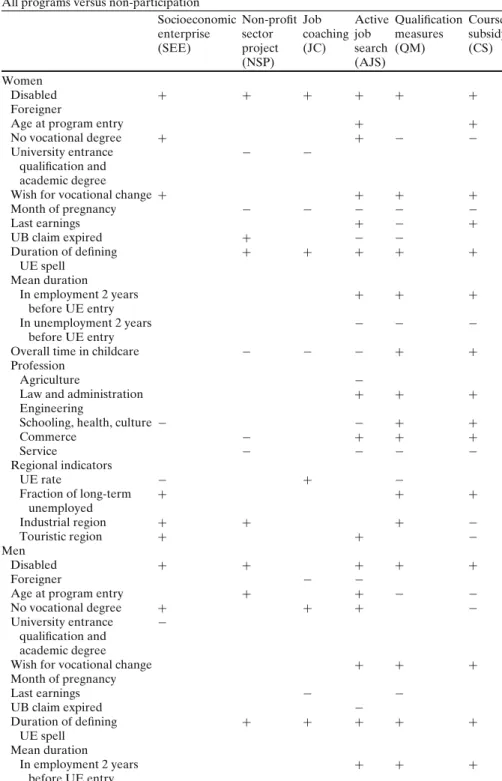
We model the propensity score by means of binary probit models for each program type and for men and women separately. The specifications differ sometimes considerably by program and gender as can be seen in the Internet appendix. The results give further insights into the program allocation of the
caseworkers. Table4reports a selection of variables that appear frequently
in all specifications.15 Despite the existence of considerable heterogeneity,
Table 4 Results of the propensity score estimation
All programs versus non-participation
Socioeconomic Non-profit Job Active Qualification Course enterprise sector coaching job measures subsidy (SEE) project (JC) search (QM) (CS)
(NSP) (AJS)
Women
Disabled + + + + + +
Foreigner
Age at program entry + +
No vocational degree + + − −
University entrance − −
qualification and academic degree
Wish for vocational change + + + +
Month of pregnancy − − − − − Last earnings + − + UB claim expired + − − Duration of defining + + + + + UE spell Mean duration In employment 2 years + + + before UE entry In unemployment 2 years − − − before UE entry
Overall time in childcare − − − + +
Profession
Agriculture −
Law and administration + + +
Engineering
Schooling, health, culture − − + +
Commerce − + + + Service − − − − Regional indicators UE rate − + − Fraction of long-term + + + unemployed Industrial region + + + − Touristic region + + − Men Disabled + + + + + Foreigner − −
Age at program entry + + − −
No vocational degree + + + −
University entrance − qualification and
academic degree
Wish for vocational change + + +
Month of pregnancy Last earnings − − UB claim expired − Duration of defining + + + + + UE spell Mean duration In employment 2 years + + + before UE entry
Table 4 (continued)
All programs versus non-participation
Socioeconomic Non-profit Job Active Qualification Course enterprise sector coaching job measures subsidy (SEE) project (JC) search (QM) (CS)
(NSP) (AJS)
In unemployment 2 years − − −
before UE entry Overall time in childcare Profession
Agriculture +
Law and administration + + +
Engineering + + + +
Schooling, health, culture +
Commerce + + + Service − − Regional indicators UE rate + − − Fraction of long-term − + + unemployed Industrial region + − Touristic region + + −
We estimate probit models for the selection into the different programs compared to the state of non-participation. We do not report the value of the coefficients since they are only identified up to scale and thus not comparable between the different models.+ (−) denote that the respective variable has a positive (negative) influence on the participation probability that is significant on the 5% level. Reading example 1: For the selection of women into job coaching (JC) compared to non-participation, we find a positive influence of the disability status on the probability of participating in JC. Reading example 2: For the selection of men into active job search (AJS) compared to non-participation, we find that the wish for a vocational change increases the probability of participating in AJS
some general determinants of program participation versus non-participation appear. For both sexes, we find a positive relation of participation to disability, desiring a vocational change, longer durations of the defining unemployment spell, and having higher average durations in past employment. Jobs in the law and administration and trade sector tend to increase the probability of being promoted in active job search, qualification measures, and course subsidies. Being a foreigner, having a university (entrance) degree as well as a previous occupation in the service sector decreases (if at all) the participation probabil-ity. For women, we find that the months of pregnancy reduce the participation probability for all programs, except socioeconomic enterprises. The overall previous time spent in parental leave prior to the defining unemployment spell under consideration reduces the participation probability for non-profit sector projects, job coaching, and active job search, but increases the one for course subsidies. For men, we find that having no vocational degree increases the probability of participating in socioeconomic enterprises, non-profit sector projects, and active job search, but decreases the one for participating in course
subsidies. The remaining picture is less clear as can be seen in Table4.
To obtain the final estimates of the program effects, we use the extended
and modified by Wunsch and Lechner (2008). First, they allow for more than one good match, if available, by incorporating the idea of caliper matching
as in Dehejia and Wahba (2002). Second, they incorporate a bias correction
procedure to account for small mismatches of the matching step by exploiting
the double robustness property as discussed in Rubin (1979) and Joffe et al.
(2004). TheAppendixcontains a brief description of the way the estimator is
implemented.
5 Results
5.1 Program effects by gender
The following figures illustrate program effects for participants in one program (listed at the top of each figure) compared to non-participation. The follow-up period relevant for outcome measurements starts at the day of program entry and ends 3 years later. Effects are estimated monthly as differences
of percentage points for all outcome variables.16 If symbols appear on the
different lines (denoting the program effects), it means that the respective effects are statistically different from 0 at the 5% level. Recall that the matching step is done on the basis of propensity scores that are estimated for
men and women separately.17
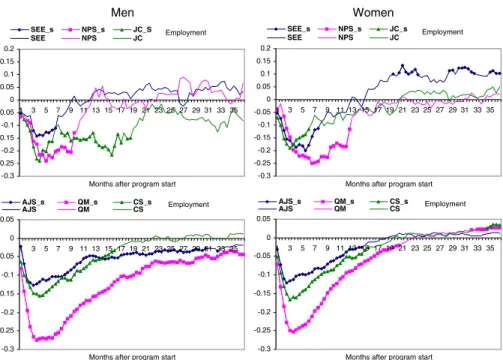
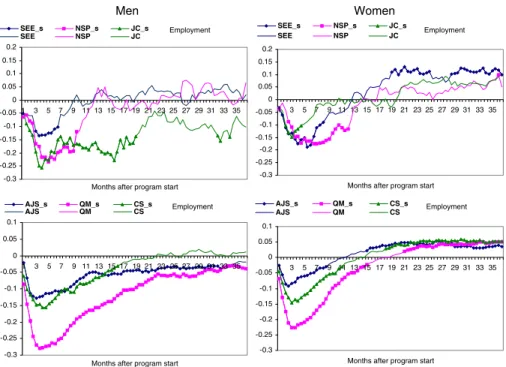
The two graphs in the first row of Fig. 3 show employment effects of
participating in socioeconomic enterprises, non-profit sector projects, and job
coaching. Common to all graphs of Fig.3are negative employment effects for
all programs right after the start, which is commonly labeled as lock-in effect
(see Van Ours2004, among others). The intuition is that participants reduce
their search intensity while being in a program and therefore reenter less fre-quently into regular employment than non-participants. There are differences in the progression of the curves for men and women. For women, we observe that socioeconomic enterprises seem to increase the employment probability of the participants by 9% after 3 years. For qualification measures and course
subsidies, presented in the second panel of Fig.3, we find small positive effects
at the very end of the follow-up period of about 2.5% for women.18For male
participants, we do not find positive effects for any program. Qualification measures even seem to harm the respective participants 3 years after program start. Interestingly, even after controlling for the pregnancy status which
16The outcome variable is also listed in the top line of every panel.
17Note that we additionally deleted all individuals who received financial support right before the
(hypothetical) entry into the program, which had only marginal impact on the population size. See the Internet appendix for details.
18Note that it is possible to estimate fairly small effects (below 5% points) due to the larger number
of participants in the programs collected in group 2. Such small effects could not be identified non-parametrically before since comparable studies usually rely on (smaller) samples instead of using the population as is done here.
Men Women Employment -0.3 -0.25 -0.2 -0.15 -0.1 -0.05 0 0.05 0.1 0.15 0.2 1 3 5 7 9 11 13 15 17 19 21 23 25 27 29 31 33 35
Months after program start
SEE_s NPS_s JC_S SEE NPS JC Employment -0.3 -0.25 -0.2 -0.15 -0.1 -0.05 0 0.05 0.1 0.15 0.2 1 3 5 7 9 11 13 15 17 19 21 23 25 27 29 31 33 35
Months after program start
SEE_s NPS_s JC_s SEE NPS JC Employment -0.3 -0.25 -0.2 -0.15 -0.1 -0.05 0 0.05 1 3 5 7 9 11 13 15 17 19 21 23 25 27 29 31 33 35
Months after program start
AJS_s QM_s CS_s AJS QM CS Employment -0.3 -0.25 -0.2 -0.15 -0.1 -0.05 0 0.05 1 3 5 7 9 11 13 15 17 19 21 23 25 27 29 31 33 35
Months after program start
AJS_s QM_s CS_s
AJS QM CS
Fig. 3 Effects of program participation versus non-participation: Employment in % points.
Results based on matching estimation. Abscissa, Months after program entry. Ordinate, Difference of employment rates. Symbols indicate that the effect is statistically different from zero at the 95% level. SEE socioeconomic enterprise, NSP non-profit sector project, JC job coaching, AJS active job search, QM qualification measure, CS course subsidy. Participants (male/female): SEE (343/340), NSP (300/347), JC (206/243), AJS (9,641/9,638), QM (6,869/11,330), CS (4,549/5,587)
distinguishes this study from previous ones, we still find some positive effects after 3 years for women. Thus, for certain labor market programs, this study
points to an effect premia for women as well.19
5.2 Where do the positive effects for women come from?
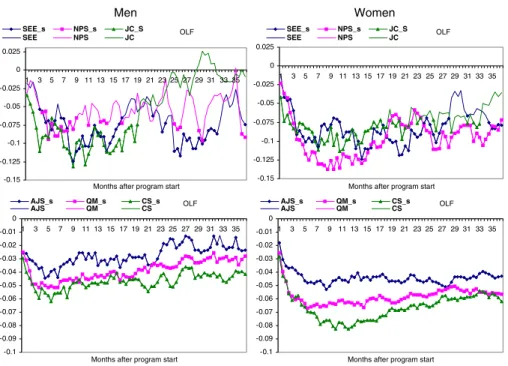
Previous studies, like Lechner et al. (2009), showed that usually, the
posi-tive employment effects are not achieved by reducing the rate of registered unemployed participants but by increasing their labor force attachment, i.e.,
by reducing the rate of participants leaving the labor force. Therefore, Fig.4
shows the program effects on times out of the labor force (OLF), defined as not being employed and not being registered as unemployed in the current study.
All programs reduce times in OLF. Comparing both sexes, especially in the
lower panel of Fig.4, we find the reduction of OLF to be higher for women
19Taking unemployment as the outcome variable, it can be seen for male participants that none
of the programs decreases unemployment. Qualification measures even increase unemployment by 4%. For women only, qualification measures and course subsidies decrease unemployment, but only by 1.5% to 2.5%. For further details see, the Internet appendix.
Men Women OLF -0.15 -0.125 -0.1 -0.075 -0.05 -0.025 0 0.025 1 3 5 7 9 11 13 15 17 19 21 23 25 27 29 31 33 35
Months after program start
SEE_s NPS_s JC_S SEE NPS JC OLF -0.15 -0.125 -0.1 -0.075 -0.05 -0.025 0 0.025 1 3 5 7 9 11 13 15 17 19 21 23 25 27 29 31 33 35
Months after program start
SEE_s NPS_s JC_S SEE NPS JC OLF -0.1 -0.09 -0.08 -0.07 -0.06 -0.05 -0.04 -0.03 -0.02 -0.01 0 1 3 5 7 9 11 13 15 17 19 21 23 25 27 29 31 33 35
Months after program start
AJS_s QM_s CS_s AJS QM CS OLF -0.1 -0.09 -0.08 -0.07 -0.06 -0.05 -0.04 -0.03 -0.02 -0.01 0 1 3 5 7 9 11 13 15 17 19 21 23 25 27 29 31 33 35
Months after program start
AJS_s QM_s CS_s
AJS QM CS
Fig. 4 Effects of program participation versus non-participation: OLF (not employed and not
registered as unemployed) in % points. Results based on matching estimation. Abscissa, Months after program entry. Ordinate, Difference of out-of-the-labor-force rates. Symbols indicate that the effect is statistically different from 0 at the 95% level. SEE socioeconomic enterprise, NSP non-profit sector project, JC job coaching, AJS active job search, QM qualification measure,
CS course subsidy. Participants (male/female): SEE (343/340), NSP (300/347), JC (206/243), AJS
(9,641/9,638), QM (6,869/11,330), CS (4,549/5,587)
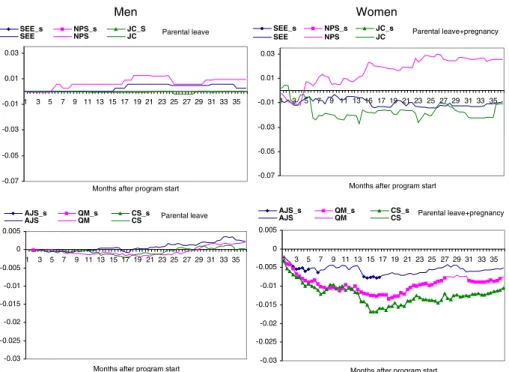
than for men. Using a unique feature of our data, we disaggregate this effect
further. Figure5shows the program effects on times of parental leave for men
and on times of parental leave plus pregnancy (PP) for women.20For women,
we find significant negative effects on PP for qualification measures and course subsidies.
For socioeconomic enterprises, job coaching, and active job search, we also find negative but insignificant effects. Only non-profit sector projects seem to have small positive effects on PP, though being insignificant. There are no significant effects on parental leave for men. To summarize, women who are not allocated to a labor market program, though being eligible, switch more frequently into PP. It seems as if some of those women are faced implicitly with the decision of being trained or using the time to realize family plans that would have been postponed otherwise, i.e., in case of a program allocation. Hence, we find that apart from effects on employment (positive or negative),
20Women receive financial support 8 weeks before a scheduled confinement and for up to 3 years
afterwards, as described in Section2. Since part of this period is counted as contribution times to the pension schemes, we observe them in the social security records.
Men Women Parental leave -0.07 -0.05 -0.03 -0.01 0.01 0.03 1 3 5 7 9 11 13 15 17 19 21 23 25 27 29 31 33 35
Months after program start
SEE_s NPS_s JC_S
SEE NPS JC Parental leave+pregnancy
-0.07 -0.05 -0.03 -0.01 0.01 0.03 1 3 5 7 9 11 13 15 17 19 21 23 25 27 29 31 33 35
Months after program start
SEE_s NPS_s JC_s SEE NPS JC Parental leave -0.03 -0.025 -0.02 -0.015 -0.01 -0.005 0 0.005 1 3 5 7 9 11 13 15 17 19 21 23 25 27 29 31 33 35
Months after program start
AJS_s QM_s CS_s
AJS QM CS Parental leave+pregnancy
-0.03 -0.025 -0.02 -0.015 -0.01 -0.005 0 0.005 1 3 5 7 9 11 13 15 17 19 21 23 25 27 29 31 33 35
Months after program start
AJS_s QM_s CS_s
AJS QM CS
Fig. 5 Effects of program participation versus non-participation: Parental leave and pregnancy.
Results based on matching estimation. Abscissa, Months after program entry. Ordinate, Difference of shares in parental leave or pregnancy. Symbols indicate that the effect is statistically different from 0 at the 95% level. SEE socioeconomic enterprise, NSP non-profit sector project, JC job coaching, AJS active job search, QM qualification measure, CS course subsidy. Participants (male/female): SEE (343/340), NSP (300/347), JC (206/243), AJS (9,641/9,638), QM (6,869/11,330), CS (4,549/5,587)
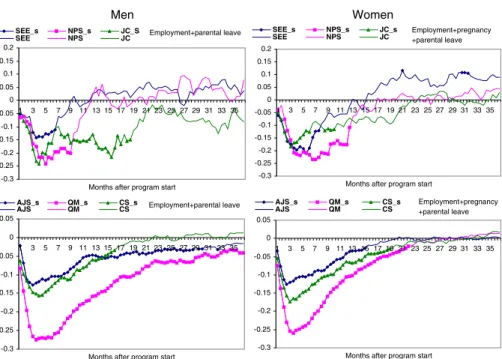
programs may contradict other policies that are designed to increase birthrates. As a final check, we use an outcome variable which takes the value 1 for times
in employment and PP and 0 otherwise. The results are presented in Fig.6.
The result is rather striking. Three years after program start, we do not find any significant effect for any program type, neither for men nor for women. Moreover, we observe that the relative dominance of the women melted down towards zero. It appears that the only remaining difference appears for qualification measures with significant negative effects for men and insignificant effects for women. Hence, we do not find substantial effect premia for women as soon as we incorporate times of PP as an outcome variable.
The female premia in Fig.3appeared because female non-participants take
an additional outside opportunity, i.e., becoming a mother, which leads to
comparably low employment rates for this pool of women (see also Fig.7).
Men are much less affected by such issues, and we therefore observe only the program effect, which is usually non-positive.
From the perspective of the policy maker, the message of the results should be ambiguous. If additional kids are considered as desirable as employment, then the programs are ineffective. If not, then the increase in the employment
Men Women Employment+parental leave -0.3 -0.25 -0.2 -0.15 -0.1 -0.05 0 0.05 0.1 0.15 0.2 1 3 5 7 9 11 13 15 17 19 21 23 25 27 29 31 33 35
Months after program start
SEE_s NPS_s JC_S SEE NPS JC Employment+pregnancy +parental leave -0.3 -0.25 -0.2 -0.15 -0.1 -0.05 0 0.05 0.1 0.15 0.2 1 3 5 7 9 11 13 15 17 19 21 23 25 27 29 31 33 35
Months after program start
SEE_s NPS_s JC_s SEE NPS JC Employment+parental leave -0.3 -0.25 -0.2 -0.15 -0.1 -0.05 0 0.05 1 3 5 7 9 11 13 15 17 19 21 23 25 27 29 31 33 35
Months after program start
AJS_s QM_s CS_s AJS QM CS Employment+pregnancy +parental leave -0.3 -0.25 -0.2 -0.15 -0.1 -0.05 0 0.05 1 3 5 7 9 11 13 15 17 19 21 23 25 27 29 31 33 35
Months after program start
AJS_s QM_s CS_s
AJS QM CS
Fig. 6 Effects of program participation versus non-participation: Employment and pregnancy
and parental leave. Results based on matching estimation. Abscissa, Months after program entry.
Ordinate, Difference of employment rates. Symbols indicate that the effect is statistically different
from 0 at the 95% level. SEE socioeconomic enterprise, NSP non-profit sector project, JC job coaching, AJS active job search, QM qualification measure, CS course subsidy. Participants (male/female): SEE (343/340), NSP (300/347), JC (206/243), AJS (9,641/9,638), QM (6,869/11,330), CS (4,549/5,587)
effect for women at the cost of reducing or postponing fertility may be desirable and considered as a “positive” outcome of the active labor market policies. non-participants participants 0 1 2 3 4 5 6 [25-27) [27-29) [29-31) [31-33) [33-35) [35-37) [37-39) [39-41) [41-43) [43-45) [45-47) [47-49) [49-50) age group
% of pregnant female nonparticipants
0 0.2 0.4 0.6 0.8 1 1.2 1.4 [25-27) [27-29) [29-31) [31-33) [33-35) [35-37) [37-39) [39-41) [41-43) [43-45) [45-47) [47-49) [49-50) age group
% of pregnant female participants
Fig. 7 Percentage of pregnant women by program status and age group. The pregnancy status
is computed right before the (hypothetical) program start. For this illustration, we pooled all program categories due to the small fraction of pregnant women per program type
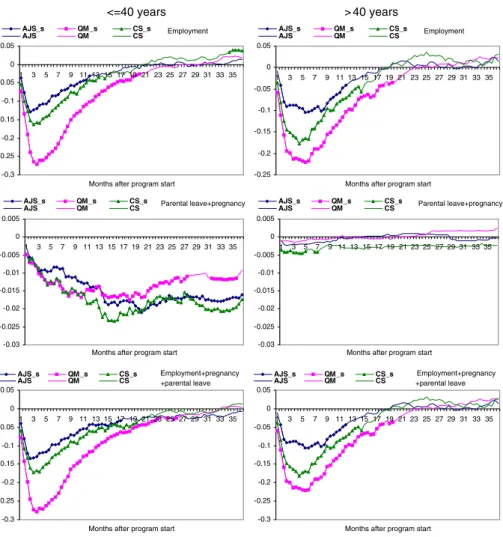
Due to the large size of the population in this study, it is possible to stratify female participants further, i.e., per age group, to get a clearer picture of the underlying heterogeneity relating to this effect. Thus, we divide all women into two age groups, below and above 40 years, to separate two groups that differ with respect to individual family plans. Doing so, 97.6% of all pregnancies just before the hypothetical program start are in the lower age group. Due to population size restrictions, we consider the three larger programs only, active job search, qualification measures, and course subsidies.
Figure8shows that splitting the female population according to age, we
observe that the positive effect for course subsidies can be attached to women
<=40 years > 40 years Employment -0.3 -0.25 -0.2 -0.15 -0.1 -0.05 0 0.05 1 3 5 7 9 11 13 15 17 19 21 23 25 27 29 31 33 35
Months after program start
AJS_s QM_s CS_s AJS QM CS Employment -0.25 -0.2 -0.15 -0.1 -0.05 0 0.05 1 3 5 7 9 11 13 15 17 19 21 23 25 27 29 31 33 35
Months after program start
AJS_s QM_s CS_s AJS QM CS Parental leave+pregnancy -0.03 -0.025 -0.02 -0.015 -0.01 -0.005 0 0.005 1 3 5 7 9 11 13 15 17 19 21 23 25 27 29 31 33 35
Months after program start
AJS_s QM_s CS_s
AJS QM CS Parental leave+pregnancy
-0.03 -0.025 -0.02 -0.015 -0.01 -0.005 0 0.005 1 3 5 7 9 11 13 15 17 19 21 23 25 27 29 31 33 35
Months after program start
AJS_s QM_s CS_s AJS QM CS Employment+pregnancy +parental leave -0.3 -0.25 -0.2 -0.15 -0.1 -0.05 0 0.05 1 3 5 7 9 11 13 15 17 19 21 23 25 27 29 31 33 35
Months after program start
AJS_s QM_s CS_s
AJS QM CS +parental leaveEmployment+pregnancy
-0.3 -0.25 -0.2 -0.15 -0.1 -0.05 0 0.05 1 3 5 7 9 11 13 15 17 19 21 23 25 27 29 31 33 35
Months after program start
AJS_s QM_s CS_s
AJS QM CS
Fig. 8 Effects of program participation versus non-participation: Women per age group. Results
based on matching estimation. Abscissa, Months after program entry. Ordinate, Difference of employment rates. Symbols indicate that the effect is statistically different from 0 at the 95% level.
AJS active job search, QM qualification measure, CS course subsidy. Participants (≤40/>40): AJS
younger than 40 years. For this group, we observe that all programs have a negative effect on PP. For the older segment in turn, we do not observe such effects. Overall, for both age groups, we fail to detect positive effects once we take employment plus PP as the outcome variable. Additionally, but not surprisingly, the effects on employment for men above the age of 40 look exactly like the effects for women in that age group since pregnancies and
parental leaves play hardly any role here.21Both arguments confirm our result
that once we correct for the selection bias (pregnancy status for women), the remaining (small) positive effects, here for course subsidies for younger women, only appear because eligible non-participants subsequently emphasize family planning, which leads to lower employment rates compared to those participants they have been matched to.
5.3 Pregnancy bias—a sensitivity check for omitted variables
As became clear in the previous section, one important feature of this study is that we use information on parental leave and pregnancies as an outcome variable as well as for correcting for potential selection bias, as pregnant women are rarely observed in labor market programs. Thus, if this variable is not controlled for, it is likely that a larger share of pregnant women appears in the group of non-participants, which will bias the employment effects upwards. Now, we analyze the size of this bias by comparing our results to results that would have been obtained without that information. First, we do not delete persons who are in parental leave right before the (hypothetical) program entry, and second, we leave out the month of pregnancy from the selection model, i.e., we allow for the selection bias that we suspect to be one driving
factor for the positive effect differential for women. Figure9summarizes the
results.
Obviously, the results for men are not affected by this change since parental leave is a minor issue here. For women, all effects increase by approximately
two to three percentage points compared to Fig.3. For socioeconomic
enter-prises, this results in a wider range of significant positive effects, especially at the end of the follow-up period. For active job search, qualification measures, and course subsidies, we now observe significant positive effects that are stable from the middle of the follow-up period onwards. According to these estimation results, we would conclude that we find clear evidence of positive effects for women for four out of six labor market programs, which is highly misleading as shown by the results in the previous sections.
To wrap up, we find two important impacts of the observability of times of parental leave. First, by constructing the pregnancy status for women, it removes the remaining omitted variable bias in the first-step selection model. Second, it can be used to better understand program effects in the follow-up period.
Men Women Employment -0.3 -0.25 -0.2 -0.15 -0.1 -0.05 0 0.05 0.1 0.15 0.2 1 3 5 7 9 11 13 15 17 19 21 23 25 27 29 31 33 35
Months after program start
SEE_s NSP_s JC_s SEE NSP JC Employment -0.3 -0.25 -0.2 -0.15 -0.1 -0.05 0 0.05 0.1 0.15 0.2 1 3 5 7 9 11 13 15 17 19 21 23 25 27 29 31 33 35
Months after program start
SEE_s NSP_s JC_s SEE NSP JC Employment -0.3 -0.25 -0.2 -0.15 -0.1 -0.05 0 0.05 0.1 1 3 5 7 9 11 13 15 17 19 21 23 25 27 29 31 33 35
Months after program start
AJS_s QM_s CS_s AJS QM CS Employment -0.3 -0.25 -0.2 -0.15 -0.1 -0.05 0 0.05 0.1 1 3 5 7 9 11 13 15 17 19 21 23 25 27 29 31 33 35
Months after program start
AJS_s QM_s CS_s
AJS QM CS
Fig. 9 Effects of program participation versus non-participation: Employment in % points.
Results based on matching estimation. Abscissa, Months after program entry. Ordinate, Difference of employment rates. Symbols indicate that the effect is statistically different from 0 at the 95% level. SEE socioeconomic enterprise, NSP non-profit sector project, JC job coaching, AJS active job search, QM qualification measure, CS course subsidy. Participants (male/female): SEE (343/340), NSP (300/347), JC (206/243), AJS (9,642/9,640), QM (6,869/11,332), CS (4,552/5,594)
6 Conclusion
This study provides an econometric evaluation of several important active labor market programs in Austria. Large and informative administrative data are used to control for potential selection problems. As a particular advantage of the data, we identify times of pregnancy and parental leave. For women, this information turns out to be very important for reducing selection bias as well as for understanding the effects of the programs.
For men, we find the programs to be generally ineffective in increasing unsubsidized employment. However, without controlling for pregnancy status, most programs appear to be effective in increasing employment prospects for women. Those effects become smaller once the pregnancy information is taken into account, but they are still there. A closer investigation shows that the programs increase female employment by reducing the share of women leaving the labor force. The underlying mechanism is that the programs reduce the pregnancy rate of the participants, i.e., programs also have an adverse (and often unintended) effect on other policies designed to foster birthrates.
Once that effect is subtracted from the employment effects, almost all gender differences disappear.
Our findings about the gender differences may explain results appearing in
the survey by Bergemann and van den Berg (2006). They find that women’s
effect premia predominantly occur in countries with a low female work force participation, indicating that times for taking care of infants and labor mar-ket participation are less compatible or exclusive. Moreover, none of those studies incorporated information on times of pregnancies. We demonstrate for the case of Austria that it is important to have information about the outside opportunities of women, like times of parental leave. The puzzle of women’s effect premia might be partially explained by the fact that important confounders (and outcome measures), like the ones discussed above, have not
been available in other studies.22
The question whether our results for women, namely, a positive employ-ment effect and a zero effect on the fertility plus employemploy-ment outcome, indi-cate that the definition of a program success depends on the value judgment of the policy makers. If additional (or earlier) kids are considered as desirable as employment, then the programs are ineffective. If employment is considered more important, then the increase in the employment effect for women at the cost of reducing or postponing fertility may be desirable and considered as a “positive” outcome of the Austrian active labor market policies. This conclusion is most likely true not only for Austria but for many other European countries as well.
Acknowledgments Financial support by the Austrian Federal Ministry of Economics and Labor
(BMWA) and by the European Commission is gratefully acknowledged. We benefited from many helpful comments from Johannes Schweighofer, Gottfried Wetzel (both BMWA), and from Helmut Mahringer (Austrian Institute of Economic Research). Furthermore, three anonymous referees helped to improve a previous version of the paper considerably. The usual disclaimer applies.
Appendix: Matching protocol
The results presented contain the binary comparison of each particular pro-gram to the state of non-participation for the participants in that particular
program. Table 5 shows the matching estimator that is used for each such
comparison.
22In this sense, our study reaffirms the conclusion by Bergemann and van den Berg (2006) that
the program effects for women may be larger because of their additional possibilities of moving in and out of non-participation: Parental leave is a classical component of the labor market state “out-of-the-labor force.”