European Chafer (Coleoptera: Scarabeidae) Grubs in
Soil- Turfgrass Microcosms
M, G. VILLANI ANDJ. p, NYROP
Department of Entomology, New York State Agricultural Experiment Station, Cornell University, Geneva, New York14456
Environ.Enlomol.20(1): 241-251 (1991)
ABSTRACT Movement patterns of japanese beetle,Popillia japonica Newman, and Eu-ropean chafer,Rhizotrogus (Amphimallon) majalis (Razoumowsky),grubs as influenced by gravity, host plant position, and external disturbances were studied in laboratory soil-turfgrass microcosms. Second through third instars just before pupation were monitored using radio-graphic techniques. Neonates were monitored using destructive sampling. Results demon-strate significantly different movement patterns between species and among age groups. The development stage of the grub had a large effect on japanese beetle grub behavior and a measurable, but lesser effect, on European chafers. All larval stages of European chafers and all larval stages of japanese beetle, except neonates and postoverwintering third instars, displayed a downward movement in response to disturbance. Neonate japanese beetles showed little movement while postoverwintering. japanese beetles moved upward when disturbed. European chafer grubs of all age classes displayed random vertical movement with some arrestment in or near sod. Preoverwintering and postoverwintering third-instar chafers showed less dramatic arrestment behavior than other instars tested. Second-instar japanese beetles behaved similarly to European chafers; however, third instars behaved very differently. All third instars except those tested in late winter and early spring showed some innate downward movement in the soil microcosms. japanese beetles tested in late winter displayed random movement with some arrestment in sod, whereas those tested in early spring exhibited upward movement and arrestment in sod.
KEY WORDS Insecta, soil insects, movement, behavior
IN THE NORTHEASTERNUNITEDSTATES,turfgrass roots are subject to intense feeding pressure from a complex of scarab beetle grubs that includes the Japanese beetle, Popillia japonica Newman, and the European chafer, Rhizotrogus (Amphimallon)
majalis (Razoumowsky). Although grub response
to temperature has been described through field observations (Hartzell & McKenna 1939, Gyrisco et a1. 1954, Tashiro & Gambrell 1963, Tashiro et a1. 1969, Fleming 1972, Tashiro 1987) and micro-cosm studies (Villani & Wright 1988), the impor-tance of grub development on species-specific be-havior of the imature stages is generally unknown,
The annual vertical migration of scarab grubs and other soil insects in the soil profile is often associated with seasonal changes in soil tempera-ture (Villani & Wright 1990). Villani & Wright (1988) explored the effect of fluctuating soil tem-perature on Japanese beetle and European chafer grub movement patterns through the use of radio-graphic monitoring of soil-turfgrass microcosms. These studies indicated that third-instar Japanese beetles were highly responsive to changes in soil temperature, whereas European chafers were rel-atively insensitive to fluctuating temperatures. These results appear to parallel reports of field populations under similar temperature conditions. What is not clear, from field or previous laboratory
studies, is whether the seasonal movement of these grub species is a direct response to changes in soil temperature, a response triggered by grub age, or a combination of both. Knowledge of the behavior of Japanese beetle and European chafer grubs is crucial to asking more complex questions concern-ing the interaction of these insects with their en-vironment and with potential chemical and bio-logical control agents. The study reported here was designed to determine the influence of grub de-velopment on the movement of Japanese beetle and European chafer grubs in the soil profile from egg hatch through prepupation. This was done in soil-turfgrass microcosms to avoid confounding en-vironmental heterogeneity.
Materials and Methods
Japanese beetle and European chafer grubs were collected from untreated turfgrass in central New York state. Grubs were used in behavior studies soon after collection from the field or were held in soil-filled boxes at or near soil temperatures en-countered in the field (Table 1). For age classes tested immediately or soon after collection, these temperatures reflected those experienced by grubs immediately preceding their introduction into the microcosms. Overwintering grubs were stored at
Table J. Storage conditions and dates European chafer and Japanese beetle grubs were used in soil microcosm studies
Storage
Duration of Dates grubs Stage and species" temp,
storage, db were used in
oc; microcosms Neonate JB 7 Aug. Neonate EC 25 July Second-instar JB 14 Aug. Second-instar JB 21 Aug. Second-jnstar JB 10 7 28 Aug. Second-instar EC 21 Aug. Second-jnstar EC 10 7 28 Aug.
Early third-instar JB 20 5 11 Sept.
Early third-instar JB 20 12 18 Sept.
Early third-instar EC 11 Sept.
Early third-instar EC 20 7 18 Sept.
Prewinter JB 10 5 16 Oct. Prewinter JB 10 12 23 Oct. Prewinter EC 10 5 16 Oct. Prewinter EC 10 12 23 Oct. Early-overwinter JB 10,4.5 61,21 11 Dec. Early-overwinter JB 10,4.5 61,28 18 Dec. Early-overwinter EC 10,4.5 40,21 11 Dec. Early-overwinter EC 10,4.5 40,21 18 Dec. Late-overwinter JB 10 103 22 Jan. Late-overwinter JB 10 131 29 Jan. Late-overwinter EC 10 103 22 Jan. Late-overwinter EC 10 77 29 Jan. Postwinter JB 30 March Postwinter EC 10 60 30 March
aEC, European chafer; JB, Japanese beetle. b _, not stored, used immediately after collection.
temperatures slightly higher than those experi-enced in the field to avoid accidental freezing. As a result, the physiological age of overwintering grubs may be slightly greater than that of field popula-tions at the same time period. For this reason, shifts in behavior observed in laboratory-held overwin-tering grubs may actually anticipate similar changes in field populations. All grubs were held at 20°C for 24 h before being tested.
Soil-turfgrass microcosms were designed to pro-vide a simple experimental chamber for studying grub movement in which soil moisture, soil tem-perature, and matrix heterogeneity could be con-trolled. Sandy loam soil screened (0.5 by 0.5 em mesh) to ensure homogeneous soil condition was placed in the chamber, and sod that consisted of 25% each of 'Touchdown,' 'Glade,' 'Adelphi,' and 'Gnome' grass was placed at one end of the cham-ber. To balance soil moisture in the microcosms, a moist sponge was placed at the other end of each chamber opposite the sod. The addition of sponges at the ends of the microcosms opposite from the sod resulted in nearly symmetrical gradients of in-creasing soil moisture away from the center of the arena. Movement of the first instars of both species and early second-instar Japanese beetles within a soil profile was studied using destructive sampling, and later instars were studied with radiographic imaging (Villani&Wright 1988). Two experiments were conducted. The objective of both experiments was to measure the movement of different-aged
grubs in response to a potential host (sod) and grav-ity. Responses of seven age classes of grubs were studied.
In the first experiment, soil microcosms were placed in Plexiglass chambers with inside dimen-sions of 3 by 3 by 30 em. One side of each chamber was removable and had a hole (approximately 1 cm in diamter) drilled through the center. Duct tape covered the hole except when it was removed to allow placement of grubs at the midpoint of the chamber.
Chambers were filled with 250 g of soil, and the soil was compressed from the 30-cm length of the chamber to 21 cm (about 30 psi). A piece of sod was placed at one end of the chamber in contact with the soil and held in place by a wooden block. The other end was plugged with a damp sponge and a wooden block. These microcosms were kept uninfested in "sod up" or "sod down" positions overnight. The next day, grubs were introduced in the microcosms, which were then placed in com-plete darkness at 20°C. Except for neonates and second instars, microcosms were radiographed in sets of seven at 2, 3, 6, 12, 24, 27, 32, 48, 51, 56, and 72 h after the placement of grubs in the mi-crocosms. Each age class was studied in two sep-arate replicates 1 wk apart, with a total of 56 grubs of each species tested in each age class.
First-instar behavior was measured through de-structive sampling of the microcosms because the grubs were too small to radiograph. One hundred "sod up" and 100 "sod down" microcosms were each infested with three laboratory-reared, first-instar European chafers or Japanese beetles. The microcosms were divided into two sets to be opened at 24 and 72 h, at which time the location of the grubs was determined. Soil moisture was measured via standard gravimetric techniques; mean per-centage moisture when microcosms were set up was 9.92 (S2
=
1.91, n=
6). Additional soil moisture measurements were taken 24 and 72 h after grub infestation.Second-instar Japanese beetles were studied us-ing destructive samplus-ing and through the use of radiographs, whereas second-instar European cha-fers were large enough for the use of radiography alone. Destructive monitoring of Japanese beetles was similar to the procedure outlined for first in-stars. One hundred microcosms were each infested with two second-instar Japanese beetles. Micro-cosms were placed in an upright position, half with the sponge on top and half with the sod on top. The microcosms were divided into two sets to be opened at 24 and 72 h. In addition, 112 microcosms were infested with one European chafer or Japa-nese beetle grub and monitored using radiography at 3, 6, 12, 24, and 48 h. Data obtained using destructive sampling and radiographs were grouped for analysis.
Patterns of grub movement in the microcosms were analyzed in two ways. First, box plots (McGill et al. 1978) were used to portray the position of
Table 2. Means and standard deviations (0 =15) of percentage soil moisture in microcosms used in the first set of experiments 24 h after placement of grubs
Table 3. Means and standard deviations (0 = 2) of
percentage soil moisture in microcosms used in the second set of experiments
• ~ 110percentile
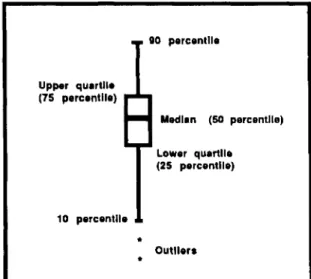
Fig. 1. Information provided by box plots used to display grub positiondata.
Position of sod Position in
f SD in microcosm microcosm Up Top 11.75 2.09 Up Middle 9.48 1.72 Up Bottom 11.44 1.84 Down Top 11.65 2.03 Down Middle 9.57 1.78 Down Bottom 11.59 1.74
the grub population at different points in time. Box plots are useful because they concisely summarize a distribution of observations and facilitate com-parison of two or more such distributions. Popu-lation level patterns of movement when disturbed (escape), dispersive movement, and arrestment at food are discernible through the use of box plots. An annotated box plot is illustrated in Fig. 1. Only box plots of the population distributions for 3, 24, 48, and 72 h are shown. Restricting the data pre-sented to dispersive patterns at relatively uniform time intervals is visually more straightforward and illustrates population trends well.
Although box plots are useful tools for visualizing the distribution of a population, they provide no information on the movement of individual grubs within a population. Use of the radiographic tech-nique makes it possible to monitor the movement of individual grubs over time (Villani & Wright 1988). To examine individual patterns of ment, we plotted the rate and direction of move-ment of each grub from time t to time t
+
1 as a function of the position in the soil profile at timet.
In this way, the movement patterns of individual grubs leading to the observed population distri-bution at timet
+
1 could be visualized.
Micro-cosm Vertical Rotated 90" Horizontal
arien· tation, f SO f SO f SO position" 0 6.1 1.5 6.5 1.4 5.9 0.9 3 4.4 0.6 4.9 0.8 4.0 0.8 6 3.1 0.1 3.3 0.2 3.0 0.3 9 2.8 0.1 2.8 0.8 2.7 0.0 12 2.7 0.1 2.7 0.1 2.6 0.1 15 3.0 0.5 3.0 0.5 2.7 0.1 18 5.0 1.0 4.4 1.2 3.6 0.6 21 7.5 1.1 6.8 0.4 6.4 3.3
" Position in centimeters from the sod.
Movement behavior in postoverwintering grubs that occurred in response to sod and in response to gravity was differentiated in the second experiment by manipulating the position of the soil microcosms to negate the influence of gravity. Experimental microcosms similar to those used in the first ex-periment but wider (25 by 3.5 by 35 cm) were used in this study. Turfgrass and sponges were placed on opposite ends of each chamber, as in the first experiment, but the microcosms were then placed in one of three positions. In the first position, mi-crocosms were vertical as in the previous set of experiments so that they were 35 cm high, 25 cm deep, and 3.5 cm wide (Fig. 14). For each species, eight chambers were used, four with the sod on the bottom of the chamber and four with the sod on the top. In the second position, the microcosms were rotated 90° from the vertical position so that they were 25 cm high, 35 cm wide, and 3.5 cm deep and the sod lay vertically along one 25-cm side (Fig. 15). For each species, eight chambers in this position were used. In the third position, the microcosms were placed in a horizontal position so that they, were 3.5 cm high, 35 cm wide, and 25 cm deep (Fig. 16). Microcosms were constructed as in the first experiment, except that 3.2 kg of loamy sand soil at 4% soil moisture was added, and the soil was compressed at 30 psi using an hydraulic press.
Microcosms were infested with either five post-overwintering third-instar European chafers or Japanese beetles 24 h after the microcosms were set up. One side of each of the chambers was re-moved, and five holes were made with a pencil halfway between the top and bottom edges of the soil approximately midway along the horizontal axis of the chambers. One grub was placed in each of the holes in the microcosms. Microcosms were radiographed 24 and 144 h after infestation. Per-centage soil moisture was also determined at these times by taking eight samples in each chamber at 3-cm intervals from the center. Grub movement was analyzed by plotting grub position in the mi-crocosms at 24 and 144 h and by comparing dis-tributions using log-linear models.
Medlen (50 percentile) Lower quertlle (25 percentile) Outlier. * * 10 percentile Upper quertllll (75 percentile) ", •••
~
13.0 13.0 o o o o o -6.S 0.0 6.5
Grub Location 6 hours
o o o
o
..
"
..
-
- - - -
-
-
0-
---
---o 00 0
Japanese Beetle (second instar) Sod Up
00 o 0 000 o o 0
~.'8.. :. ---
---
b"~"" oEuropean Chafer (second instar) Sod Down
2.0
b
c .2 U~
i5 011i~
1.0 /l.! c E-.,.r:. EN.,~
> , 0'"~
OJ ·1.0 ::0 '0:~
'0 .5 ·2.0 -13.0a
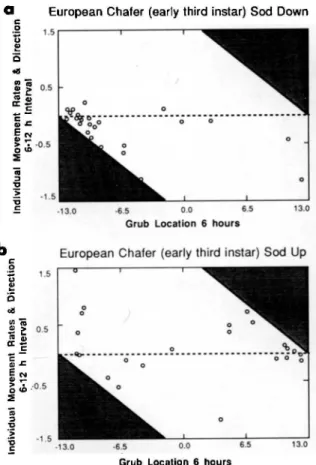
Fig. 4. Rates of movement of second-instar
Euro-pean chafers in "sod down" microcosms between6and 12h and Japanese beetles in "sod up" microcosms be-. tween24and48h. Shaded areas indicate combinations of rates and initial positons that could not be realized. Grubs at the shaded-unshaded interface are at the top or bottom boundaries of the microcosms.
24 72
·13.0
Hours
Fig. 2. Box plots depicting the distribution of first-instar European chafers and Japanese beetles at24and
72h after placement in microcosms with sod at the top (sad up) or bottom (sod down).
Results and Discussion
13.0 Q.
i
0E
-6.5 ~ -13.0 ~ 13.0 Q.c3
c 6.S il .g 0;§
-6.5 6.5 Neonate larvae EuropeanChafer JapaneseBeetlePercentage soil moisture within the soil profiles was virtually symmetrical from the chamber mid-points (Table 2). Therefore, the possible influence of moisture gradients on grub movement behavior can be ruled out.
Neonates. Most first-instar European chafers moved downward during the first 24 h regardless of sod position (Fig. 2). However, after 72 h, grubs in both treatments were found predominantly in the sod. Although position of the sod in the micro-cosms clearly influenced grub position, the high variability in neonate location at 72 h suggests that grubs are sampling the microcosm or that host-finding behavior contains a strong random element. The destructive sampling of this stage precluded analysis of individual grub movement over time that would have provided more insight into this behavior.
Second instar
EuropeanChater JapaneseBeetle
Hours
Fig. 3. Box plots depicting the distribution of sec-ond-instar European chafers at 3, 24, and 48 h and Jap-aneSe beetles at 3, 24, 48, and72 h after placement in microcosms with sod at the top (sod up) or bottom (sod down). 13.0
9
T
: 6.5 Q. ;l~
~
0E
·6.S Q. .r:. -13.0 Q. 13.0 Ol Cl!
6.S ~ 0 -6.S -13.0 24 48 ·72There was little movement of neonate Japanese beetle grubs in either treatment except for a slight trend downward, which was similar to the initial movement of neonate European chafers (Fig. 2). Because females normally place eggs 4-10 em deep in the soil (Fleming 1972), early first-instar Japa-nese beetles likely feed initially on organic matter and fine roots. This behavior pattern has been re-ported in other scarab species (Gray et al. 1947)_ The attractive or arrestant properties of turf grass roots to Japanese beetle grubs could not be ascer-tained at this stage in our study. The tendency of neonate Japanese beetles to be down in the soil profile may have important ramifications on timing of insecticide treatments and sampling if first in-stars have not yet moved to the soil-sod interface.
Second Instar. Second-instar European chafers in both "sod up" and "sod down" microcosms ex-hibited downward movement upon placement in microcosms (Fig. 3). After this initial movement downward, European chafers in both treatments showed indications of nondirected dispersive
Early third instar EuropeanChafer JapaneseBeetle o 13.0 o .6.S 0.0 6.S
Grub Location 6 hours 1.5
a
European Chafer (early third instar) Sod Downc o
~
~
is
oil.! ~
0.5~~
c--
;.e
EN ~ ~.O.5 ::s 24 48 72 72~~9~
¥~~~
~
¥$
13.0 .13.0~
·6.5 Q. 6.5"
~ 0E
.6.5 U£"
-a:g
a. Q) Cl16.5
oFig.6. Rates of movement of early third-instar Eu-rop~1llchafersbetween6and12h when sod was placed at the top or bottom of the microcosms.
are in the lower portion of the microcosms at this time. By comparison, grubs in the "sod up" mi-crocosms are positioned randomly in the profile at 6 h and moved randomly. Examination of the movement rates for the 56-72-h interval (Fig. 7a) reveals that a majority of the chafer grubs in the "sad up" microcosms have stopped movement in the sod at 56 h; however, the remaining grubs exhibited movement similar to those in the 6-12-h interval.
Box plots of early third-instar Japanese beetles indicate population distributions similar to those of earlier instars when sad was down in the turfgrass microcosm but a substantially different distribution when sod was up (Fig. 5). In "sad down" micro-cosms, Japanese beetles moved down in the profile and remained there. Analysis of rates of movement (Fig. 7b) in the "sad up" microcosms revealed a bimodal behavior; some grubs behaved very much like second instars (arrested in turf), whereas other grubs exhibited an apparently innate downward movement when placed in the microcosm and showed no further movement.
Studies focusing on the effect of temperature on Japanese beetle development rates (Regniere et al. 1981a) suggest that Japanese beetles undergo dia-pause as overwintering grubs. Our data indicate
13.0 o
o
o
.6.S 0.0 6.S
Grub Location 6 hours
o o o •.• ~ ....•.•.•.•...•....•...~ •....•...•.•.•....•...•... -~ Po o 0 0 0 o
European Chafer (early third instar) Sod Up
1.5 ·1.5 ·13.0 c ,9
c:;
e
is
oil!~
0.5 •• al a:E--
:;i.e
ENal-i;
cD ..0.5 :::!:b
HoursFig.5. Boxplots depicting the distribution of early third-instar European chafers and Japanese beetles at3, 24, 48, and72h after placement in microcosmswith sod at the top (sod up) or bottom (sod down).
movement patterns, presumably in search of food. The nondirected movement of European chafer grubs is apparent when rates of movement during the 6-12-h interval in "sod down" microcosms is studied. (Fig. 4). Grubs near the sod in the "sod down" microcosms (-13 cm) showed no tendency to move toward rather than away from the bottom of the microcosms, suggesting that contact with sod through random search and subsequent arrestment is important in this grub species, Arrestment in sad occurs in both "sod up" and "sod down" micro-cosms by the 48-h time period.
Japanese beetle grubs in both "sod up" and "sad down" microcosms exhibited initial downward movement (Fig. 3). In "sod down" microcosms, Japanese beetles remained at the bottom at the sod-soil interface. This behavior is in contrast to Eu-ropean chafer grubs in microcosms with similar sad placement; the Japanese beetle population is arrested in its entirety by the 24-h time period, whereas European chafer grubs are disperseo. through the microcosm and move in a random fashion (Fig. 4). Japanese beetles in "sod up" mi-crocosms exhibited both dispersive behavior (24 and 48 h) and arrestment in sod at 72 h. Rates of movement during the 24-48-h interval for "sad up" microcosms (Fig. 4) indicates a mass move-ment upward toward the host regardless of position at 24 h.
Early Third Instars. European chafer grubs in both "sad up" and "sad down" microcosms initially exhibited downward movement (Fig. 5). Compar-ison of box plots in "sad up" and "sod down" mi-crocosms indicates that grubs in both treatments were arrested in sad after 72 h, but population distributions were much tighter in the "sod down" microcosms. Examination of grub movement rates between 6 and 12 h for both treatments (Fig. 6a, b) indicates that grubs in "sad down" microcosms generally move downward in the profile regardless of their 6-h position, although most of the grubs
Fig. 7. Rates of movement of early third-instar Eu-ropean chafers and Japanese beetles between 56 and 72 h when sod was placed at the top of the microcosms.
Japanese Beetle European Chafer
Pre-overwinter third instar
24 72 3
Hours
Fig. 8. Box plots depicting the distribution of pre-overwintering third-instar European chafers and Japa-nese beetles at 3, 24, 48, and 72 h after placement in microcosms with sod at the top (sod up) or bottom (sod down).
the time of oviposition or the time of egg hatch may account for the bimodality observed .
Preoverwintering Third Instar. European cha-fer grubs at this stage show initial movement down in both "sod up" and "sod down" microcosms (Fig. 8). Subsequently, these grubs move upward and are arrested in sod in both the "sod up" microcosms and "sod down" microcosms, although the vari-ability in the distributions is greater in the "sod down" system. Rates of movement of grubs in "sod down" microcosms during the 56-72-h interval (Fig. 9) appear to have been random, a pattern similar to those of previous life stages. Note, however, that by 56 h, most of the grubs were in the upper port!on of the chamber. Our data suggest that chafer grub movement can be characterized by an initial move downward to the bottom of the chamber followed by a dispersive pattern leading to arrestment in sod when contact is made. Box and rate plot patterns at this stage indicate that movement patterns are consistent with early stages but that chafer grubs may not be arresting in sod in the "sod down" microcosm, whereas arrestment in "sod up" mi-crocosms seems to persist. This suggests that Eu-ropean chafer behavior (escape, dispersion, arrest-ment) is the product of age-specific response to a variety of external cues (disturbance, food, physical properties of soil, etc.). The relative importance of the external factors appears to shift as grubs age, and the setup of the experimental microcosms may cause these various cues to either reinforce or ne-gate one another. Although the propensity of pre-overwintering chafer grubs to arrest at a food source is not eliminated in the "sod up" microcosms, its role appears diminished, whereas the escape and dispersive behavior appears to remain strong. It is impossible to separate the strength of the external cue (sod) from the internal response (propensity to arrest); however, sod condition was held constant throughout the experiment, whereas grub behavior in both species shifted as grubs aged.
13.0 6.5 -13.0
0-j
0E
-6.5 £ -13.0 ~ 13.0is.
~ ,,6.5S
0~
-6.5 o 13.0 13.0 o -6.5Grub Location56 hours
o
o
European Chafer (early third instar) Sod Up
Japanese Beetle (early third instar) Sod Up
1.5 <: .2 '0 1.5
~
i5 011;~
Cia
0.5 0:] C'"••
E"•....
~~
:::E"-0.5 ii :J...
'S;:a
.:c~
••
Eo ~ ~.o.s ~u ii :J...
-;;;:a
.:b
<: .2 U~
i5 011 •• 0.5••
OJ a:a
that third-instar Japanese beetles exhibit behavioral patterns consistent with diapause. These grubs were collected in the field when soil temperatures were dropping in the field. The bimodal behavior may be the result of testing grubs that were not all at a stage of physiological development that was re-sponsive to this environmental cue. Alternatively, some grubs may have been at a depth in the soil that had not yet experienced low soil temperatures (soil cools first at the surface layers as air temper-ature drops in the fall [Villani & Wright 1990]).
It is also possible that third-ins tar Japanese bee-tles have evolved to "anticipate" the changing of the season by moving downward at a particular stage of their development. Third-instar Japanese beetles accidentally introduced to the Azores from the temperate United States move downward into the soil profile at approximately the same time as they do in the United States, even though soil tem-peratures in the Azores do not match those in the United States (M. Klein, personal communication). This suggests a physiological age-based mechanism for initiating changes in third-ins tar behavior. If changes in the behavior of Japanese beetle grubs are driven by the physiological age of the insect,
o 130 13.0 o o o o 00 °0 0 0 0 'be.0 -- Q .•..•..•.•..•.•..•..•..•. -- .•..•..•..•..•.----:-0 o 0 o
EurC?peanChafer (early-winter) Sod Up
European Chafer (early-winter) Sod Down
15 c .2 U f!
o
o 011 0::'!
0.5 0 1i~ a::£
~.c EN ~ to;-·0.5 ~:g iii :I...
.; ·15:c
.13.0 .Eb
a
Japanese beetle grubs at this stage were all found at the bottom of the microcosms regardless of the position of the sod. This parallels their behavior under field conditions when a mid-winter thaw occurs. Under such conditions, overwintering Jap-anese beetle grubs do not respond to temporarily warming surface temperatures as do European chafers. Instead, they remain at their overwinter-ing depth until sproverwinter-ing (Flemoverwinter-ing 1972).
Late-Winter Third Inslar. As with earlier in-stars, the initial movement for both species was downward into the soil profile. Both grub species aggregated near or in the sod in the microcosms regardless of its placement (Fig. 12), a pattern sim-ilar to that exhibited by second and early third instars. Patterns of movement rates were nearly identical in both species (Fig. 13).
More late-winter third-instar European chafers were arrested in sod than in previous stages. This data reinforces our hypothesis that European cha-fer grubs exhibit a shifting response to hosts while maintaining consistent movement patterns in the soil profile.
The positive response of late-winter Japanese beetle grubs to host plants may signal the breaking of diapause brought about by the development of the grubs and by the relatively warm soil
temper-·65 0.0
Grub Location 56 hours
Fig. II. Rates of movement of early-winter third-instar European chafers between56 and72h when sod was placed at the top or bottom of the microcosms.
o o 24 48 72 Japanese Beetle o 80
...
__.
__ _-__-~
~.~~_.
o o~European Chafer (pre-overwinter) Sod Down
. .. European Chafer 13.0
~8~
g.6.5 ~ 0e-
·6.5¢
~
·13 .• .&: 13.0 5.Q) 6.5 C1 .
~ -6.5 ·13.0 iii :I 'tI .; :g .5 .6.5 0.0 6.5 13.0Grub Location 56 hours
Fig.9. Ratesof movement of preoverwintering third-instar European chafers between56 and72h when sod was placed at the bottom of the microcosms.
Preoverwintering Japanese beetle grubs moved to and remained in the bottom of the microcosms regardless of sod placement (Fig. 8). They behaved in a fashion identical to that segment of the bimodal population distribution in the previous life stage that did not contact sod in the "sod up" micro-cosms. This supports the hypothesis that Japanese beetle movement down in the soil profile in the fall is regulated, at least in part, by the physiolog-ical state of the organism and is not merely a direct response to changes in the environment.
Early- Winter Third Instars. The importance of arrestment in the sod regardless of its placement in the microcosms reappeared for European cha-fers in the early overwintering stage (Fig. 10). Ex-amination of the movement rate data (Fig. 11) indicates population dispersion patterns are the re-sult of continued active movement of individuals rather than a wide distribution of stationary grubs. This is most clearly seen in the data for the "sod up" microcosms.
Early·winterthird instar
Hours
Fig.10. Boxplots depicting the distribution of early-winter third-instar European chafers and Japanese bee-tles at 3,24, 48,and72h after placement in microcosms with sod at the top (sod up) or bottom (sod down).
c .2 1.5
~
o
011•••
.! ~0.5 <0 • ':1:] <: .•••
ec-..
,..
~ ~ -0.5 ::Elate-winter third instar
a
European Chafer (late-winter) Sod Up 13.0 6.5~
~ 0E
-6.5 U ~ ·13.0 _ 13.0 a. Q) o 6.51
0 ~ -6.5 ·13.0European Chafer Japanese Beetle
Fig. 13. Rates of movement of late-winter third-instar European chafers and Japanese beetles between
56 and 72 h when sod was placed at the top of the microcosms.
lower half of the microcosms exceeded the per-centage in the upper half at 24 and 144 h; however, 95% confidence intervals for the estimated per-centages overlapped at 144 h, and the differences were therefore not considered significant. The grubs showed no propensity to arrest in sod,
By comparison, Japanese beetle grubs were found primarily at the top of the microcosms, and the position of the sod strongly influenced the binary distributional pattern (at 24 h, X'
=
5.78; df=
1; P=
0.016; at 144 h, X'=
15.48; df=
1; P=
0.00). When the sod was on the bottom of the microcosms, some Japanese beetle grubs (26.3% at 24 hand 57.9% at 144 h) were found in the lower half; however, this never occurred when the sod was on the top (Fig. 14). There was a trend for more grubs to be in the lower half of the microcosm at 144 h, even though aX'test indicated there was no effect of time on the distribution patterns(x'
=
3.6; df=
4; P =0.45).When the microcosms were rotated 900 from the vertical position (Fig. 15), the additive effect of gravity and sod on the distribution of grubs could be examined because the distribution of the grubs could now be described using four categories (up,
13.0
o o
o o
Japanese Beetle (late-winter) Sod Up
'l,
o
.•..•..•. Do..
_0._
~ .
o 0
Grub Locallon 56 hours c: .2 15 U
e
o oll .,ii~ '=
lD •• 05 a:]1 ~.t: EN ~ "';" ~O.5~:g
Ii :J...
'>
-1.5 :g -JM.:
b
HoursFig.12. Box plots depicting the distribution of late-winter third-instar European chafers and Japanese bee-tles at3, 24, 48,and72h after placement in microcosms with sad at the top (sad up) or bottom (sad down).
atures in the microcosms. The lack of response of earlier third-instar stages to this warm environment suggests the existence of internal processes that pre-vent premature breaking of diapause. The inter-active effect of development stage and temperature on life processes of grubs has been reported by other researchers. Ludwig (1928), working with Japanese beetle grubs, suggested that different stages of the life cycle are not affected to the same degree by temperature and that third instars could be par-titioned into distinct slow- and fast-developing cat-egories (Ludwig 1928, 1932); however, this could not be confirmed in later studies by Regniere et al. (1981a,b).
Studies with the grub Anomala cuprea (Hope)
in Japan indicate that changes in soil temperature can modify development (Fujiyama & Takahashi
1973a, 1977) as well as induce and terminate dia-pause (Fujiyama & Takahashi 1973b, Fujiyama 1983). Wightman (1974) indicated that chilling is needed to induce pupation of Costelytra zealan-dica (White), but larvae must reach some
devel-opmental threshold before inducement will occur. Furthermore, temperatures must rise and exceed some minimum threshold in the spring before the processes that lead to pupation will commence.
Postoverwintering Third Instars. Movement of
postoverwintering third·-instar European chafers in the vertical microcosms was downward to the bot-tom of the microcosms regardless of the placement of the sod (Fig. 14). The dispersion of the grubs did not differ at 24 or 144 h when the animals were classified as being either in the upper or lower half of the microcosms (X'
=
2.71; df=
4; P=
0.607). However, when examined visually (Fig. 14), the distribution of grubs was more diffuse at 144 h. The position of the sod had no effect on the binary (upper or lower half of the microcosms) classifi-cation of grub position at either time (at 24 h, the distributions were identical; at 144 h,X' =2.57; df=
1; P=
0.103). The percentage of grubs in theEUROPEAN CHAFER
•
••
••
•••
•
••
•
••
•
••
•••
•
I_
Grub Po.llionI
•
-:
0..
,
-
•
•
•
·
••
·
}
·
0•
•
·
•
~
•
.:
• •
# JAPANESE BEETLE•
•
,
•
•
•
• •
,
.
•
••
.:
••
• •
•
•
:.
•.j.
~
.
• 0~
,,•
•••
•
:
r
• .e...~.
: •..
0.
~:
.:
o.
EUROPEAN CHAFER•••
•
••
"-UI a:••
:z:..•
••
~
• •
UI a: :z:..•
'"
ftt/I.•• _0 o o o 0 00 00 000 o 0 o JAPANESE BEETLE • tP· 0o•• .,~ o o <b o 0 o o 0--.----
"-
.
o 0 o•
o•
o•
o•
•
o ••.•••••••••• 0- ••• - ••••
o 0 rf' •• ,. 0....
-& o~ o .. ...._• .a ••• _•..•.••• ••
•
•• 8
•
"::>000· ·1>0 oOoo'·Ab a: :z:..•
:!
Ul a: :z:..•
'"
Fig. 16. Position of individual postwinter third-in-star European chafers and Japanese beetles24and 144 h after placement of grubs in horizontal microcosms.
down; sod, no sod). European chafer grubs were indifferent to hosts and were positively geotropic. There was no difference in the distribution of cha-fer grubs at 24 and 144 h (X2
=
0.44; df=
3;P=
0.93). At 144 h, 12.5% of the grubs were found in each of the upper quadrats of the microcosms (with and without sod), and 37.5% were found in each of the lower quadrats (with and without sod). The 95% confidence intervals for these multinomial class probabilities overlapped. If, however, a binary dis-tribution is considered, there were significantly more grubs at 144 h in the lower half (75%) than in the upper half of the microcosms.
Japanese beetle grubs responded negatively to gravity and positively to sod by aggregating in the upper quadrats with sod at both 24 and 144 h. There was no difference in the distributions at these two times (X2
=
4.07; df=
3; P=
0.254). At 144 h, 75% of the Japanese beetle grubs were in the upper quadrat with sod, 15% were in the upper quadrat without sod, 10% were in the lower quad-rat with sod, and none was found in the lower quadrat with no sod. These multinomial class per-centages suggest that a response to gravity and to sod combined in a positive manner to determine the distribution of grubs. These results are not un-equivocal because the 95% confidence intervals for all but the largest class percentage overlap.By placing the microcosms in a horizontal po-sition, the innate response of grubs to gravity ob-served in the vertical orientation and that rotated 90" was physicallly negated because the sod and sponges were in the same plane (Fig. 16). European
I.
Grub PositionI
S o o•
.:e
o o o o •• 0 ••.
-:
·
.
.:
:.
o• Grub Position 'Sod up' o Grub Position 'Sod down'
JAPANESE BEETLE
·
• 0 o·
...
~_
...•..~-•
•
•
SOD S P o N G E EUROPEAN CHAFER.
;-.
.:
III ••~.
oo:t -.---..:
••. -~- •••• ---- •••• _....•
.
,:
••
•
.1.
• :•• ~
••
• •• II. ":.
UI • a: •• :z: • 0 • 'It' •• _._-_ •• , •• _~.-: ••• __ •••• ('II. :_ ••..
~
:..
.'
...
-
:
..
,"
..
Fig.15. Position of individual postwinter and third-instar European chafers and Japanese beetles24and144 h after placement of grubs in microcosms rotated90".
SOD
Fig. 14. Position of individual postwinter third-in-star European chafers and Japanese beetles24and 144 h after placement in vertical microcosms.
chafers exhibited apparently random movement at both 24 and 144 h, resulting in approximately equal numbers of grubs on either side of the microcosm with no indication of arrestment in sod. In the absence of gravity, Japanese beetle grubs were found predominantly in sod at 24 h (77.5%) and 144 h (84.6%). Elimination of the influence of grav-ity on Japanese beetles still resulted in rapid ar-restment in the sod.
The initial movement downward by Japanese beetles that was evident in prior stages was not apparent in this experiment. It is possible that grub movement upward in the soil profile rather than downward is adaptive in bringing grubs into the root zone in spring. The data shown in Fig. 14 suggest that Japanese beetles in this growth stage show an innate negative geotropic response with arrestment when they contact the sod. In addition, when the grubs do not locate sod, they commence a more random search behavior throughout the soil profile.
In contrast, European chafer grubs showed no response to the sod and exhibited only a positive geotropic response. The most likely explanation for this is that, before the experiment, the grubs had matured to the point where location of pupation sites was the primary factor driving movement pat-terns. By this time, European chafer grubs have ceased feeding and sod would have no influence on behavior.
Soil moisture has been shown to influence the movement patterns of grubs (Villani & Wright 1988); however, it is improbable that soil moisture played a role in these experiments. Percentage soil moisture within the soil profile was virtually sym-metrical from the chamber midpoints (Table 3), although the end of the chambers containing the sod were somewhat drier than the side of the cham-bers containing sponges (range, 0.5-2.6%). Re-gardless of the treatment, grubs did not respond primarily to moisture levels. Villani &Wright (1988) showed that Japanese beetles moved to areas of higher soil moisture, the opposite of what we ob-served. Clearly, Japanese beetle movement pat-terns at this stage were directed primarily by grav-ity and food source, whereas European chafers were directed primarily by gravity.
Miller &Strickler (1984) asked what mechanisms and strategies shaped the patterns of resource use by insects in a heterogeneous world. They sug-gested that finding and accepting host plants results from a shifting balance of negative and positive internal and external inputs. The shifting balance analogy is applicable to the behavior of European chafer and Japanese beetle grubs. Stage of devel-opment or prior experience shapes the response of grubs of both species to the various external stimuli present in the microcosms. Internal and external factors may work in concert. For example, innate movement downward in the profile upon distur-bance, the propensity to arrest in sod, and the placement of sod at the bottom of microcosms
pro-duce behaviors with apparent directed movement. By contrast, conflicting internal and external cues may cause apparent nondirected movement and highly dispersed populations as with innate down-ward movement, weak arrestment in the sod, and sod placement at the top of the microcosms.
Previous studies of European chafer and Japa-nese beetle grub movement in response to changes in the soil environment have focused on the direct response of these species to changes in soil moisture and temperature. Data presented here indicate that the development stage of the grub has a large effect on Japanese beetle grub behavior and a measur-able, but lesser, effect on European chafers. This stage-related effect does not preclude a direct effect of the environment on grub behavior of both spe-cies should soil conditions dictate their need to escape noncyclical deterioration of their environ-ments (soil moisture or sudden and unseasonable changes in soil temperature) (Regniere et al. 1981c). Understanding the fundamental differences in be-havioral response to soil factors among species of soil insects will enhance our ability to predict the stress each species can inflict on a crop and to predict the outcome of interactions between grubs and biological and chemical control agents.
Acknowledgment
We thank F. Consolie, L. Preston-Wilsey, Nancy Con-solie, Marylou Hessney, and Roseanne Consolie for tire-less technical support. P. Schroeder and C. Eckenrode made numerous helpful suggestions for improving early drafts of this manuscript. We are grateful for partial support for this project through grants from the New York State Integrated Pest Management Program, the New York State Turfgrass Association, Northeast Re-gional Project 169, and the Office for Research. Cornell University Experiment Station, Ithaca, N.Y.
References Cited
Fleming, W. E. 1972. Biologyof the Japanese beetle. USDA Technical Bulletin 1449.
Fujiyama, S. 1983. The larval diapause of three scar-abaeid beetles and its function in their life cycles, pp. 149-166. In V. K. Brown&I. Hodek [eds.l, Diapause and life cycle strategies in insects. The Hague. Fujiyama, S.&F.Takahashi. 1977. The survival rate
and the duration of development inAmomala cupTea under the thermal changes along with its develop-mental stage. Environ. Control BioI. 15: 19-25. 1973a. Studies on the self-regulation of the life cycle
inAmomala cupTea. I. The effects of constant tem-perature on the developmental stages. Mem. Agric. Kyoto Univ. 104: 23-30.
1973b. Studies on the self-regulation of the life cycle inAmomala cuprea. II. The effects of low temper-ature and photoperiod on the induction and termi-nation of the larval diapause. Mem. Coli. Agric. Kyoto Univ. 104: 31-39.
Gray, R. A. H., W. V. Peet &
J.
P. Rogerson. 1947. Observations on the chafer grub problem in the lake district. Bull Entomol. Res. 37: 455-468.Logolhelis & H. H. Schwardt. 1954. Biology of European chafer, Amphimallon majalis Razou-mowsky (Scarabaeidae). Cornell University Agricul-tural Experiment Station Memoir 328, Ithaca, N.Y. Hartzell, A.& G. F. McKenna. 1939. Vertical
mi-gration of Japanese beetle larvae. Contrib. Boyce Thompson Inst. 11: 87-9l.
Ludwig, D. 1928. The effects of temperature on the development of an insect (Popillia japonica). Physiol. Zool. 1: 358-389.
1932. The effect of temperature on the growth curves of the Japanese beetle (Popillia japonica Newman). Physiol. Zool. 5: 431-447.
McGill, R.,J.W. Tukey &W. A. Larsen. 1978. Vari-ations of box plots. Am. Stat. 32: 12-16.
Miller, J. R.& K. L. Strickler. 1984. Finding and accepting host plants, pp. 127-157. In W. J. Bell&
R. T. Carde [eds.], Chemical ecology of insects. Chap-man & Hall, New York.
Regniere, J., R. L. Rabb & R. E. Stinner. 1981a.
Popillia japonica: seasonal history and associated Scarabaeidae in eastern North Carolina. Environ. En-tomol. 10: 297-300.
1981b. Popillia japonica: simulation of
temperature-dependent development of immatures, and predic-tion of adult emergence. Environ. Entomol. 10: 290-296.
1981c. Popillia japonica: effect of soil moisture and
texture on survival and development of eggs and first instar grubs. Environ. Entomol. 10: 654-660. Tashiro, H. 1987. Turfgrass insects of the United
States and Canada. Cornell University Press, Ithaca,
N.Y.
Tashiro, H. &F. L. Gambrell. 1963. Correlation of European chafer development with the flowering pe-riod of common plants. Ann. Entomol. Soc. Am. 56: 239-243.
Tashiro, H., G. G. Gyrisco, F. L. Gambrell, B.J.Fiori
&H. Breitfeld. 1969. Biology of European chafer,
Amphimallon majalis Razoumowsky (Scarabaeidae)
in northeastern United States. New York Agricultural Experiment Station Bulletin 1366, Geneva.
Villani, M. G.&R.J.Wright. 1988. Use of radiog-raphy in behavioral studies of turfgrass-infesting scar-ab grub species (Coleoptera: Scarscar-abaeidae). Bull. En-tomol. Soc. Am. 34(3): 132-144.
1990. Environmental influences on soil macro-arthro-pod behavior in agricultural systems. Annu. Rev. En-tomol. 35: 249-269.
Wightman, J.A. 1974. Influence of low temperature on pupation induction in Costelytra zealandica (Co-leoptera: Scarabaeidae). New Zealand Journal of Zo-ology, 1: 503-507.
Received for publication 11 May 1990; accepted 16 August 1990.