Incidence and duration of severe wasting in two African
populations
Michel Garenne
1,*, Douladel Willie
2, Bernard Maire
3, Olivier Fontaine
4,
Roger Eeckels
5, Andre´ Briend
4and Jan Van den Broeck
21IRD and Institut Pasteur, Epidemiologie des Maladies Emergentes, 25 rue du Docteur Roux, F-75015, Paris,
France:2Epidemiology Research Unit, Tropical Medicine Research Institute, University of West Indies, Kingston, Jamaica:3IRD, Montpellier, France:4IRD and World Health Organization, Geneva, Switzerland:5Department of
Paediatrics, Catholic University of Leuven, Leuven, Belgium
Submitted 16 August 2008: Accepted 1 December 2008: First published online 3 March 2009 Abstract
Objective: The present study aimed to compare two situations of endemic malnutrition among ,5-year-old African children and to estimate the incidence, the duration and the case fatality of severe wasting episodes.
Design: Secondary analysis of longitudinal studies, conducted several years ago, which allowed incidence and duration to be calculated from transition rates. The first site was Niakhar in Senegal, an area under demographic surveillance, where we followed a cohort of children in 1983–5. The second site was Bwamanda in the Democratic Republic of Congo, where we followed a cohort of children in 1989–92. Both studies enrolled about 5000 children, who were followed by routine visits and systematic anthropometric assessment, every 6 months in the first case and every 3 months in the second case.
Results: Niakhar had less stunting, more wasting and higher death rates than Bwamanda. Differences in cause-specific mortality included more diarrhoeal dis-eases, more marasmus, but less malaria and severe anaemia in Niakhar. Severe wasting had a higher incidence, a higher prevalence and a more marked age profile in Niakhar. However, despite the differences, the estimated mean durations of episodes of severe wasting, calculated by multi-state life table, were similar in the two studies (7?5 months). Noteworthy were the differences in the prevalence and incidence of severe wasting depending on the anthropometric indicator (weight-for-height Z-score #–3.0 or mid upper-arm circumference ,110 mm) and the reference system (National Center for Health Statistics 1977, Centers for Disease Control and Prevention 2000 or Multicentre Growth Reference Study 2006). Conclusions: Severe wasting appeared as one of the leading cause of death among under-fives: it had a high incidence (about 2 % per child-semester), long duration of episodes and high case fatality rates (6 to 12 %).
Keywords Under-fives Anthropometry Severe wasting Malnutrition Weight-for-height Mid upper-arm circumference Mortality Incidence Case fatality Multi-state life tables Sub-Saharan Africa Niakhar Bwamanda
Severe wasting, defined as very low weight-for-height or as very small arm circumference for age, is frequent among under-fives in developing countries, and is an indication for urgent medical attention and intensive nutritional rehabilitation. Severe wasting has drawn the attention of nutritionists for a long time and, despite overall improvements in nutritional status, has become again a subject of research because treatment for severe wasting has improved dramatically and become increasingly efficient in recent years(1–4).
Severe wasting is often seen as a nutritional risk factor for mortality from other causes of death. Indeed, numerous studies have shown that children with severe wasting have much higher risks of death than children
with anthropometric indicators above the median(5–17). However, severe wasting can also be seen as a disease per se, for which classic epidemiological indicators can be computed, such as prevalence, incidence, duration of episodes and case fatality. Calculation of such indicators requires a longitudinal study, where children can be monitored over time and episodes of malnutrition iden-tified. Owing to the long process leading to severe wasting and the long time for recovery, only few such studies have been conducted in developing countries. A review of the literature conducted recently by one of the authors (A.B.) did not reveal any publication with proper estimates of incidence and duration of episodes of severe wasting.
In the current paper we present two contrasted situa-tions – one in West Africa, the other in Central Africa – with different patterns of malnutrition and different profiles of causes of death. We have developed a way of calculating epidemiological indicators from longitudinal studies conducted several years ago, which were not full-scale cohort studies from birth to age 5 years, but which provided data enabling incidence and duration to be calculated from transition rates. This information still appears valuable, since it has policy implications for treatment of severe child malnutrition. Although we note that the average nutritional situation has somewhat improved worldwide since the 1980s, severe malnutrition still remains a problem in many rural areas in developing countries, as is well documented by numerous surveys, such as the Demographic and Health Surveys(18), and by a recent series of articles published in The Lancet(19).
Data and methods
The first site, Niakhar, is located in rural Senegal, some 150 km east of Dakar, the country’s capital city. The study site and the study design are described elsewhere(16,20). In brief, we followed an open cohort of about 5000 children, covering all under-fives living in thirty villages. We visited the children four times at 6-month intervals in May and November of 1983 and 1984. At each visit comprehensive anthropometric measurements were taken (weight, height, head circumference, arm circumference, triceps skinfold and subscapular skinfold). All measures were taken by the researchers themselves (B.M. and O.F.) after careful standardization and using state-of-the-art equipment: Seca R
scales with a precision of 10 g and Holtain R
length/height boards with a precision of 1 mm(16). Survival within 6 months was monitored for all children, and long-term survival was also known for virtually all children from the demographic surveillance system, with detailed causes of death obtained by verbal autopsy(21).
The second site, Bwamanda, is located in the Demo-cratic Republic of Congo (Zaire at that time), in the north-western province of Equateur. The study site and the study design are also described elsewhere(22). In brief, an open cohort of about 5000 under-fives was followed for about two years. Children were seen six times at 3-month intervals, from October 1989 to February 1991. Each visit included anthropometric measurements (weight, height, arm circumference, triceps skinfold). Weight was mea-sured in the nude with spring scales to the nearest 100 g and length or height with a locally designed measuring board to the nearest millimetre; field workers were trained extensively in anthropometric standardization, including use of the Frankfort plane for length and height. Child survival was monitored up to 15 April 1992, i.e. at least 12 months after the last visit, also with detailed
causes of death. The two studies are therefore compar-able in size and methods, with the frequency of visits being the main difference.
Both sites are located in the African savannah, with the Niakhar area being somewhat drier and the Bwamanda area having forest galleries along rivers. Both areas have a dry and a rainy season at about the same time, although the rainy season in shorter in Niakhar (July to October) than in Bwamanda (June to November). In both areas malaria is holoendemic, with major peaks of transmission during the rainy season. Staple diet in Niakhar is millet or sorghum, occasionally rice or maize, supplemented with local vegetables, peanut sauce and dried fish, prepared as a kind of couscous (steamed millet), and served two to three times daily. Staple diet in Bwamanda is maize and cassava, also supplemented with vegetables, peanuts and fish, prepared as a kind of sticky porridge, and served once or twice daily. In theory both diets are balanced, assuming the family is wealthy enough, and the main difference is the staple food (millet/sorghum v. maize/ cassava). The main sources of water in Niakhar are shallow wells, although some deep wells were recently built in the largest villages; water is kept in clay tanks at home, a major source of contamination with water-borne germs because of poor hygienic practices. Water in Bwamanda comes primarily from deep tube wells. Also worth noticing is the difference in body shapes between the two populations: the Niakhar population belongs almost exclusively to the Sereer ethnic group, a Sahelian group with rather long legs compared with the trunk, whereas the Bwamanda population belongs primarily to the Ngbaka ethnic group, stocky Bantu people with rather short legs compared with the trunk.
We defined severe wasting in two ways, from the two indicators routinely used in screening programmes: mid upper-arm circumference (MUAC) ,110 mm and weight-for-height Z-score (WHZ) #23.0. The Z-score was calculated using the Centers for Disease Control and Prevention 2000 child growth charts (CDC-2000), because it was found the most robust system and the one with the best screening power for mortality in Niakhar(23). We also provide equivalent calculations using the National Center for Health Statistics 1977 child growth references (NCHS-1977) and the WHO Multicentre Growth Refer-ence Study 2006 child growth standards (MGRS-2006) for comparison(24,25). In both cases, the interval used for the comparative analysis was 6 months (each second visit in the case of Bwamanda), the common denominator for the two surveys. We defined incident cases as children being above the threshold at previous visit and below the threshold at next visit. Recovery cases were the opposite: below the threshold at previous visit and above the threshold at next visit. Mortality was defined as death within 6 months after a visit.
In both studies, we constructed a multi-state life table using standard formulae(26). In brief, a synthetic cohort is
built from transition rates measured in the population and describes the population in each state and in each 6-month age group. The states were: ‘alive above threshold’, ‘alive below threshold’, ‘deceased while above threshold’ and ‘deceased while below threshold’. The transitions were ‘incident case’, ‘recovery case’ and ‘mortality’. This multi-state life table provided therefore all basic epidemiological indicators of the morbidity process: the incidence, duration of episodes and case fatality for the under-fives.
Results
Basic population characteristics
The samples were of comparable size, 5751 children in Niakhar and 5167 children in Bwamanda, and there were more measurements taken in the six visits in Bwamanda than in the four visits in Niakhar (Table 1). Mortality, calculated as the probability of dying between 1 and 60 months (post-neonatal under-five mortality), was higher in Niakhar in 1983–4 (227 per 1000, based on 356 deaths) than in Bwamanda in 1989–92 (131 per 1000, based on 215 deaths), the difference being highly significant (rela-tive risk 5 1?73, 95 % CI 1?46, 2?05; P 5 2 3 10210).
The causes of death were also different. In Niakhar, mortality from diarrheal diseases was 5?9 times higher than in Bwamanda, and mortality from vaccine-preventable dis-eases (primarily measles and whooping cough) was 4?8 times higher. In contrast, mortality from malaria and severe
anaemia was 2?3 times higher in Bwamanda than in Nia-khar, and mortality from severe malnutrition (kwashiorkor and marasmus) was 2?7 times higher, all these differences being statistically significant (P , 0?05). In addition, the profile of mortality from malnutrition was different, with similar numbers of kwashiorkor and marasmus deaths in Bwamanda, whereas in Niakhar kwashiorkor accounted for about a third of deaths coded as severe malnutrition and typical clinical marasmus for about a sixth, others being cases of severe wasting.
Stunting was less prevalent in Niakhar than in Bwa-manda (average height-for-age Z-score (HAZ): 21?09 v. 22.00) and wasting was somewhat more prevalent (average WHZ: 20?77 v. 20?58). However, MUAC was on average higher in Niakhar (142 mm v. 130 mm). Standard deviations of the distributions of the four indicators were similar, with somewhat higher values for WAZ (weight-for-age Z-score) in Bwamanda (associated with a lower mean) and somewhat smaller values for MUAC (also associated with a lower mean). These observations had serious implications for the distribution of severe mal-nutrition, and especially for the proportions of children below a given threshold.
Among children aged 1–59 months, the prevalence of severe malnutrition (WAZ , 23?0) was similar in the two sites (10?3 % in Niakhar, 11?8 % in Bwamanda). However, due to the large difference in stunting, severe wasting defined by WHZ # 23?0 was somewhat more prevalent in Niakhar (3?2 % v. 2?9 %), whereas it was less prevalent Table 1 Demographic characteristics and nutritional status in the two sites
Niakhar Bwamanda
(Senegal) (Dem. Rep. Congo)
Study design and sample size
Period 1983–5 1989–92
Number of children enrolled 5751 5167
Number of measurements taken 14 307 22 805
Frequency of visits 6 months 3 4 times 3 months 3 6 times
Child survival and cause of death
Post-neonatal death rate (1–59 months) 227 per 1000 131 per 1000
Malaria & severe anaemia 19?9 45?8
ALRI 35?6 25?6
Diarrhoea 69?2 11?7
Severe malnutrition 6?8 18?6
Vaccine-preventable diseases 30?4 6?4
Others & unknown 65?0 22?9
Mean SD Mean SD
Nutritional status (1–59 months)
WAZ 21?304 1?280 21?884 1?398
HAZ 21?087 1?271 21?997 1?263
WHZ 20?767 1?202 20?580 1?201
MUAC (mm) 141?6 14?4 130?4 12?7
% %
Prevalence of severe wasting
Proportion WHZ # 23?0 3?2 2?9
Proportion MUAC , 110 mm 1?7 4?6
ALRI, acute lower respiratory infection; WAZ, weight-for-age Z-score; HAZ, height-for-age Z-score; WHZ, weight-for-height Z-score; MUAC, mid upper-arm circumference.
when defined by MUAC , 110 mm (1?7 % v. 4?6 %). This shows that the patterns of malnutrition were different in the two sites, even though the overall prevalence was similar, and that different indicators could lead to different conclusions (Fig. 1).
Prevalence of severe wasting in the cohorts The age profiles of severe wasting were somewhat different in the two sites (Fig. 2, Tables 2a and 2b). In Niakhar, the proportion with WHZ # 23?0 increased rapidly with age in the first year, became very high between 12 and 30 months and lower thereafter, whereas severe wasting was more uniform in Bwamanda, with a smaller rise in infancy and a slower decline after 30 months. With respect to low
MUAC, prevalence was much higher in Bwamanda and the decline was rapid with age. For children aged 1–59 months, MUAC prevalence of severe wasting was 2?7 times higher in Bwamanda (P , 10210). Even ignoring children below 6 months of age, for whom MUAC should not be used without adjusting for age, MUAC , 110 mm appeared to be overestimating the prevalence of severe wasting in the very young in Bwamanda, but underestimating the prevalence at 12–35 months in Niakhar.
Incidence of severe wasting in the cohorts
Incidence of severe wasting reflected the differences in prevalence (Fig. 3, Tables 2a and 2b). Using WHZ, the incidence was of the same magnitude in the two sites
0 10 20 30 40 50 60
WAZ < –2·0 HAZ < –2·0 WHZ < –2·0 MUAC < 125 mm
Percentage below threshold
Fig. 1 Prevalence of moderate malnutrition in children aged 6–59 months, Niakhar (Senegal; ) and Bwamanda (Democratic Republic of Congo; ). WAZ, weight-for-age Z-score; HAZ, height-for-age Z-score; WHZ, weight-for-height Z-score; MUAC, mid upper-arm circumference 0 2 4 6 8 10 12 0 6 12 18 24 30 36 42 48 54 60 Age (months)
Percentage below threshold
Fig. 2 Prevalence of severe wasting by age (population estimates) according to weight-for-height Z-score (WHZ) and mid upper-arm circumference (MUAC): Niakhar (Senegal; —m—, WHZ; – –m– –, MUAC) and Bwamanda (Democratic Republic of Congo; —J—, WHZ; – –J– –, MUAC). Thresholds: WHZ # 23?0 and MUAC , 110 mm
Table 2a Multi-state life table of competing risks of severe wasting and mortality among under-fives in Niakhar (Senegal) and Bwamanda (Democratic Republic of Congo), based on weight-for-height Z-score #23?0
Survivors New cases of severe Deaths
(at start of interval) wasting (in interval) (in interval)
Age group (months) Non-severe Severe wasting Recovery cases Incident cases Non-severe Severe wasting Niakhar 0–5 100 000 0 0 3038 3959 0 6–11 93 003 3038 1530 6055 3422 196 12–17 85 056 7367 5026 4772 2028 905 18–23 83 282 6208 3622 3758 3874 439 24–29 79 272 5905 4139 1237 2588 914 30–35 79 586 2089 1819 863 1624 179 36–41 78 918 954 859 356 767 95 42–47 78 654 356 356 428 560 0 48–53 78 022 428 428 789 345 0 54–59 77 316 789 789 737 685 0 601 76 683 737 Total 833 109 27 134 18 568 22 033 19 852 2728 Bwamanda 0–5 100 000 0 0 2857 3933 0 6–11 93 210 2857 1782 4144 2475 184 12–17 88 373 5035 3431 2497 1049 285 18–23 88 258 3816 2529 2969 1183 85 24–29 86 635 4171 2937 1690 891 185 30–35 86 991 2739 1997 1663 733 114 36–41 86 592 2291 1532 1140 395 146 42–47 86 589 1753 1132 658 273 88 48–53 86 790 1191 971 926 239 44 54–59 86 596 1102 593 536 186 48 601 86 467 997 Total 890 034 24 955 16 904 19 080 11 357 1179
Table 2b Multi-state life table of competing risks of severe wasting and mortality among under-fives in Niakhar (Senegal) and Bwamanda (Democratic Republic of Congo), based on mid upper-arm circumference ,110 mm
Survivors New cases of severe Deaths
(at start of interval) wasting (in interval) (in interval)
Age group (months) Non-severe Severe wasting Recovery cases Incident cases Non-severe Severe wasting Niakhar 0–5 100 000 0 0 1928 3598 0 6–11 94 474 1928 1140 1529 3553 86 12–17 90 532 2231 1339 970 2466 446 18–23 88 435 1416 954 908 4131 224 24–29 84 350 1146 611 313 3013 382 30–35 81 635 466 349 96 1755 117 36–41 80 133 96 96 90 835 0 42–47 79 304 90 68 0 562 0 48–53 78 810 22 22 0 347 0 54–59 78 485 0 0 0 691 0 601 77 794 0 Total 856 158 7395 4579 5834 20 951 1255 Bwamanda 0–5 100 000 0 0 6816 2906 0 6–11 90 278 6816 3988 3342 2338 296 12–17 88 586 5874 4044 3399 1072 248 18–23 88 159 4981 3332 3474 1095 208 24–29 86 922 4915 3528 1193 895 211 30–35 88 362 2369 1785 1240 776 108 36–41 88 131 1716 1165 537 443 114 42–47 88 316 974 430 165 275 115 48–53 88 306 594 594 255 289 0 54–59 88 356 255 141 0 188 43 601 88 309 71 Total 880 370 39 896 23 983 25 762 10 336 1779
(2?6 % per child-semester in Niakhar, 2?1 % in Bwamanda), whereas it was much lower in Niakhar for MUAC. In Nia-khar, the peak incidence was at 6–11 months, with very high values (6?3 %), almost 50 % more than in Bwamanda at the same age (4?3 %). The age profile was again somewhat different, with a faster decline in Niakhar from 18 to 36 months to reach low values, whereas in Bwamanda inci-dence declined more slowly from 6–11 months to 42–47 months. Incidence measured by MUAC , 110 mm tended to be much lower than that obtained with WHZ # –3?0 in Niakhar, but quite close in Bwamanda.
Frequency and duration of episodes
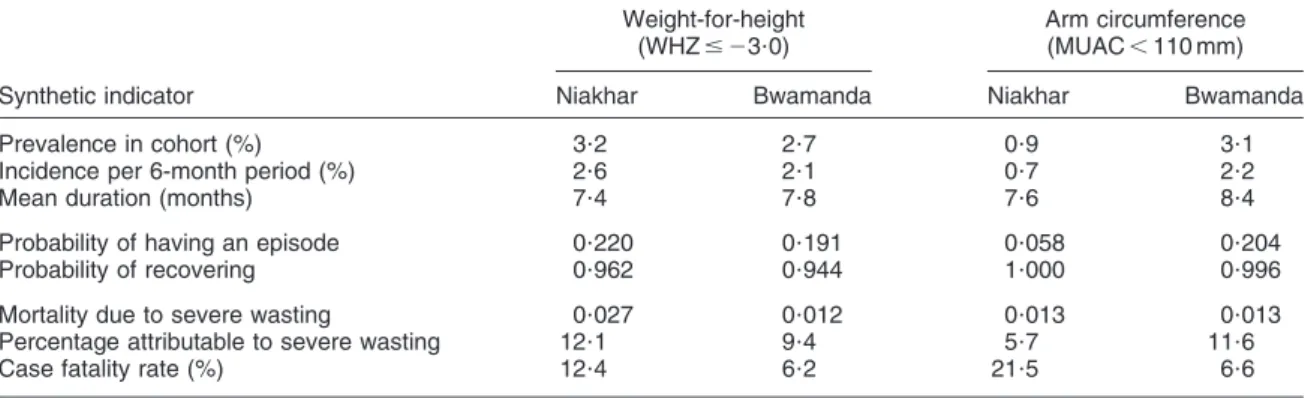
In Niakhar, 22 % of newborn children were likely to encounter an episode of severe wasting defined by WHZ and only 6 % when defined by MUAC. In Bwamanda, these proportions were 19 % for WHZ and 20 % for MUAC (Table 3). Virtually all surviving children had recovered from severe wasting by age 5 years.
Despite the differences in prevalence and in age profiles of incidence in the two studies, the episodes of severe wasting had a similar duration whatever the anthropometric indicator used: 7?4 and 7?8 months for WHZ, and 7?6 and 8?4 months for MUAC, Niakhar and Bwamanda respectively (Table 3). This duration explains the age pattern of pre-valence. Most new cases occur in the first two years of life, and episodes last on average less than a year, so that by the age of 3 years most of them have ended.
Mortality and case fatality
For all episodes combined, mortality in the severe wasting group represented 6 % (based on WHZ) to 12 % (based on MUAC) of the total mortality in Niakhar, and 9 % to 12 % respectively in Bwamanda (Table 3). These values are close to the attributable risks obtained by directly calculating the relative risk of death and the prevalence (respectively 13 % and 10 % in Niakhar, 11 % and 14 % in Bwamanda). This makes severe wasting one of the leading causes of death, of
0 1 2 3 4 5 6 7 8 0 6 12 18 24 30 36 42 48 54 60 Age (months)
Incidence per child-semester (%)
Fig. 3 Incidence of severe wasting (life table estimates) according to weight-for-height Z-score (WHZ) and mid upper-arm circumference (MUAC): Niakhar (Senegal; —m—, WHZ; – –m– –, MUAC) and Bwamanda (Democratic Republic of Congo; —J—,
WHZ; – –J– –, MUAC)
Table 3 Synthetic indicators from multi-state life tables among under-fives in Niakhar (Senegal) and Bwamanda (Democratic Republic of Congo)
Weight-for-height Arm circumference
(WHZ # 23?0) (MUAC , 110 mm)
Synthetic indicator Niakhar Bwamanda Niakhar Bwamanda
Prevalence in cohort (%) 3?2 2?7 0?9 3?1
Incidence per 6-month period (%) 2?6 2?1 0?7 2?2
Mean duration (months) 7?4 7?8 7?6 8?4
Probability of having an episode 0?220 0?191 0?058 0?204
Probability of recovering 0?962 0?944 1?000 0?996
Mortality due to severe wasting 0?027 0?012 0?013 0?013
Percentage attributable to severe wasting 12?1 9?4 5?7 11?6
Case fatality rate (%) 12?4 6?2 21?5 6?6
WHZ, weight-for-height Z-score; MUAC, mid upper-arm circumference.
the same order of magnitude as measles or malaria in Niakhar or as diarrhoeal diseases in Bwamanda. Of course, the attributable risk depended on the threshold chosen (WHZ # 23?0 or MUAC , 110 mm). Note that MUAC identified children with higher risks of death than WHZ in Niakhar, whereas mortality was the same for both indica-tors in Bwamanda, reflecting the differences in stunting, in body composition and in body shape.
Case fatality can also be derived from the life tables (Tables 2 and 3). Its value was dependent on the defini-tion chosen, and ranged from 12 % (WHZ) to 22 % (MUAC) in Niakhar, and from 6 % (WHZ) to 7 % (MUAC) in Bwamanda, making severe wasting one of the most lethal conditions in these populations. The high value of case fatality for MUAC in Niakhar is due in part to the relatively lower bound of the threshold compared with the mean in the population, selecting a smaller group of high-risk children, and in part to the higher mortality level.
Impact of standards
The impact of the standard can be evaluated by com-paring the results of multi-state life tables produced with the NCHS-1977 and the MGRS-2006 standards with those obtained with the CDC-2000 standard. Overall, the standard did not much influence the estimates of mean duration of episodes, which fluctuated around 7?5 months (Table 4). However, the standard had a large effect on prevalence in the population, and as a result on incidence in a cohort. These differences, which are due to different values of the 23?0 Z-score threshold, have been documented elsewhere(25). To give an example, the 23?0 threshold for a height of 80 cm for males is 8?840 kg in the CDC-2000 system, but only 8?290 kg in NCHS-1977 and 8?300 kg in MGRS-2006, which explains why prevalence is higher with CDC-2000.
Discussion
The present study revealed a common pattern of episodes of severe wasting, with similar duration in the two
areas investigated (7?5 months), despite differences in environment, in diet, in causes of death profiles and in prevalence of malnutrition. Here, we considered severe wasting as a disease, with the usual epidemiological char-acteristics, such as prevalence, incidence, duration and case fatality rate. The disease parameters were estimated from longitudinal studies, which, however, were not full-scale cohort studies from birth to age 5 years. Proper clinical investigations in cohorts could provide further evidence, in particular on the distribution of the duration of episodes, which may be quite wide. Some episodes appear to be of short duration for children who recover quickly or who are properly treated, whereas others last a long time and lead to severely retarded growth.
A 6-month reference period was used in the comparative study because the Niakhar data imposed this interval. Similar computations were conducted in Bwamanda with 3-month intervals and revealed somewhat shorter episodes of, on average, 4?5 months for WHZ and 5?3 months for MUAC, as well as a higher incidence. Finding more episodes of short duration with smaller intervals was expected, and this could be further pursued with even smaller intervals. The clinical significance of these shorter episodes could be further analysed. However, one could also consider that measurement errors around the threshold could lead to false positive cases of severe malnutrition, and a more rigorous case definition associated with formal growth monitoring might be necessary to sort out this issue. Furthermore, the attributable risk obtained using a 3-month interval was higher than the attributable risk calculated directly from relative risk of death and prevalence (20 % v. 14 % for MUAC, 15 % v. 11 % for WHZ), which suggests that this method tended to overestimate incidence.
The differences between the two sites deserve further investigation. Many factors could be evoked. Diet was different in the two sites, with millet and sorghum being the staple foods in Niakhar compared with maize and cassava in Bwamanda. Among infectious diseases of childhood, the pattern of malaria transmission differed between the two sites, with more intense and more seasonal transmission in Niakhar inducing very high
Table 4 Comparison of effect of norm system on life table estimates among under-fives in Niakhar (Senegal) and Bwamanda (Democratic Republic of Congo)
Standard Synthetic indicator Niakhar Bwamanda
MGRS-2006 Prevalence in cohort (%) 1?7 0?8
Incidence per 6-month period (%) 1?4 0?7
Mean duration (months) 7?5 6?7
NCHS-1977 Prevalence in cohort (%) 0?8 0?8
Incidence per 6-month period (%) 0?8 0?5
Mean duration (months) 6?6 8?8
CDC-2000 Prevalence in cohort (%) 3?2 2?7
Incidence per 6-month period (%) 2?6 2?1
Mean duration (months) 7?4 7?8
MGRS-2006, WHO Multicentre Growth Reference Study 2006 child growth standards; NCHS-1977, National Center for Health Statistics 1977 child growth references; CDC-2000, Centers for Disease Control and Prevention 2000 child growth charts.
mortality during the four months of the rainy season but not during the rest of the year. In Bwamanda, malaria transmission was more steady, leading to mortality all year round and to more cases of severe anaemia. Access to treatment probably also differed, with an advantage to people living near the well-staffed Bwamanda hospital, whereas Niakhar in the 1980s was poorly served. The time period was also different. In Niakhar the study was con-ducted before the mass vaccination campaigns of 1986–7, and by 1988 mortality rates from measles, whooping cough and tetanus had been reduced to very low numbers, and overall mortality was strongly reduced. It was also con-ducted before the oral rehydration therapy programme really took off, which could explain the high mortality from diarrhoea. A comparison done in 1989–91 in Niakhar would have led to different conclusions.
Genetic factors seemed also to play a role in the com-parison. Sahelians of West Africa are usually taller than Congolese Bantus, and in particular tend to have a low ‘sitting-height to standing-height ratio’ (Cormic index). Their body shape therefore tends to underestimate stunting (measured by HAZ) and to overestimate wasting measured by WHZ when compared with other indicators of the muscular mass. This has been documented already for populations in Eastern Africa(27). In our comparison, it was striking to note that the differences in estimates of severe wasting changed depending on the indicator selected. Arm circumference remains the closest indicator of the lean body mass, and has been found repeatedly to be the best predictor of child survival(12,28). How the genetic components of body shape and body composi-tion affect arm circumference and its interpretacomposi-tion remains to be explored.
These studies were conducted some 20 to 25 years ago and meanwhile HIV/AIDS has emerged, leading to an increase in the prevalence of severe wasting in many African countries. This new disease is likely to change some of the parameters used in the present study. The availability of highly active antiretroviral therapy for HIV-infected under-fives is also likely to have an impact on HIV-related severe wasting. These new facts should be taken into account for recent estimates of the causes of death and the burden of severe wasting.
Acknowledgements
The Niakhar study was supported by the European Union, DG-XII, Grant # TDR-36 (M.G., B.M., A.B. and O.F.). The Bwamanda study was supported by the Nutricia Research Foundation (J.V.d.B., R.E. and D.W.). All authors declare no conflict of interest of any type. The Niakhar study was initiated by M.G., B.M. and A.B.; the field work was conducted by M.B., B.M. and O.F. All four authors contributed to the data analysis and the writing of the paper. The Bwamanda study was initiated by J.V.d.B. and R.E., who also conducted the field work;
both contributed to the data analysis and the writing of the paper together with D.W. The authors thank all those who participated in the field work, in particular the technical assistants, the mothers and children, and the community leaders, who welcomed the study.
References
1. Fauveau V, Briend A, Chakraborty J & Sarder AM (1990) The contribution of severe malnutrition to child mortality in rural Bangladesh: implications for targeting nutritional interventions. Food Nutr Bull 12, 215–219.
2. Schofield C & Ashworth A (1996) Why have mortality rates for severe malnutrition remained so high? Bull World Health Organ 74, 223–229.
3. Briend A, Prudhon C, Prinzo ZW, Daelmans BM & Mason JB (2006) Putting the management of severe malnutrition back on the international health agenda. Food Nutr Bull 27, 3 Suppl., S3–S6.
4. Bhutta ZA, Ahmed T, Black RE et al.; Maternal and Child Undernutrition Study Group (2008) What works? Interven-tions for maternal and child undernutrition and survival. Lancet 371, 410–440.
5. Gomez F, Ramos-Galvan R, Frenk S, Cravioto-Munoz J, Chavez R & Vasquez J (1956) Mortality in second and third degree malnutrition. J Trop Pediatr 2, 77–83.
6. Garrow JS & Pike MC (1967) The short-term prognosis of severe primary infantile malnutrition. Br J Nutr 21, 155–165.
7. McLaren DS, Shirajian E & Loshkajian S (1969) Short term prognosis in protein–calorie malnutrition. Am J Clin Nutr 22, 863–870.
8. Sommer A & Loewenstein S (1975) Nutritional status and mortality: a prospective validation of the QUAC stick. Am J Clin Nutr 28, 287–292.
9. Kielmann AA & McCord C (1978) Weight-for-age as an index of risk of death in children. Lancet 1, 1247–1250. 10. Chen LC, Chowdhury AKMA & Huffman SL (1980)
Anthropometric assessment of energy–protein malnutrition and subsequent risk of mortality among preschool age children. Am J Clin Nutr 33, 1836–1845.
11. Briend A, Dykewiz C, Graven K, Mazumder RN, Wojtyniak B & Bennish M (1986) Usefulness of nutritional indices and classifications in predicting death of malnourished children. Br Med J 293, 373–375.
12. Briend A & Zimicki S (1986) Validation of arm circumfer-ence as an indicator of risk of death in one to four year old children. Nutr Res 6, 249–261.
13. Briend A, Wojtyniak B & Rowland MGM (1987) Arm circumference and other factors in children at high risk of death in rural Bangladesh. Lancet 2, 725–727.
14. Briend A, Garenne M, Maire B, Fontaine O & Dieng K (1989) Nutritional status, age and survival: the muscle mass hypothesis. Eur J Clin Nutr 43, 715–726.
15. Pelletier DL, Frongillo EA, Schroeder DG & Habicht JP (1995) The effects of malnutrition on child mortality in developing countries. Bull World Health Organ 73, 443–448.
16. Garenne M, Maire B, Fontaine O, Dieng K & Briend A (2000) Risques de de´ce`s associe´s a` diffe´rents e´tats nutri-tionnels chez l’enfant d’aˆge pre´scolaire. Etudes du CEPED no. 17. Paris: CEPED; available at http://www.ceped.org/ cdrom/ integral_publication_1988_2002/
17. Garenne M, Maire B, Fontaine O & Briend A (2006) Distributions of mortality risk attributable to low nutritional status in Niakhar, Senegal. J Nutr 136, 2893–2900. 18. Mukuria A, Cushing J & Sangha J (2005) Nutritional Status
Surveys 1994–2001. DHS Comparative Reports no. 10. Calverton, MD: ORC Macro.
19. Black RE, Allen LH, Bhutta ZA, Caulfield LE, de Onis M, Ezzati M, Mathers C & Rivera J; Maternal and Child Undernutrition Study Group (2008) Maternal and child undernutrition: global and regional exposures and health consequences. Lancet 371, 243–260.
20. Garenne M & Cantrelle P (1997) Three decades of research on population and health: the ORSTOM experience in rural Senegal: 1962–1991. In Prospective Community Studies in Developing Countries, pp. 233–252 [M Das Gupta and M Garenne, editors]. Oxford: Oxford University Press. 21. Garenne M & Fontaine O (1986) Assessing probable causes
of deaths using a standardized questionnaire. A study in rural Senegal. In Measurement and Analysis of Mortality. Proceedings of the IUSSP Seminar held in Sienna, Italy, 7–10 July 1986, pp. 123–142 [J Vallin, S D’Souza and A Palloni, editors]. Oxford: Clarendon Press. Reprinted (2006) in Bull World Health Organ 84, 248–253.
22. Van den Broeck J, Eeckels R & Vuylsteke J (1993) Influence of nutritional status on child mortality in rural Zaire. Lancet 341, 1491–1495.
23. Kuczmarski RJ, Ogden CL, Guo SS, Grummer-Strawn LM, Flegal KM, Mei Z, Wei R, Curtin LR, Roche AF & Johnson CL (2002) The 2000 CDC Growth Charts for the United States: methods and development. Vital Health Stat 11, issue 246, 1–190; available at http://www.cdc.gov/growthcharts 24. Hamill PW, Drizd TA, Johnson CL, Reed RB, Rocher AF &
Moore WM (1979) Physical growth: National Center for Health Statistics percentiles. Am J Clin Nutr 32, 607–629. 25. De Onis M, Garza C, Onyango AW & Borghi E (2007)
Comparison of the WHO child growth standards and the CDC-2000 growth charts. J Nutr 137, 144–148.
26. Manton KG & Stallard E (1984) Recent Trends in Mortality Analysis. New York: Academic Press.
27. Myatt M & Duffield A (2007) Weight-for-height and MUAC for estimating the prevalence of acute undernutrition? A review of survey data collected between September 1992 and October 2006. In Report to the IASC Global Nutrition Cluster. New York: UNICEF.
28. Brambilla P, Rolland-Cachera MF, Testolin C, Briend A, Salvatoni A, Testolin G & Chiumello G (2000) Lean mass of children in various nutritional states. Ann N Y Acad Sci 904, 433–436.