HAL Id: hal-02933766
https://hal.inria.fr/hal-02933766
Submitted on 8 Sep 2020
HAL is a multi-disciplinary open access archive for the deposit and dissemination of sci-entific research documents, whether they are pub-lished or not. The documents may come from teaching and research institutions in France or abroad, or from public or private research centers.
L’archive ouverte pluridisciplinaire HAL, est destinée au dépôt et à la diffusion de documents scientifiques de niveau recherche, publiés ou non, émanant des établissements d’enseignement et de recherche français ou étrangers, des laboratoires publics ou privés.
The dependence structure between yields and prices: A
copula-based model of French farm income
Meryem Bousebata, Geoffroy Enjolras, Stéphane Girard
To cite this version:
Meryem Bousebata, Geoffroy Enjolras, Stéphane Girard. The dependence structure between yields and prices: A copula-based model of French farm income. AAEA 2020 - Annual Meeting of the Agricultural and Applied Economics Association, Aug 2020, Virtuel, United States. pp.1-15, �10.22004/ag.econ.304313�. �hal-02933766�
The dependence structure between yields and prices:
A copula-based model of French farm income
Meryem Bousebata, Univ. Grenoble Alpes, Inria, CNRS, Grenoble INP, LJK, 38000 Grenoble, France Corresponding author: meryem.bousebata@inria.fr
Geoffroy Enjolras, Univ. Grenoble Alpes, CERAG, 38000 Grenoble, France,
geoffroy.enjolras@grenoble-iae.fr
Stéphane Girard, Univ. Grenoble Alpes, Inria, CNRS, Grenoble INP, LJK, 38000 Grenoble, France
stephane.girard@inria.fr
Selected Paper prepared for presentation at the 2020 Agricultural & Applied Economics Association Annual Meeting, Kansas City, MO
July 26-28, 2020
Copyright 2020 by Meryem Bousebata, Geoffroy Enjolras and Stéphane Girard. All rights reserved. Readers may make verbatim copies of this document for non-commercial purposes by any means, provided that this copyright notice appears on all such copies.
The dependence structure between yields and prices:
A copula-based model of French farm income
AbstractIn this paper, we aim to assess and model the dependence structure between crop yields and prices, by using a copula approach. The study is conducted on a database of French farms by considering cereal and wine productions for years 2014 to 2016. We find that the dependence between prices and yields is relatively high and can be described with the Frank copula. It is strongly influenced by high temperatures. Since wine prices are fixed on local markets and cereal prices follow global market trends, a potential market for an income insurance would be more suitable for cereal producers.
Keywords: Farm income, Dependence structure, Copulas, Crop insurance, France 1. Introduction
Agriculture is a sector where income is subject to a wide variety of risks arising from large-scale natural events (Goodwin & Hungerford, 2014) and the variability of agricultural commodity prices (Johnson, 1975). Thus, farm income confronts two main types of risks related to yield and price volatility. The risk of poor yields is mainly due to weather events such as drought, frost, insect infestation, diseases and agricultural techniques implemented by farmers (Coble & Knight, 2002). Price risk is rather linked to the deregulation of financial markets (Chavas, 2011) and explained by the fact that most European countries have shifted from market-based support to decoupled direct payments. Then, producers are exposed to high price volatilities on world commodity markets (El Benni et al., 2016).
Conforming to this framework, the European Union has defined, particularly during the reform of the Common Agricultural Policy (CAP) in 2013, some risk management tools including subsidized crop insurance, mutual funds and income stabilisation tools (IST) (Meuwissen et al., 2018; El Benni et al., 2016). However, agricultural insurance plays a limited role with regard to the hedging of price risk and most IST tools have not yet been implemented (European Commission, 2017). By contrast, income insurance is available to U.S. farmers under the Farm Bill program (Smith et al., 2014). Therefore, it is necessary to carry out evaluations of the European case because the underlying design of the IST proposed in Europe is different from that of the USA. For instance, the Farm Bill comprises several insurance systems which hedge yield and income losses. Premiums are affordable for farmers because they are highly subsidized.
In France, no such tool is available to farmers (El Benni et al., 2016). France has set up only a private crop insurance system, where premiums can be subsidized up to 65%, and a national public fund for the mutualisation of health and environmental risks (FMSE - Fonds de Mutualisation Sanitaire et Environnementale). Moreover, these two risk management tools have a limited effect, as French producers continue to receive European payments from the CAP of around €7 billion per year, disconnected from market and weather trends (Lidsky et al., 2017). Insurance coverage remains quite low despite the important subsidies for multi-peril crop insurance.
Ongoing reforms, currently being carried out by the Common Organisation of Agriculture and Agro-industry Markets, are encouraging professional bodies and governments to develop new agricultural insurance products taking into account both yield and price risks, which are key determinants of income. They aim at increasing the attractiveness of income insurance (IST) compared to other risk management tools implemented for different reasons. First, public subsidies for income insurance seem justified because the risk covered is probably systemic, i.e. many farmers are exposed to the risk at the same time, thus allowing for public transfers (Meuwissen et al., 2003). In addition, correlations between prices and yields are implicitly considered by a total farm income insurance (El Benni et al., 2016), which seems advantageous compared to separate yield or price risk management instruments.
Some studies have considered actuarial assessments of potential income insurance, the resulting costs for the government, potential beneficiaries and conceptual studies on adverse selection and moral hazard issues. However, these studies do not focus on the application of income insurance and the modelling of its underlying risks (yields and prices) (Meuwissen et al., 2003). It is therefore relevant to model the dependence of yields and prices.
Modelling this dependence is of great concern as it may have implications for the eventual implementation of income insurance that would address the risks of farm production. Indeed, it should provide an understanding of the distributions of yield and price risks, which interact simultaneously. Ignoring the dependence between these two risk factors could lead to an overestimation of risk for the insurer or an under-hedging of income for the producer. For example, in the case of a “natural” hedge where income is stabilized due to the negative relationship between crop yields and prices, ignoring this relationship may lead the insurer to overestimate income insurance risk. Conversely, the case of the positive relationship between yields and prices in a low-price market environment may result in insufficient coverage of the producer’s income.
In the statistics literature, there exist several models for dependence structure between price and yield risks. The problem of such approach is that the individual behaviour of each variable has to be represented by the same parametric family of univariate distributions. Thus, it became necessary to construct new multivariate distributions with fixed margins and fixed dependencies properties (Kazi-Tani & Rullière, 2019). In order to develop a multivariate model that preserves a given set of marginals, a copula approach can be used to characterize the joint distribution of different risks, thus offering considerable flexibility in empirical research. Copulas have recently become a part of the toolkit for applied economic research, resulting in an increasing need for the modelling of multivariate risk factors and their interaction. For instance, Emmanouilides & Fousekis (2014) studied the structure of price dependence along the beef supply chain in the USA and Fousekis & Grigoriadis (2017) analysed the strength and the pattern of price relationships for the different types of coffee. To the best of our knowledge, there has been only one published work on the use of copulas in modelling the interaction between prices and yields in the USA using simulated data only (Zhu et al., 2008).
The novelty of this research is to investigate and model the pattern of price and yield dependence on a real data set of French farm income extracted from the Farm Accountancy Data Network (FADN). Two types of crops are considered: cereals (wheat and maize) and wine growing. The objective of this research is pursued using the statistical tool of copulas. Various copula models are tested for their ability to model yield and price risks. We also model the dependence structure conditionally on other covariates such as crop insurance purchase, insurance claims, temperatures and sunshine, in order to measure the influence of these factors using conditional copulas. Then, an insight related to the potential to establish a farm income insurance that would address the risks of cereal and wine productions, is proposed.
The rest of the article is organised as follows: in section 2, we develop the methodological tools to perform the copula analysis. Once these tools are available, we present the data in section 3 and the empirical results in section 4. Section 5 concludes this study.
2. Theoretical framework
2.1 Copulas and dependence measures
The concept of copulas was introduced in 1959 by Abe Sklar (Sklar, 1959). During the financial crisis of 2007 and 2008, copulas have come to the attention of the general public due to their use in the modelling of multidimensional phenomena, mainly in the realm of quantitative risk management. They are a flexible tool that can be used to realistically represent risk dependence.
By definition, a copula is a multivariate distribution function with standard uniform univariate margins. Thus, it contains all the information on the dependence structure of the model. For the sake of simplicity, let us focus on the bivariate case, in which we consider a pair of continuous random variables 𝐶" and 𝑌 marginally distributed according to 𝐹(𝑥) = 𝑃(𝑋 ≤ 𝑥) and 𝐺(𝑦) = 𝑃(𝑌 ≤ 𝑦). Let 𝐻(𝑥, 𝑦) = 𝑃(𝑋 ≤ 𝑥, 𝑌 ≤ 𝑦) be their joint distribution function. According to Sklar’s theore, there exists a unique function 𝐶: [0,1]5 → [0,1] such that:
𝐻(𝑥, 𝑦) = 𝐶(𝐹(𝑥), 𝐺(𝑦)), 𝑓𝑜𝑟𝑎𝑙𝑙(𝑥, 𝑦) ∈ 𝑅5 (1)
The function 𝐶 is referred to as the copula associated with 𝐻. It is the 2-dimensional cumulative distribution function (cdf) of the random vector (𝐹(𝑋), 𝐺(𝑌)) with uniform margins on [0,1]. Several measures of association between the components of a random pair can be considered, Kendall’s Tau and Spearman’s Rho being the most popular ones. These measures are invariant to strictly increasing functions and can be interpreted as probabilities of concordance minus probabilities of discordance of two random pairs. Both of them can be written only in terms of the copula 𝐶 :
𝜏 = 4∫ ∫ 𝐶BA BA (𝑢, 𝑣)𝑑𝐶(𝑢, 𝑣) (2)
There is also another measure of association based on concordance called medial correlation coefficient, proposed by (Nelsen, 2007), paragraph 5.1.4, given by:
𝛽 = 4𝐶(A5,A5) − 1 (4)
This parameter consists in evaluating the probability that X and Y would jointly exceed the median value.
2.2 Inference and goodness of fit tests
In the context of our study, we use a parametric approach for estimating copulas (Nelsen, 2007). It is based on the estimation of the parameter(s) 𝜃 of the copula assumed to belong to some parametric family {𝐶M, 𝜃 ∈ 𝛩}. We focus on two popular models: Elliptical and Archimedean copulas. Elliptical copulas are built from elliptical distributions thanks to an uniformization of their margins. The level sets of an elliptical distribution density are ellipses whose shape is determined by a (kind of) covariance matrix. Important examples in this family are the Gaussian and the Student copulas. Archimedean copulas are determined by a univariate function, called the generator, whatever the dimension is. In this study, we focus on three Archimedean copulas: Gumbel, Frank, and Clayton. The estimation of the parameter(s) 𝜃 can be done for instance using the maximum likelihood method or the method of moments. In the latter case, 𝜃 is estimated by minimizing a given distance between the empirical estimator of 𝜏 and 𝜌 and the theoretical ones 𝜏(𝜃)and 𝜌(𝜃) calculated according to Equations (2) and (3) under the model 𝐶M (Mazo & Girard, 2014).
Two main techniques can be used to select the copula that fits best a dataset. First, one can rely on visual diagnostics. The idea is to use Rosenblatt’s transformation to transform, under the null hypothesis (𝑈, 𝑉) ∼ 𝐶B, the pairs (𝑈S, 𝑉S) towards independent observations. Then, the p-value of an independence test is computed and encoded as a colour, see Figure 2 for example. Second, one may use a goodness-of-fit test based on Kendall’s distribution function 𝐾 (also called multivariate probability integral transformation). The theoretical Kendall distribution computed under the null hypothesis (𝑈, 𝑉) ∼ 𝐶B is compared to its sample version thanks to a Cramér–von Mises statistics and the associated 𝑝-value is computed.
2.3 Covariates
In some cases, the dependence structure of the random pair (𝑋, 𝑌) may depend on an external (possible multivariate) random variable 𝑍. Conditional copulas were introduced to tackle this issue. Similar to Equation (1), one can write the joint and marginal distribution functions of (𝑋, 𝑌) conditionally on 𝑍 = 𝑧, as:
𝐻"(𝑥, 𝑦) = 𝑃(𝑋 ≤ 𝑥, 𝑌 ≤ 𝑦 ∨ 𝑍 = 𝑧) = 𝐶"(𝐹"(𝑥), 𝐺"(𝑦)) (5) where 𝐹"(𝑥) = 𝑃(𝑋 ≤ 𝑥 ∨ 𝑍 = 𝑧) and 𝐺"(𝑦) = 𝑃(𝑌 ≤ 𝑦 ∨ 𝑍 = 𝑧).
In this context, 𝐶" is referred to as a conditional copula. Starting from a set of observations (𝑋A, 𝑌A, 𝑍A), . . . , (𝑋Z, 𝑌Z, 𝑍Z), a non-parametric estimator of 𝐶"(𝑢, 𝑣) can be used (Gijbels et al., 2011). The conditional copula can be used to estimate conditional Spearman’s 𝜌 and Kendall’s 𝜏 providing then association measures depending on the covariate 𝑍.
3. Analytical framework
3.1 Database
In order to model farm income for different types of crops, this work is based on an empirical data extracted from the Farm Accountancy Data Network1 (FADN). It is an annual database of around
7,000 commercial-sized farm holdings. This exhaustive dataset contains significant accounting and financial information about French professional farms along with individual and structural data. A particular attention will be paid to the years 2014 and 2015 when French production reached a high record in a down market price context (Rodier et al., 2015). We also pay attention to 2016, which was a year characterised by a decline in harvests, due to spring storms and summer drought (Triquenot et al., 2016). Modelling the couple (price, yield) for a specific type of crops is the best way to learn more about farm income generation. We also model this couple conditionally to other covariates.
3.2 Choice of considered sectors
We selected three different types of crops: wheat, maize and quality wine-growing. Wheat is the prominent cereal produced in France. It is mostly located in the West of France and around the Parisian basin2. France is the first European producer and exporter of wheat and it is ranked fifth
largest country in the world in terms of national wheat production (Ben-Ari & Makowski, 2018). Maize is the second largest crop production in France, cultivated on more than 3 million hectares in 2016 thanks to favourable soil and climate conditions and the performance of producers.
Weather conditions in autumn 2014 and summer 2015 had very contrasting effects on cereals (Rodier et al., 2015). Winter crops such as wheat had high yields, unlike autumn crops such as maize which suffered from drought and summer heat waves. However, the French wheat record harvest occurred within an abundant global context. Thus, wheat price dropped at the same time on global markets. However, the drop of the euro against the dollar supported the prices of agricultural commodities exchanged in euros. For maize, despite the decrease in production, global stocks remained high (Rodier et al., 2015). In 2016, cereal production suffered greatly in France due to climatic conditions (bad weather in spring and drought in summer) which led to significant yield decline. Despite the poor harvests in France, cereal prices remained low, due to the abundance of world production (Triquenot et al., 2016).
1 http://agreste.agriculture.gouv.fr
Wine-growing comes in second place after cereals in terms of yields. France occupies the first place worldwide along with Italy and Spain, depending on years. French viticulture is a leading production mostly based on family farms. In spite of the slight decrease of wine consumption every year, prices increase regularly thanks to exports. The two great concepts related to French quality wines are the concept of “terroir” and the “controlled designation of origin” system (Appellation d’Origine Contrôlée - AOC). Appellation rules define which grape varieties and wine making practices are approved for classification in each of France’s geographically defined “appellations”. Thanks to mild temperatures in winter and spring 2014, wine production increased by 17% for AOC wine. At the same time, production stocks at the beginning of the 2014/2015 wine year were lower than in the previous year (-10%) for all wine categories. Along with a reduced dynamic of foreign trade prices of AOC wine felt sharply at the beginning of the year before stabilising, while they increased for other wines (Rodier et al., 2015). Year 2015 was characterized by a slight increase in harvest levels but stable and limited availability, especially for AOC wines (Rodier et al., 2015). Prices increased slightly compared to 2014. In 2016, several wine yards were severely affected by several weather accidents and the impact on harvests was very significant. However, in the first nine months, prices of AOC wine excluding champagne were dynamic (+7.5% year-on-year), and systematically above the 2015 prices (Triquenot et al., 2016).
4. Results
4.1 Joint modelling of yields and prices
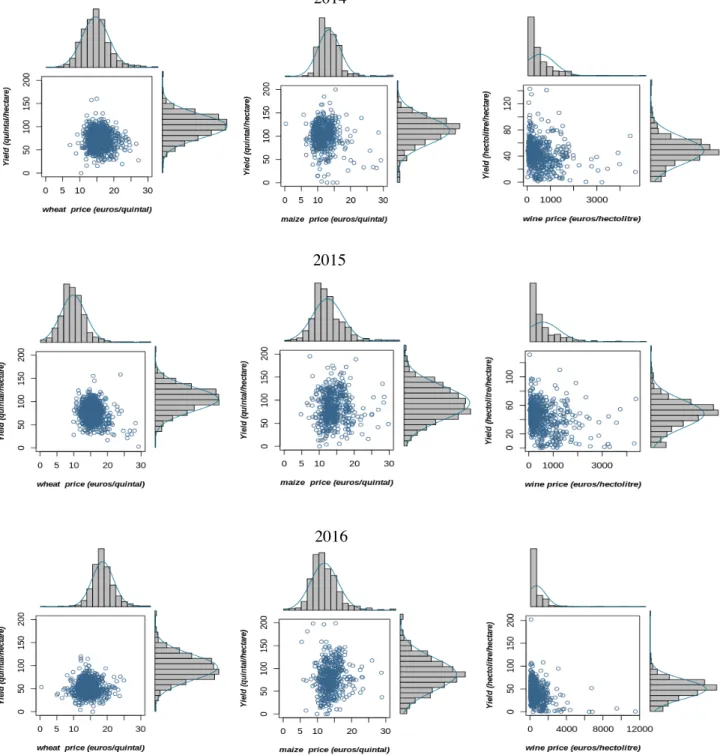
Scatter plot and histograms of yields per hectare and prices for respectively 2014, 2015 and 2016 are given in Figure 1. We notice that prices and yields per hectare for wheat and maize crops are symmetrically distributed, while for wine crops they are not. Scatter plot for wine shows a down ward trend in yields when prices rise, for the three years. For cereals, a non-linear relationship is identified, hence the need to use copula to model the dependency. Table 1 gives a summary of Spearman’s ρ coefficient, a rank-based measure of association between the couple (price, yield), and the p-value associated to the correlation tests.
For wheat, we notice a strong negative correlation between yields and prices in 2015 based on Spearman’s method, about −0.19. The test of association between paired samples gives a p-value 4×10⁻⁹ which means that the null hypothesis (which supposes that prices and yields are
independent) is rejected at the 5% level. The negative correlation means that yields per hectare and prices vary in opposite ways. This is consistent on efficient markets where prices and yields tend to move in opposite directions. This negative correlation is particularly obvious in 2014 and especially 2015, as abundant wheat harvests and higher yields (Rodier et al., 2015) led to commensurate market prices decreases. This effect is called the “natural hedge” (Sherrick, 2012). The correlation dropped in 2016 because of unfavourable meteorological conditions that penalised the harvesting of wheat in France (Triquenot et al., 2016). In contrast to the French situation, the world cereal harvest reached a record level, putting pressure on prices. Despite low yields in France, prices remained as low as before, hence the positive correlation.
The same reasoning applies for maize, with a positive correlation. For two consecutive years, 2015 and 2016, the lack of rain and summer heat hampered maize development. The production performance declined below the five-year average, and total maize exports and stocks declined due to lower production. However, prices did not rise, as global stocks were high during 2016.
Figure 1. Histograms and scatter plots of (price, yield) for considered productions
2015 2016 2014
For wine production, Spearman’s ρ shows that there exists a very strong dependence between yields and prices. In 2014 and 2015, the harvests were slightly higher with stable and limited stocks, while prices of AOC wine were lower (Rodier et al., 2015). This explains the very strong negative correlation conversely between yield and prices. For year 2016, following the succession of weather hazards, wine production was severely affected (Triquenot et al., 2016). Yet, production stocks increased in 2016 for AOC wines as a result of the good harvests in 2014 and 2015. These stocks largely offset the negative impact of a reduced production in 2016. Finally, it should be noted that the wine market is very particular compared to the cereals one. Wine prices seem to be very dependent on quality rather than on quantity, and also on the annual effects of stocks.
Table 1. Summary of independence tests of (price, yield)
Wheat Maize Wine
Year Spearman’s ρ P-value Spearman’s ρ P-value Spearman’s ρ P-value
2014 -0.0853 0.0086 0.0042 0.9220 -0.3051 0.0000
2015 -0.1893 0.0000 0.0747 0.0938 -0.2773 0.0000
2016 0.0631 0.0593 0.1473 0.0013 -0.3394 0.0000
Key: A Spearman’s ρ statistic is used to estimate the rank-based measure of association between yields and prices because data do not come from a bivariate normal distribution. The null hypothesis H0 of Spearman rank correlation test supposes
that prices and yields are independent and it is kept at the 5% level.
4.2 Price and yield modelling copulas
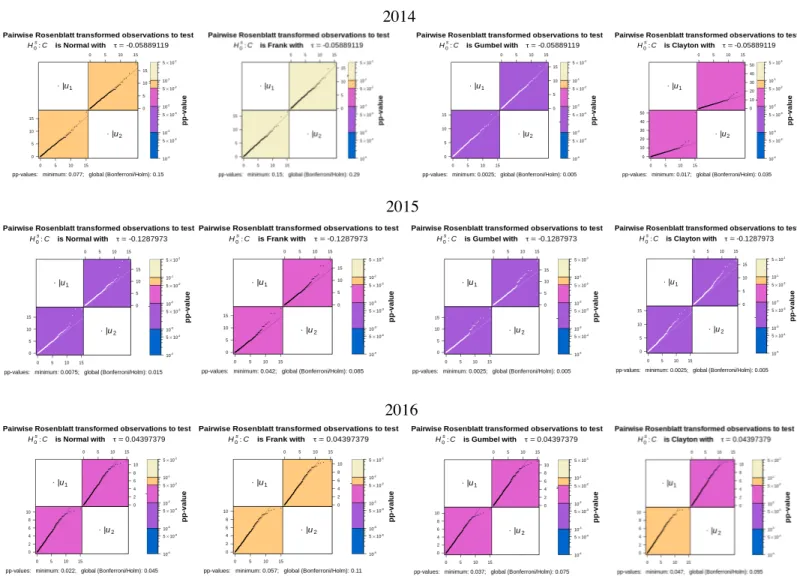
Several goodness-of-fit (GOF) tests are performed where candidate families considered are the Gumbel-Hougaard, Clayton, Frank, Normal and Student. Here both formal and informal ways to tackle the issue of the right choice of the modelling copula will be discussed in turn. For the informal way, we use graphical diagnostics. We focus on the method based on Rosenblatt’s transformation (Hofert & Mächler, 2014). We use our observations to compute the pairwise Rosenblatt transformed data under different hypothesis, meaning different copulas. Afterwards, we apply the pairwise test of independence to compute a matrix of p-values, converted to colours as shown on Figure 2.
We conclude that Frank copula fits the best wheat for the three different years and this can be confirmed by checking tail dependence coefficients where we find that both estimated lower and upper tail dependence coefficients are null. Figure 2 shows that apparently Normal, Gumbel and Frank copulas match well the observations of maize. For wine, the pairwise Rosenblatt transformed data under different hypotheses show that Frank copula does not fit well the model. However, in terms of empirical quantiles, it fits almost with the theoretical ones.
Figure 2. QQ-plot Pairwise Rosenblatt transformed observations of wheat
Key: Colours are orange to white colours for p-values ≥ 5% which is the chosen significant level, and blue to red for p-values ≤ 5%.
4.3 Influence of covariates
4.3.1. Crop insurance purchase and claims
Crop insurance and claims are classified into two binary classes: farmers who purchased or not a crop insurance and farmers who received or not claims. First of all, we use a multivariate analysis of variance (MANOVA)3 to determine whether these different classes, also their combinations,
influence the relationship between prices and yields. In this analysis, the null hypothesis assumes that the class does not affect the couple. The p-value allows to choose classes having a strong effect on the joint distribution. Therefore, we consider a classification according to classes having an impact for each crop and for each year of the study. For all five families tested, Frank copula fits well the observations. Now, to tell whether the classification made according to crop insurance
3 Multivariate Analysis of Variance is a statistical test that stands for multivariate analysis of variance for multiple dependent variables. 2014
2015
purchase and claims, is efficient or not, we estimate the parameter of Frank copula θ and the medial correlation coefficient β for each case and notice whether it differs significantly.
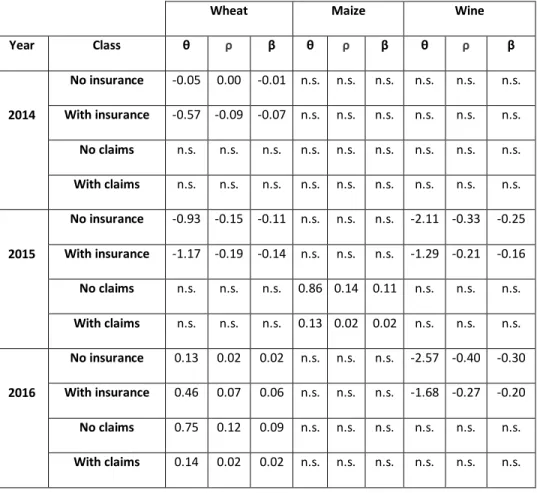
Table 2. Dependence measures of the selected (Frank) copula for each classification according to crop insurance purchase and claim classes
Wheat Maize Wine
Year Class θ ρ β θ ρ β θ ρ β 2014 No insurance -0.05 0.00 -0.01 n.s. n.s. n.s. n.s. n.s. n.s. With insurance -0.57 -0.09 -0.07 n.s. n.s. n.s. n.s. n.s. n.s. No claims n.s. n.s. n.s. n.s. n.s. n.s. n.s. n.s. n.s. With claims n.s. n.s. n.s. n.s. n.s. n.s. n.s. n.s. n.s. 2015 No insurance -0.93 -0.15 -0.11 n.s. n.s. n.s. -2.11 -0.33 -0.25 With insurance -1.17 -0.19 -0.14 n.s. n.s. n.s. -1.29 -0.21 -0.16 No claims n.s. n.s. n.s. 0.86 0.14 0.11 n.s. n.s. n.s. With claims n.s. n.s. n.s. 0.13 0.02 0.02 n.s. n.s. n.s. 2016 No insurance 0.13 0.02 0.02 n.s. n.s. n.s. -2.57 -0.40 -0.30 With insurance 0.46 0.07 0.06 n.s. n.s. n.s. -1.68 -0.27 -0.20 No claims 0.75 0.12 0.09 n.s. n.s. n.s. n.s. n.s. n.s. With claims 0.14 0.02 0.02 n.s. n.s. n.s. n.s. n.s. n.s.
Key: values are displayed when significant at a 5% level. n.s. denotes non-significant variables.
Table 2 shows how parameters θ and β change according to MANOVA-relevant classes. We notice that the insured farms are those that have a strong negative dependence β between prices and yields, for wheat in 2014/2015 and very strong for wine in particular in 2015/2016. This is due to a perfect match between supply and demand. Indeed, on a perfect market, prices are expected to move downwards when yields are better and vice versa, which means the balance between supply and demand determines the price. This was the case for wheat, as production was at a world record, resulting in lower market prices (as explained earlier). Because wine is a very particular asset, out of global markets, it behaves in a different way, linked to an elastic market impacted by quality and stocks. The correlation becomes positive in 2016 for wheat, while there is no insurance effect for maize.
In conclusion, we note that insured wheat producers are those with the most volatile couple (price, yield), and conversely for wine. This can result in a slight anti-selection effect, because the farmer observes his yields (over the last 3 years for example) and can anticipate a future potential use of crop insurance. We also note that existing crop insurance contracts (which hedge only yield risks) are more adapted to wine than to field crops, as wine prices are determined on productive regions and follow closely yield trend. Conversely, setting up income insurance is more conceptually adapted to cereals rather than wine.
4.3.2. Temperature, precipitation and sunshine deviations
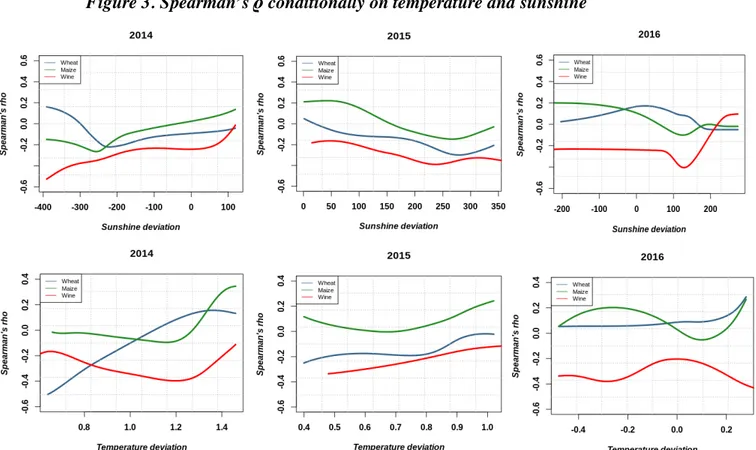
Figure 3 plots the estimated parameter of the copula according to temperature and sunshine deviations for wheat, maize and wine. We extract a relationship between these covariates and the structure of yield and price dependence using Spearman’s ρ. To do so, we use the approach based on the conditional copula estimation described previously. For wheat, Figure 3 displays respectively an increasing function of Spearman’s ρ depending on temperature deviation of 2014 the average of the last five years, a slight upward trend in 2015 but still a negative correlation, and stabilization around a very low dependency in 2016. This means that when the gap increases, wheat yields and prices tend to vary in the same direction.
Figure 3. Spearman’s ρ conditionally on temperature and sunshine
Figure 3 represents a downward trend for large number of days of sunshine as in 2015, and an upward trend for little sunshine in 2016 (the difference between this year’s average and the average of the last 5 years is lower than 0). The reason behind this trend is that wheat crops are very sensitive to climate change. In fact, price volatility and the decrease in agricultural yields are linked to natural risks due to record temperatures (2016 was an extremely hot year). Existing studies indicated that yields decline with higher temperatures and decreased precipitation (as in 2016) and increase with higher precipitation (as in 2015) (Pirttioja et al., 2015).
For wine, Figure 3 give different trends for temperature: a decreasing one for 2014, an increasing one in 2015 and in 2016 with some fluctuations. It is clear that the correlation seems to be negatively very strong when the temperature deviation increases until 1.2 C°. Spearman’s ρ for sunshine deviation tends to decrease for long periods of sunshine. Vines requires good sunshine, average high temperatures and regular rainfall for their growth. Solar radiation is an important element of photosynthesis that allows the vine to accumulate reserves (sugars) in its fruits. However, the vine is sensitive to very high temperatures accompanied by long periods of drought because it causes a slowdown or even a halt in the growth of leaves and grapes. Also, in the context of climate change, extreme temperatures reduce the chance to produce a quality wine (White et al., 2006).
5. Conclusion
This paper aimed at modelling the dependence structure between yield and price using a copula model approach. The study used a real data set of French farms extracted from the Farm Accountancy Data Network (FADN) considering two main productions: cereals (wheat and maize) and wine growing.
The results show that the dependence between prices and yields is relatively high and it is described with a Frank Copula, regardless the type of crop. Moreover, the two variables show different types of dependence for each crop, according to events related to the year of the study, whether linked to local climatic change affecting local production and yields, or to global fluctuations of the commodity markets as a result of global production and other external factors. We showed that the dependence structure between prices and yields is unstable for wheat and maize, while wine has always a negative correlation. This reflects the organisation of the wine growing sector, which is structured in terms of territory and quality. This is not the case for wheat and maize, which are completely standard cereals whose prices follow world market trends. On perfect markets, prices and yields use to vary in opposite directions.
This study also examined the effectiveness of existing insurance contracts. The empirical analysis showed that existing crop policies are more suited to wine than to cereals because they hedge directly yield only and not price risks. Indeed, ignoring the dependence between price risk and yield risk could lead to an overestimation of the cereal income risk, in the case of “natural hedge” where income is stabilized due to the negative relationship between crop yields and prices. Conversely, in the case of a positive relationship between yields and prices (for instance, in a low-price market environment), this may lead to an under-hedging of income for the producer. This study also shows that French cereal and wine productions are significantly influenced by extreme weather. Crop yields were sensitive to very high temperatures in 2016.
For future studies, this work offers many insights, such as an overview related to the development and pricing of farm income insurance that would be more suitable for the protection of cereal incomes. The results of this analysis support the idea of combining price and yield risk hedging into a single insurance policy that would provide increased insurance coverage, especially for cereal producers.
References
Ben-Ari, T., Boé, J., Ciais, P., Lecerf, R., Van der Velde, M., & Makowski, D. (2018). Causes and implications of the
unforeseen 2016 extreme yield loss in the breadbasket of France. Nature communications, 9(1), 1-10.
Chavas, J. P. (2011). Agricultural policy in an uncertain world. European Review of Agricultural Economics, 38(3),
383-407.
Coble, K. H., & Knight, T. O. (2002). Crop insurance as a tool for price and yield risk management. In A
Comprehensive Assessment of the Role of Risk in US Agriculture (pp. 445-468). Springer, Boston, MA.
El Benni, N., Finger, R., & Meuwissen, M. P. (2016). Potential effects of the income stabilisation tool (IST) in Swiss
agriculture. European Review of Agricultural Economics, 43(3), 475-502.
Emmanouilides, C. J., & Fousekis, P. (2015). Vertical price dependence structures: copula-based evidence from the
beef supply chain in the USA. European Review of Agricultural Economics, 42(1), 77-97.
European Commission (2017). Risk management schemes in EU agriculture; dealing with risk and volatility, available at: https://ec.europa.eu/agriculture/sites/agriculture/files/markets-andprices/market-briefs/pdf/12_en.pdf
Fousekis, P., & Grigoriadis, V. (2017). Joint price dynamics of quality differentiated commodities: copula evidence
from coffee varieties. European Review of Agricultural Economics, 44(2), 337-358.
Gijbels, I., Veraverbeke, N., & Omelka, M. (2011). Conditional copulas, association measures and their
applications. Computational Statistics & Data Analysis, 55(5), 1919-1932.
Goodwin, B. K., & Hungerford, A. (2015). Copula-based models of systemic risk in US agriculture: implications for
crop insurance and reinsurance contracts. American Journal of Agricultural Economics, 97(3), 879-896.
Hofert, M., & Mächler, M. (2014). A graphical goodness-of-fit test for dependence models in higher
dimensions. Journal of Computational and Graphical Statistics, 23(3), 700-716.
Johnson, D. G. (1975). World agriculture, commodity policy, and price variability. American Journal of Agricultural
Economics, 57(5), 823-828.
Kazi-Tani, N., & Rullière, D. (2019). On a construction of multivariate distributions given some multidimensional
marginals. Advances in Applied Probability, 51(2), 487-513.
Lidsky, V., Maudet, C., Malpel, G-P., Gerster, F., Helfter, M., Lejeune, H., & Le Theule, F-G.. April, 2017. Les outils
de gestion des risques en agriculture. Inspection générale des finances.
Mazo, G., Girard, S., & Forbes, F. (2014, April). Weighted least-squares inference based on dependence coefficients
for multivariate copulas. In Compstat, 21st symposium of the IASC, Genève, Switzerland.
Meuwissen, M. P., Huirne, R. B., & Skees, J. R. (2003). Income insurance in European agriculture. EuroChoices, 2(1),
12-17.
Meuwissen, M. P., de Mey, Y., & van Asseldonk, M. (2018). Prospects for agricultural insurance in Europe.
Agricultural Finance Review, 78(2), 174-182.
Naifar, N. (2011). Modelling dependence structure with Archimedean copulas and applications to the iTraxx CDS
index. Journal of Computational and Applied Mathematics, 235(8), 2459-2466.
Pirttioja, N., Carter, T. R., Fronzek, S., Bindi, M., Hoffmann, H., Palosuo, T., & Asseng, S. (2015). Temperature and precipitation effects on wheat yield across a European transect: a crop model ensemble analysis using impact response
surfaces. Climate Research, 65, 87-105.
Rodier, D., Satger, O., Thomas, G., Arnoux, P., Bernadette, L., Delort, A., & Pendaries, C. (2015). Bilan conjoncturel
2015 : En 2015, des marchés agricoles sous la pression des excédents mondiaux et communautaires.
Sherrick, B. (2012). Relative Importance of Price vs. Yield variability in Crop Revenue Risk. farmdoc daily, 2.
Sklar, A. (1959) Fonctions de Répartition à n Dimensions et Leurs Marges. Publications de l'Institut Statistique de
l'Université de Paris, 8, 229-231.
Smith, V. H., Johnson, J. B., & Hewlett, J. P. (2014). New Farm Programs in the 2014 Farm Bill, available at:
https://scholarworks.montana.edu/xmlui/bitstream/handle/1/15386/AMPC_PP44.pdf
Triquenot, A., Le Turdu, M., Champagnol, T., Bernadet, S., Bernadette, L., Delort, A., & Pendaries, C. (2016). Bilan
conjoncturel 2016, available at: http://agreste.agriculture.gouv.fr/IMG/pdf/conjbilan2016.pdf
White, M. A., Diffenbaugh, N. S., Jones, G. V., Pal, J. S., & Giorgi, F. (2006). Extreme heat reduces and shifts United States premium wine production in the 21st century. Proceedings of the National Academy of Sciences, 103(30),
11217-11222.
Zhu, Y., Ghosh, S. K., & Goodwin, B. K. (2008). Modeling dependence in the design of whole farm---a copula-based