HAL Id: inserm-00849053
https://www.hal.inserm.fr/inserm-00849053
Submitted on 30 Jul 2013
HAL is a multi-disciplinary open access
archive for the deposit and dissemination of
sci-entific research documents, whether they are
pub-lished or not. The documents may come from
teaching and research institutions in France or
abroad, or from public or private research centers.
L’archive ouverte pluridisciplinaire HAL, est
destinée au dépôt et à la diffusion de documents
scientifiques de niveau recherche, publiés ou non,
émanant des établissements d’enseignement et de
recherche français ou étrangers, des laboratoires
publics ou privés.
Adaptive Multi-modal Particle Filtering for
Probabilistic White Matter Tractography
Aymeric Stamm, Olivier Commowick, Christian Barillot, Patrick Pérez
To cite this version:
Aymeric Stamm, Olivier Commowick, Christian Barillot, Patrick Pérez. Adaptive Multi-modal
Parti-cle Filtering for Probabilistic White Matter Tractography. Information Processing in Medical Imaging,
Jul 2013, Monterey, United States. pp.594-606, �10.1007/978-3-642-38868-2_50�. �inserm-00849053�
Probabilistic Tractography
Aymeric Stamm1, Olivier Commowick1, Patrick P´erez2, and Christian Barillot1
1 VISAGES: INSERM U746 - CNRS UMR6074 - INRIA - Univ. of Rennes I, France 2 Technicolor, Rennes, France
Contact: [email protected]
Abstract. Particle filtering has recently been introduced to perform probabilistic tractography in conjunction with DTI and Q-Ball models to estimate the diffusion information. Particle filters are particularly well adapted to the tractography problem as they offer a way to approximate a probability distribution over all paths originated from a specified voxel, given the diffusion information. In practice however, they often fail at consistently capturing the multi-modality of the target distribution. For brain white matter tractography, this means that multiple fiber pathways are unlikely to be tracked over extended volumes.
We propose to remedy this issue by formulating the filtering distribution as an adaptive M-component non-parametric mixture model. Such a for-mulation preserves all the properties of a classical particle filter while improving multi-modality capture. We apply this multi-modal particle filter to both DTI and Q-Ball models and propose to estimate dynam-ically the number of modes of the filtering distribution. We show on synthetic and real data how this algorithm outperforms the previous versions proposed in the literature.
1
Introduction
The advent of MRI technology has provided the medical community with a large amount of data that help clinicians in making decisions on a daily basis. Diffusion MRI is the sequence of choice for the study and analysis of the brain white mat-ter (WM) neural network [16]. Yet, the tractography problem of inferring the WM neural system from noisy diffusion-weighted images is very challenging. It requires (i) an appropriate diffusion model that retrieves the diffusion informa-tion (e.g., diffusion orientainforma-tions, diffusivities, anisotropies) and (ii) a tracking algorithmthat generates pathways from the diffusion information.
Many diffusion models have been devised in the literature [3]. The very first proposed diffusion model in the literature is diffusion tensor imaging (DTI) [7], which can be viewed as the solution of the modified Bloch-Torrey equation for anisotropic media [24]. Despite its good performance in homogeneous regions of the brain, its robustness to noise and its low computational cost, DTI has shortcomings: since it summarizes the diffusion in a second-order tensor, it char-acterizes well uni-oriented anisotropic media but fails to describe multi-oriented
ones, which occurs in approximately a third of the voxels in the brain [9]. Solu-tions to the intra-voxel fiber heterogeneity problem rely on higher-order tensors [19], mixture models [26, 8, 2, 23] or non-parametric models such as the Q-Ball model [25]. The latter is especially appealing since its estimation is linear (and thus fast) and directly provides the orientation information.
The second ingredient for tractography is the tracking algorithm itself [15]. The tractography problem that we tackle here is the generation of possible fiber pathways from one seed voxel without constraining the other extremity of the paths. Existing algorithms that address this problem can be classified as de-terministic or probabilistic. The first category generates a single fiber pathway either by following the estimated local orientations [6, 18] or by fast marching front propagation [20, 22]. Local deterministic algorithms suffer from a possible accumulation of errors during the tracking process. Fast marching methods par-tially address this issue by reconstructing the fiber pathway that minimizes these errors. On the other hand, probabilistic algorithms generate several weighted fiber pathways that quantify the relative connectivity of the arrival point to the seed voxel (e.g. [9, 12]). Randomness is often introduced on the estimated local diffusion orientations to account for their uncertainty. The von Mises & Fisher distribution on the sphere [14] is particularly well adapted to perform this sampling and has been used within a particle filter in which fiber pathways are reconstructed as first order Markov chains [28, 21].
The use of particle filters for WM tractography has been pioneered in [28], where the diffusion information is estimated through DTI. The particle filter is improved in [21] by using the Q-Ball model to account for multiple local fiber orientations. However, particle filters often fail at consistently capturing the multi-modality of the filtering distribution [27]. Multiple fiber pathways are thus unlikely to be tracked over extended volumes. We propose an adaptive multi-modal particle filter for WM tractography that improves the multi-multi-modality capture. We apply it to both DTI and Q-Ball models (Section 2). We then de-sign an experimental framework for validation of the proposed methods (Section 3) and show results on both synthetic data with an extensive comparison to their classic particle filter counterparts and real clinical data (Section 4). An-other contribution is that the number of modes of the filtering distribution is dynamically estimated. We show that our proposed algorithm greatly improves WM tractography and, when the associated diffusion model accurately captures multiple fiber orientations, it is able to distinguish crossings from bifurcations.
2
Proposed algorithm
2.1 Tractography as a mixture filtering problem
Denote ⌦ ✓ R3 the image spatial domain. An image over this domain is a set
A ={ax, x2 ⌦}. Let then {Si}ni=1be a set of n raw gradient images, S0be one
non-weighted diffusion image and one diffusion model image. At step k, a fiber pathway is a sequence Xk = [(x
0, v−1), . . . , (xk, vk−1)]2
!⌦, S2"k+1
xk+1 = xk + ⇢vk, where ⇢ > 0 is the step size, which is assumed to be
con-stant. The state space at step k is the set of all possible fiber pathways Xk
originated from a specified position x0 and a specified arrival direction v−1.
The filtering distribution at step k is the distribution of Xk, given the
diffu-sion dataYk(Xk) ={yx0, yx1, . . . , yxk} where yxj ={sxj,i, xj,i}
n
i=1, for all j =
0, . . . , k. At each step k, this distribution is sequentially determined by succes-sively computing the prediction distribution p(Xk|Y
k−1(Xk−1)) out of the
pre-vious filtering distribution and then using Bayes’ rule to obtain p(Xk|Y k(Xk)).
These prediction and update stages require to specify respectively the evolu-tion model p(xk+1, vk|Xk) and the likelihood p(Yk+1(Xk+1)|Xk+1).
We assume that fiber pathways are first order Markov chains. Consequently, the evolution model simplifies to p(vk|xk, vk−1). In the remainder of the article,
according to [28, 21], we use the following evolution model: p(vk|xk, vk−1) = vMF(vk; vk−1, ) =
4⇡ sinh exp{v
T
k−1vk} , (1)
where vMF(·; vk−1, ) is the von Mises & Fisher distribution [14] on the
2-dimensional sphere with mean direction vk−1 2 S2 and concentration
parame-ter ≥ 0. The concentration parameter of the evolution model controls the smoothness of the reconstructed fiber pathways. Assuming conditional indepen-dence of the observations given a pathway, the observation model reads:
p(Yk+1(Xk+1)|Xk+1) = k
Y
j=0
p(yxj+1|vj) , (2)
where p(yxj+1|vj) depends on the diffusion model and will be defined in Section 2.4. In order to better capture multi-modality, we follow the idea of [27] and formulate the filtering distribution as a mixture of Mk components:
p(Xk |Yk(Xk)) = Mk X m=1 ⇡m,kpm(Xk|Yk(Xk)) , (3) where PMk
m=1⇡m,k = 1. Such a formulation allows us to perform the filtering
recursion for each component pmindividually, provided that each mixture weight
is updated as the normalized weighted likelihood for the associated component. 2.2 Mixture particle filter
In general, there is no closed-form expressions for the filtering recursion equa-tions. A popular strategy is to resort to particle filters. They approximate the filtering distribution by a set of samples that are properly weighted to rep-resent the filtering distribution at each step. Using the notations in [27], let Pk = {Mk, ⇧k,Xk,Wk,Ck} be the particle representation of the filtering
dis-tribution where Mk is the number of components, ⇧k ={⇡m,k}Mm=1k the set of
mixture weights, Xk = {x (`)
k }N`=1 the set of N particles, Wk = {w (`)
set of particle weights andCk ={c (`)
k }N`=1 the set of component indicators (i.e.,
c(`)k = m if particle ` belongs to component m). GivenPk, the particle
approxi-mation with mixture filtering distribution proceeds to step k + 1 in five stages: Proposition of new samples: New samples are generated according to a proposal density q(·|v(`)k−1, y
x(`)k
) which depends on the previous direction and the diffusion information at step k:
v(`)k ⇠ q(vk|v(`)k−1, y x(`)k ) and x (`) k+1= x (`) k + ⇢v (`) k . (4)
Update of particle weights: The weights of the new particles are updated in order to be representative of the filtering distribution according to [11]:
˜ w(`)k+1= w(`)k p(y x(`)k+1|v (`) k )p(v (`) k |v (`) k−1) q(v(`)k |v(`)k−1, y x(`)k ) . (5)
The normalization of these weights is performed within each component: w(`)k+1= w˜ (`) k+1 P j∈Im,kw˜ (j) k+1 , (6)
where Im,k ={` 2 J1, NK : c(`)k = m} is the set of indices of the particles that
belong to the m-th mixture component at step k.
Update of mixture weights: The mixture weights need to be updated properly to ensure that the filter still acts on each component individually:
⇡m,k+1=
⇡m,kw˜m,k+1
PM
i=1⇡i,kw˜i,k+1
with ˜wm,k+1=
X
`∈Im,k ˜
w(`)k+1. (7)
Resampling within each component: To avoid the degeneracy of the particle weights, occasional resampling is necessary [11]. The resampling stage can be performed within each subset of particles associated to a mixture compo-nent independently, according to the compocompo-nent particle weights [27]: we com-pute the effective number of particles in a mixture component as:
ESSm= 0 @ X `∈Im,k ⇣ wk+1(`) ⌘2 1 A −1 , (8)
and perform resampling according to the weights in Eq.(6), if ESSm is below a
threshold ↵|Im,k|, where | · | denotes the set size operator.
Reclustering of the particles within new components: The number of components Mk in the mixture is not known. At the end of each step, it is
dy-namically estimated by merging and/or splitting some of the components: Mk,
Ck andIm,kare updated to Mk+1,Ck+1 andIm,k+1 accordingly.
In Section 2.3, we describe how the reclustering of the mixture filtering dis-tribution is performed. In Section 2.4, we define the proposal density and the likelihood for the DTI and Q-Ball models following respectively [28] and [21].
2.3 Reclustering of the filtering distribution
After the resampling stage, we characterize each mixture component by a vMF distribution with mean direction µm,kand concentration m,k. The parameters
of the distribution are estimated using the following equations: rm,k:= P `∈Im,kv (`) k |Im,k| , µm,k= rm,k krm,kk , m,k= krm,kk(3 − krm,kk 2) 1− krm,kk2 . (9) These estimators have been proposed in [4] and have been introduced for diffu-sion MRI in [10] for their unbiasedness and robustness.
We first test the components pairwise for merging. We merge two components if the two following conditions are met:
1. the Euclidean distance between the mean positions xm,k := P
`∈Im,kx (`) k
|Im,k| is below a threshold ⇠1, and
2. the distance between the two vMF distributions computed with Eq.(9) is below a threshold ⇠2.
We compute the distance between two vMF distributions as proposed in [17]: d!(i, µi), (j, µj)" = s log2✓ j i ◆ + arccos2! µTiµj" . (10) We then test each component for splitting. We split a component if its con-centration parameter m,k drops below a threshold ⇠3.
Finally, the number of mixture components is updated to Mk+1, the
compo-nent indicators to Ck+1 and the set of indices to Im,k+1. In order to maintain
a properly weighted sample from the filtering distribution and thus to preserve the convergence properties of the particle filter, we perform the following update of mixture and particle weights [27]:
⇡? m,k+1= X `∈Im,k+1 ⇡c(`) k ,k+1 w(`)k+1, w(`)k+1? =⇡c (`) k ,k+1w (`) k+1 ⇡? c(`)k+1,k+1 . (11)
2.4 Diffusion models: associated proposal densities and likelihoods The DTI model. It provides a 2ndorder diffusion tensor represented by its eigensystem{λ1, λ2, λ3, e1, e2, e3}, of which we extract the fractional anisotropy
FA [5], the linear coefficient cl defined as in [28], the mean diffusivity λ =
(λ1+ λ2+ λ3)/3, the perpendicular diffusivity λ⊥ = (λ2+ λ3)/2, the
princi-pal eigenvector e1and the minor eigenvector e3. The likelihood is given by:
p(yxk+1|vk) = 8 > > > > < > > > > : " n Y i=1 s? xk+1,i σip2π exp ( −(s ? xk+1,i) 2(log s xk+1,i− log s ? xk+1,i) 2 2σ2 i )#n1 , cl> τ , 1 σp(2π)3exp ⇢ −(arccos(v T ke3)− π/2)2 2σ2 9 , cl τ , (12)
where the diffusion tensor is estimated at position xk+1, σiand giare the
stan-dard deviation and the gradient direction of the i-th gradient image respectively, estimated by least square estimation and pseudo-residuals [13], σ is a user-defined standard deviation and s?
xk+1,i = s
?
xk+1,0exp{−b(λ⊥+ 3(v
T
kgi)2(λ− λ⊥))} is
the diffusion signal simulated from the diffusion tensor cylindrically constrained along the sampled direction vk. The proposal density is given by:
q(vk|vk−1, yxk) = (
vMF(vk; e1,k, νk) , cl> τ ,
p(vk|vk−1) , cl τ ,
(13) where the diffusion tensor is estimated at xk and νk is a function of FA [28].
The Q-Ball model. It provides an orientation distribution function (ODF) of which we extract the set Λ of maxima µ, the value of the ODF at its maxima ψ(µ) and the mean curvature of the ODF at its maxima H(µ). Borrowing ideas from [21], we define the likelihood as follows:
p(yxk+1|vk) = " n Y i=1 1 σi p 2πexp ( −(sxk+1,i− s ? xk+1,i) 2 2σ2 i )#1n , (14)
where the ODF is estimated at position xk+1 and s?xk+1,i is the diffusion signal
simulated according to [1] from the ODF that has been rotated to align the sampling direction to the sampled one. The proposal density is given by:
q(vk|vk−1, yxk) = 8 > < > : X µ∈⇤ ωµvMF(vk; µ, κµ) , Λ6= ; , p(vk|vk−1) , Λ =; , (15)
where the ODF is estimated at xk, ωµ/ ψ(µ) (normalized) and κµ / H(µ).
3
Experimental setup & evaluation metrics
3.1 Phantom Diffusion Weighted Data
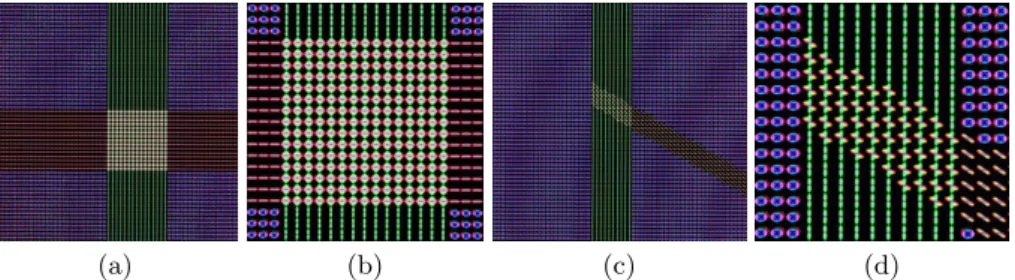
Two synthetic diffusion weighted phantoms were created for validation and are illustrated in Fig. 1: a case of two crossing fibers at a 90˚ angle and a case of one fiber splitting into two fibers at a 60˚ angle. For both phantoms, one non-weighted diffusion image and 81 raw gradient images with a single b-value of 3000 s.mm−2 were simulated using an equally weighted multi-tensor model at
each voxel. Rician noise was then added on the noise-free images with a relative standard deviation of 5%, to generate 50 samples of each phantom.
3.2 Evaluation Measures for Phantom Data
Four methods were utilized: DTI-based “mono-modal” (i.e., without particle clustering mechanism) tractography (DTI mono), DTI-based multi-modal trac-tography (DTI multi), ODF-based mono-modal tractrac-tography (ODF mono) and
(a) (b) (c) (d)
Fig. 1. Noise Free Diffusion Weighted Phantoms. ODF visualization of crossing fibers (a) with close-up view (b), and the bifurcating fibers (c) with close-up view (d).
ODF-based multi-modal tractography (ODF multi). For each phantom, a single seed voxel was placed in the upper branch. The initial direction of propagation was set towards the bottom. The following common parameters were used in all algorithms: resampling threshold α = 0.4, number of particles N = 1000, step length ρ = 1 mm, prior concentration κ = 30, and merge and split thresholds ξ1= 1 mm, ξ2= 1 and ξ3= 40. Tensors were considered as oblate for τ = 0.25.
The output fiber pathways are the averaged of each cluster of particles (a single one in mono-modal versions).
The tractography results were evaluated visually and with 3 different quanti-tative measures: (i) the proportion of fibers branching from the main direction, which is an indicator of branching capacity (ii) the root-mean-square error be-tween the end point (after Lmax iterations of the particle filter) of each fiber
following the main path and the expected arrival position (known in the phan-toms), which gives an idea of how spread the fibers are around the true one and (iii) the local curvature along each branching fiber for the bifurcation phantom, which translates how each branch was created from the main direction (either by an uncertain turn or by a sharper local turn).
The expected arrival position in the bifurcation phantom is not obvious. In this phantom, fibers going straight follow the inaccurate diffusion orientations given by the diffusion model in the heterogeneous region and are thus expected to deviate exclusively towards the right border of the vertical band. Therefore, we have chosen the end position for the bifurcation phantom at the center of the segment joining the center of the vertical band and its right border.
3.3 Clinical Diffusion Acquisition
The 4 algorithms were also applied on real clinical scans, acquired on a Siemens 3T scanner with a matrix size of 128x128, 60 slices (voxel size 2x2x2 mm3).
The diffusion acquisition consisted of one non-weighted diffusion image and 30 gradient images with a b-value of 1000 s.mm−2. Seed regions were placed by a
radiologist at the basis of the left and right cortico-spinal tracts (CST) in the mesencephalon, with filtering regions in the posterior limb of the internal capsule to keep only the CST. The same parameters as for synthetic data were utilized
for real data. A particle filter was initiated at each voxel of the seed regions and the fiber pathways are the averaged fibers of each cluster of particles.
4
Results
4.1 Experiments on Synthetic Data
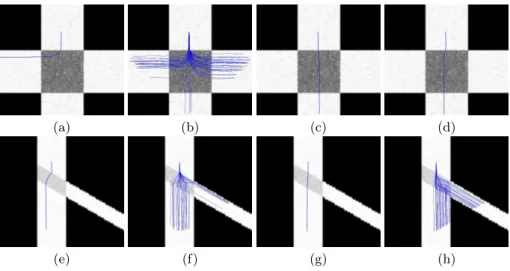
We present a representative example of the results achieved by each method in Fig. 2. We clearly notice that the 2 mono-modal methods fail to capture the multi-modality of the bifurcation phantom and therefore follow only one of the two directions. On the contrary, the 2 multi-modal methods are visually well able to capture the two branching fiber tracts, thanks to the adaptive clustering based on the proposed directions. It may be noted that DTI multi tends to obtain more fanning fibers, because the observation model is wide for oblate tensors. These visual results are valid for both crossing and bifurcation phantoms. However, in the crossing, fibers are only expected to go straight since the crossing ones are not part of the same pathway. Therefore, ODF mono and multi are performing well while DTI multi tends to capture too many branches.
(a) (b) (c) (d)
(e) (f) (g) (h)
Fig. 2. Tractography Results on Phantom Data. First row: crossing phantom, Second row: bifurcation phantom. Methods used were DTI mono (a,e), DTI multi (b,f), ODF mono (c,g), ODF multi (d,h).
We report in Table 1 the proportion of branching fibers for each phantom and each method. These quantitative results confirm the visual ones. When utilizing the mono-modal methods, only one of the two branches of each phantom is explored. On the contrary, multi-modal methods capture much better the 2 modes in the bifurcation phantom, with ODF multi being the closest to the half/half ground truth in each branch.
DTI mono DTI multi ODF mono ODF multi Crossing Phantom
Fiber proportion straight (%) 0 ± 0 8.75 ± 3.06 100 ± 0 98.76 ± 6.14 Fiber proportion branch (%) 100 ± 0 91.25 ± 3.06 0 ± 0 1.24 ± 6.14
RMS (mm) N/A 9.71 ± 3.71 2.09 ± 1.35 2.05 ± 1.15 Bifurcation Phantom
Fiber proportion straight (%) 93.88 ± 24.22 66.53 ± 4.06 100 ± 0 56.63 ± 4.59 Fiber proportion branch (%) 6.12 ± 24.22 33.47 ± 4.06 0 ± 0 43.37 ± 4.59 RMS (mm) 20.16 ± 6.07 15.36 ± 1.28 12.94 ± 0.29 9.08 ± 0.41 Table 1. Evaluation of Fibers on Phantom Data. Proportion of branching and straight fibers and Root Mean Squared error of fibers going straight with respect to true expected position, for each phantom.
In addition, Table 1 displays the RMS error towards the expected arrival point of the straight fibers only for those fibers which go in the straight branch of each phantom. For both phantoms, DTI mono and multi perform worse as DTI does not handle multiple directions. ODF multi outperforms the other methods, being able to better recover the final positions of the fibers.
(a) (b)
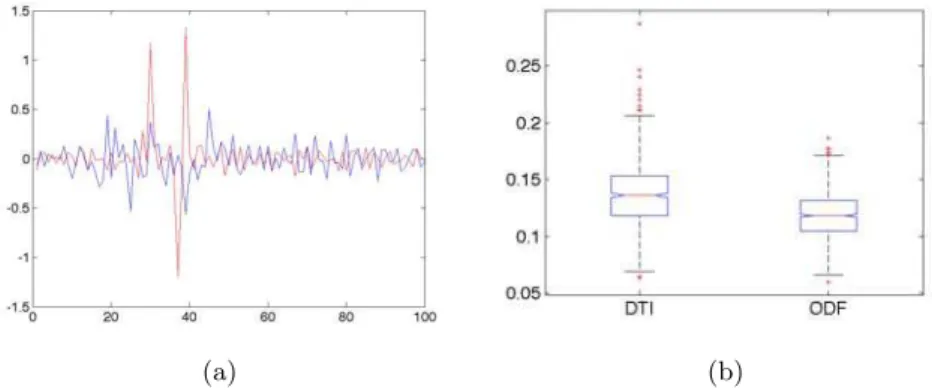
Fig. 3. Local Curvature of Branching Fibers. Evaluation of local curvature for the branching fibers of the splitting fibers phantom. (a): Local curvature on one sin-gle fiber (blue: DTI-based, multimodal, red: ODF-based, multimodal), (b): box-plot representation of inter-quantile range for DTI and ODF over all fibers and repetitions.
The last metric, only for the bifurcation phantom, is the local curvature of each mean fiber that deviates from the main vertical path. We report one representative example of the obtained curves as well as a box-plot of inter-quantile ranges of the curvatures along each mean fiber for all repetitions (Fig. 3). The curves of local curvatures clearly show a more peaked behavior for ODF multi (red curve), indicating that it branches more sharply. This was expected as the ODF model captures the 2 fiber orientations in the splitting region, whereas
the DTI model inaccurately estimates the fiber orientations and thus the particle filter is mainly driven by the previous direction with a wide observation model. Also, a one-way ANOVA quantitatively shows a significant difference (p⌧ 10−3)
between the standard deviations of the curvature of the 2 methods: away from the peaks, the curvature varies less with ODF multi than with DTI multi. 4.2 Experiments on Real Data
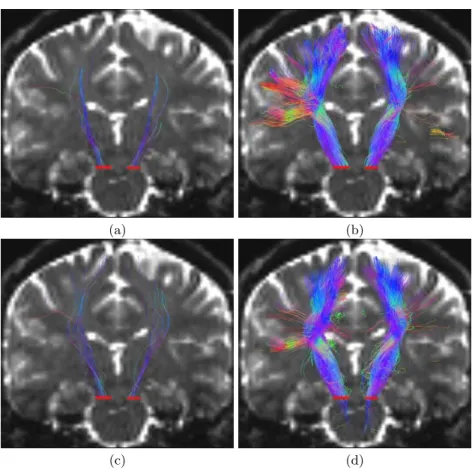
To illustrate the capacities of the proposed algorithms on real clinical datasets, we report in Fig. 4 the left and right cortico-spinal tracts (CST) obtained on a normal control subject. The results obtained here are consistent with those obtained on synthetic data. While the mono-modal methods do not capture branchings to lateral parts of the CST, both DTI multi and ODF multi are able to capture branches to the hand area or even sometimes the face area. Interestingly, DTI multi seems a bit more able to capture branches than ODF multi especially on the right side of the brain (left in the images). Since the data was acquired with only 30 gradient directions and a single low b-value of 1000 s.mm−2, it might indeed not be enough for the ODF model to identify
accurately multiple orientations. However, ODF mono and multi seem overall able to capture more accurate directions of the main tract.
5
Discussion
We have presented a new adaptive multi-modal particle filter algorithm for dif-fusion MRI probabilistic tractography. It relies on the adaptive clustering of the filtering distribution through a new scheme for splitting and merging clusters based on the distribution of directions and positions among clusters. This strat-egy is applied after each step of the filtering recursion. We have implemented this algorithm with two different diffusion models: DTI and ODF on a spherical harmonics basis.
We have demonstrated through experiments on synthetic and real data that our proposed algorithms outperform more classical particle filtering approaches available in the literature, being more able to capture branching and crossing fibers. In addition, the ODF multi-modal algorithm produces more accurate branchings and differentiate crossing fibers from splitting fibers, thanks to the diffusion model that already accurately captures multiple orientations.
As noted in Section 4.2, it will be interesting in the near future to apply this algorithm using other diffusion models such as multi-compartment models [26, 8, 2, 23], more adapted to data with a small number of gradient directions and a single low b-value. The proposed algorithm is very generic and can thus easily be extended to new diffusion models: only the proposal and the observation densities require to be modified to reflect the underlying diffusion model. Future work will also include evaluation on more real data cases, also with HARDI acquisitions, as well as an in-depth study of the usual parameters of a particle filter and their influence on the results.
(a) (b)
(c) (d)
Fig. 4. Tractography of the Left and Right Corticospinal Tracts. Coronal view of both corticospinal tracts using the four proposed methods: (a): DTI mono, (b): DTI multi, (c): ODF mono, (d): ODF multi. Fiber tracts are overlaid on the T2-weighted volume from the diffusion acquisition, red bars indicate the seeding regions.
References
1. Aganj, I., Lenglet, C., Sapiro, G., Yacoub, E., Ugurbil, K., Harel, N.: Reconstruc-tion of the orientaReconstruc-tion distribuReconstruc-tion funcReconstruc-tion in single- and multiple-shell q-ball imaging within constant solid angle. MRM 64(2), 554–66 (2010)
2. Assaf, Y., Basser, P.: Composite hindered and restricted model of diffusion (CHARMED) MR imaging of the human brain. NeuroImage 27(1), 48–58 (2005) 3. Assemlal, H., Tschumperl´e, D., Brun, L., Siddiqi, K.: Recent advances in diffusion
MRI modeling: Angular and radial reconstruction. MedIA (2011)
4. Banerjee, A., Dhillon, I., Ghosh, J., Sra, S.: Clustering on the unit hypersphere using von Mises-Fisher distributions. J. of Machine Learning 6, 1345–82 (2006) 5. Basser, P., Pierpaoli, C.: Microstructural and physiological features of tissues
eluci-dated by quantitative-diffusion-tensor MRI. J. Magn. Reson. 111(3), 209–19 (1996) 6. Basser, P.J., Pajevic, S., Pierpaoli, C., Duda, J., Aldroubi, a.: In vivo fiber
7. Basser, P., Mattiello, J., Le Bihan, D.: MR diffusion tensor spectroscopy and imag-ing. Biophysical journal 66(1), 259–67 (1994)
8. Behrens, T., Woolrich, M., Jenkinson, M., Johansen-Berg, H., Nunes, R., Clare, S., Matthews, P., Brady, J., Smith, S.: Characterization and propagation of uncer-tainty in diffusion-weighted MR imaging. MRM 50(5), 1077–88 (2003)
9. Behrens, T.E.J., Berg, H.J., Jbabdi, S., Rushworth, M.F.S., Woolrich, M.W.: Prob-abilistic diffusion tractography with multiple fibre orientations: What can we gain? NeuroImage 34(1), 144–55 (2007)
10. Bhalerao, A., Westin, C.F.: Hyperspherical von Mises-Fisher mixture (HvMF) modelling of high angular resolution diffusion MRI. In: MICCAI. pp. 236–43 (2007) 11. Doucet, A., Godsill, S., Andrieu, C.: On sequential Monte Carlo sampling methods
for Bayesian filtering. Statistics and Computing 10(3), 197–208 (2000)
12. Friman, O., Farneb¨ack, G., Westin, C.: A Bayesian approach for stochastic white matter tractography. IEEE TMI 25(8), 965–78 (2006)
13. Gasser, T., Sroka, L., Jennen-Steinmetz, C.: Residual variance and residual pattern in nonlinear regression. Biometrika 73(3), 625–33 (1986)
14. Jupp, P., Mardia, K.: A unified view of the theory of directional statistics. Inter-national Statistical Review 57(3), 261–94 (1989)
15. Lazar, M.: Mapping brain anatomical connectivity using white matter tractogra-phy. NMR in Biomedicine 23(7), 821–35 (2010)
16. Le Bihan, D.: Looking into the functional architecture of the brain with diffusion MRI. Nature reviews. Neuroscience 4(6), 469–80 (2003)
17. McGraw, T., Vemuri, B.: Von Mises-Fisher mixture model of the diffusion ODF. In: IEEE ISBI. pp. 65–8 (2006)
18. Mori, S., Crain, B.J., Chacko, V.P., van Zijl, P.C.: Three-dimensional tracking of axonal projections in the brain by magnetic resonance imaging. Annals of neurology 45(2), 265–9 (1999)
19. Ozarslan, E., Mareci, T.: Generalized diffusion tensor imaging and analytical re-lationships between diffusion tensor imaging and high angular resolution diffusion imaging. MRM 50(5), 955–65 (2003)
20. Parker, G., Wheeler-Kingshott, C., Barker, G.: Estimating distributed anatomical connectivity using fast marching methods and diffusion tensor imaging. IEEE TMI 21(5), 505–12 (2002)
21. Pontabry, J., Rousseau, F.: Probabilistic tractography using Q-ball modeling and particle filtering. In: MICCAI. pp. 209–16 (2011)
22. Staempfli, P., Jaermann, T., Crelier, G.R., Kollias, S., Valavanis, A., Boesiger, P.: Resolving fiber crossing using advanced fast marching tractography based on diffusion tensor imaging. NeuroImage 30(1), 110–20 (2006)
23. Stamm, A., P´erez, P., Barillot, C.: A new multi-fiber model for low angular reso-lution diffusion MRI. In: IEEE ISBI. pp. 936–39 (2012)
24. Stejskal, E.O.: Use of spin echoes in a pulsed magneticfield gradient to study anisotropic, restricted diffusion and flow. J. Chem. Phys. 43, 3597 (1965)
25. Tuch, D.S.: Q-ball imaging. MRM 52(6), 1358–72 (2004)
26. Tuch, D., Reese, T., Wiegell, M., Makris, N., Belliveau, J., Wedeen, V.: High angu-lar resolution diffusion imaging reveals intravoxel white matter fiber heterogeneity. MRM 48(4), 577–82 (2002)
27. Vermaak, J., Doucet, A., P´erez, P.: Maintaining multimodality through mixture tracking. In: IEEE ICCV. vol. 2, pp. 1110–6 (2003)
28. Zhang, F., Hancock, E., Goodlett, C., Gerig, G.: Probabilistic white matter fiber tracking using particle filtering and von Mises-Fisher sampling. MedIA 13(1), 5–18 (2009)