HAL Id: inserm-00935303
https://www.hal.inserm.fr/inserm-00935303
Submitted on 23 Jan 2014
HAL is a multi-disciplinary open access
archive for the deposit and dissemination of sci-entific research documents, whether they are pub-lished or not. The documents may come from teaching and research institutions in France or abroad, or from public or private research centers.
L’archive ouverte pluridisciplinaire HAL, est destinée au dépôt et à la diffusion de documents scientifiques de niveau recherche, publiés ou non, émanant des établissements d’enseignement et de recherche français ou étrangers, des laboratoires publics ou privés.
Region and boundary feature estimation on ultrasound
images using moment invariants.
Ke Wu, Huazhong Shu, Jean-Louis Dillenseger
To cite this version:
Ke Wu, Huazhong Shu, Jean-Louis Dillenseger. Region and boundary feature estimation on ultrasound images using moment invariants.. Computer Methods and Programs in Biomedicine, Elsevier, 2014, 113 (2), pp.446-455. �10.1016/j.cmpb.2013.10.016�. �inserm-00935303�
Region and boundary feature estimation on
ultrasound images using moment invariants
Ke Wu*,***, Huazhong Shu**,*** and Jean-Louis Dillenseger*,***
From:
* INSERM, U1099, Rennes, 35000, France; Universit´e de Rennes 1, LTSI, Rennes, F-35000, France;
** Laboratory of Image Science and Technology, School of Computer Science and Engineer-ing, Southeast University, NanjEngineer-ing, 21009, China;
*** Centre de Recherche en Information Biom´edicale Sino-fran¸cais, Laboratoire Interna-tional Associ´e, co-sponsored by INSERM, Universit´e de Rennes 1, France and Southeast Uni-versity, Nanjing, China.
Corresponding author: Jean-Louis Dillenseger
Laboratoire Traitement du Signal et de l’Image, Universit´e de Rennes I,
Campus de Beaulieu, 35042 Rennes Cedex, France. tel: +33 (0)2 23 23 55 78 fax: +33 (0)2 23 23 69 17 email: jean-louis.dillenseger@univ-rennes1.fr
Abstract
In ultrasound images, tissues are characterized by their speckle texture. Moment-based tech-niques have proven their ability to capture texture features. However, in ultrasound images, the speckle size increases with the distance from the probe and in some cases the speckle has a con-centric texture arrangement. We propose to use moment invariants with respect to image scale and rotation to capture the texture in such cases. Results on synthetic data show that moment invariants are able to characterize the texture but also that some moment orders are sensitive to regions and, moreover, some are sensitive to the boundaries between two different textures. This behavior seems to be very interesting to be used within some segmentation scheme dealing with a combination of regional and boundary information. In this paper we will try to prove the usability of this complementary information in a min-cut/max-flow graph cut scheme.
Keywords
Texture analysis, ultrasound images, speckle, moment invariants, min-cut/maw-flow graph cut.
1
Introduction
Segmentation of ultrasound images (US) is a difficult task because their characteristic feature is speckle. Speckle arises from signal interference caused by tissue micro-inhomogeneities (tissue cells, capillaries, blood cells, etc). This coherent summation of backscattered signals forms a spatial distribution of speckle that is specific to the density and distribution of the scatterers and thus to the nature of the tissue [1]. Several speckle spatial distribution models have been proposed in the literature according to the level of organization and density of scatterers within the tissues (Rayleigh-, Rician-, K-, Nakagami-distributions, etc.). Hence, speckle has been used in several ways to characterize tissues [2]. Some authors have tried to estimate the speckle distribution model using statistics on gray level intensities (e.g. [3]), but this class of methods overlooks the spatial nature of the distribution. Texture analysis has been traditionally used to characterize the spatial distribution of patterns. Besides studies that aimed to directly estimate the speckle distribution (see [4] for example), the use of general texture analysis methods had some success in ultrasound image segmentation (see [2] for a survey). However, texture analysis needs relatively large windows to perform feature estimation; this leads to a lack of precision, especially at tissue boundaries. Other US image characteristics can also make feature extraction
more problematic. Because of the ultrasound beam form, the size (or scale) of the speckle increases according to the distance from the ultrasound probe. Moreover, for circular probes, the ultrasound beam directions radiate from the probe center because of its geometry. These radial directions have a direct impact on the speckle orientations, which are different depending on the speckle position across the image (see the circular speckle organization in Fig. 1). In these cases, a texture analysis tool should be able to extract features that are invariant with regard to both scale and orientation. Some attempts have been proposed to extract invariant texture features using Gabor filters [5, 6]. In ultrasound image analysis, multiscale and multiorientation two-dimensional (2-D) Gabor filter banks (composed of six different orientations and two different scales) have been used to characterize the prostate boundaries and incorporate into a Kernel Support Vector machine for texture differentiation [7, 8]. The likelihood obtained by this means is then used to drive a deformable surface model; however, this scheme is relatively complex.
Moment-based texture analysis has been introduced in the literature. The main idea of this method is the extraction of some features by calculating a set of moments based on regions of interests (ROIs) on texture images. For example, low order geometric moments correspond to geometric meaning of texture in the ROI, such as mass, centroid and principal axes. Other classes of moments are not directly related to any specific properties of an image, but their suitability for texture characterization has been confirmed [9, 10, 11]. In his pioneer work, Hu proposed to derive a set of seven 2-D moment invariants from the classical geometrical moments according to translation, rotation and scale [12]. Hu’s moments have been widely used for pattern recognition, but could also be used for texture analysis.
Moments with orthogonal basis functions (e.g. Zernike, pseudo-Zernike polynomials) can represent an image by a set of mutually independent descriptors, and thus have a minimal amount of information redundancy. They were shown to have better image description capa-bility and to be more robust to noise than geometric moments. In the past few years, the construction of orthogonal moment invariants with respect to geometric transformations such as translation, scale and rotation has been investigated [13, 14, 15]. These moment invariants have been applied to pattern recognition. In this paper we propose to use them for texture analysis and aim to identify some of their properties that can be used in a simple segmentation scheme. The organization of this paper is as follows. Section 2 presents the three different sets of moment invariants. The performance of the features extracted by the moment invariants on simulated and real data is then evaluated in section 3. This same section presents also some
properties of the moment-invariant features, especially that they are able to extract either re-gional or boundary information. Several segmentation methods applied on gray scale images use together regional and boundary information (active contours, graph-cut, etc.). With the moment invariants, these techniques could be applied on US images. At the end of section 3 we will try to prove this assessment on a min-cut/max-flow graph cut scheme.
The originality of this paper is to highlight the usability of moment invariants to extract texture features when the texture is varying in scale and orientation as in US images. Some authors used Gabor filters bank [5, 6] After some test we were surprised to see the property that the moments of repetition q=0 provide regional information and these of repetition q=1 provide boundary information. This fact seems for us sufficiently interesting for a publication because several methods applied on gray scale images use regional and boundary information (active contours, etc.). With the orthogonal moment invariants, these techniques can now be applied on US images. We tried to prove this assessment on the graph cut scheme, but the graph cut itself is not here the main purpose of the paper.
2
Moment invariants
As specified in the introduction, the texture analysis on an ultrasound image should be per-formed using some descriptors that are invariant to rotation because of the radial organization of the speckle and invariant to image-scaling because the speckle size is directly related to the ultrasound beam diameter which is not constant over the image. In this study, we used com-plete sets of moment invariants reported in [13, 14, 15]. The following subsections give brief descriptions of these invariants.
2.1 Zernike moment invariants
The Zernike moment formulation is one of the most popular orthogonal moments. In the polar coordinate system, the 2-D Zernike moment (ZM ) of order p and repetition q (where p ≥ 0, |q| ≤ p and p − |q| = even) of an image intensity function f (r, θ) is defined as in [16]:
ZMp,qf = p+ 1 π ∫ 2π 0 ∫ 1 0 Rp,q(r) exp(−jqθ)f (r, θ)rdrdθ (1)
where Rp,q(r) is the orthogonal radial polynomial: Rp,q(r) = p−|q| 2 ∑ k=0 (−1)k (p − k)! k!(p+|q|2 − k)!(p−|q|2 − k)! rp−2k (2)
When an image undergoes a rotation of angle α, the Zernike moments of the transformed image are given by ZMp,qf exp(−jqα). Thus, the magnitude of the Zernike moment, i.e. |ZMp,qf |,
is invariant to rotation. However, as indicated by Flusser [17], the magnitudes do not generate a complete set of invariants, and completeness is an important property for assessment of image descriptors. Additionally, the original Zernike moments are not invariant to image scaling. To solve this problem, we proposed an approach to derive a complete set of Zernike moment invariants (ZM I) with respect to rotation and scaling of order p and repetition q (where p = q+ 2m with m ≥ 0) [13]: ZM Ip=q+2m,qf = exp−jqθf m ∑ k=0 m ∑ l=k Γ−(q+2l+2)f cqm,ldql,kZMq+2k,qf (3)
where ZMq+2k,qf is the original Zernike moment defined in (1), θf = arg(ZM1,1f ), Γf =
√
ZM0,0f and cqm,l and dql,k are given by:
cqm,l= (−1)m−lq+ 2m + 1 π (q + m + l)! k!(m − l)!(q + l)! dql,k = π l!(q + l)! (l − k)!(q + l + k + 1)!
Equation (3) shows that the moment invariants are a linear combination of their original moments, thus they maintain the capacity for texture characterization.
2.2 Pseudo-Zernike moment invariants
The 2-D Pseudo-Zernike moment (P ZM ) of order p and repetition q (where |q| ≤ p) was then defined as in [18]: P ZMp,qf = p+ 1 π ∫ 2π 0 ∫ 1 0 Pp,q(r) exp(−jqθ)f (r, θ)rdrdθ (4)
Pp,q(r) = p−|q| ∑ k=0 (−1)k (2p + 1 − k)! k! (p + |q| − k + 1)! (p − |q| − k)!r p−k (5)
Pseudo-Zernike moments have been proven to be superior to Zernike moments in terms of their feature representation capabilities and robustness in the presence of image quantization error and noise [18].
Following the same methodology as for the Zernike moments, a complete set of pseudo-Zernike moment invariants (P ZM I) with respect to rotation and scaling of order p and repe-tition q (where p = q + m with m ≥ 0) was constructed as in [14]:
P ZM Ip=q+m,qf = exp−jqθf m ∑ k=0 m ∑ l=k Γ−(q+l+2)f cqm,ldql,kP ZMq+k,qf (6)
where P ZMq+k,qf is the original pseudo-Zernike moment, θf = arg(P ZM1,1f ), Γf =
√
P ZM0,0f and cqm,l and dql,k are given by:
cqm,l= (−1)m−lq+ m + 1 π (2q + m + 1 + l)! l!(m − l)!(2q + 1 + l)! (7) dql,k= 2π l!(2q + l + 1)! (l − k)!(2q + l + k + 2)! (8)
2.3 Orthogonal Fourier-Mellin moment invariants
The 2-D orthogonal Fourier-Mellin moment (OF M M ) of order p with repetition q of an image intensity function f (r, θ) was defined as in [19]:
OF M Mp,qf = p+ 1 π ∫ 2π 0 ∫ 1 0 Qp(r) exp(−jqθ)f (r, θ)rdr (9)
where Qp(r) is a radial polynomial given by:
Qp(r) = p ∑ k=0 (−1)p+kcp,krk (10) cp,k = (−1)p+k (p + k + 1)! (p − k)!k!(k + 1)! (11)
For region of small radial distance the description by orthogonal Fourier-Mellin moments has been found to be better than that by the Zernike moments in terms of image-reconstruction errors and signal-to-noise ratio [19]. It can be proven that when q = 0, OF M Mp,0f = P ZMp,0f .. A complete set of orthogonal Fourier-Mellin moment invariants (OF M M I) with respect to rotation and scaling of order p and repetition q of an image intensity function f (r, θ) was constructed as in [15]: OF M M Ip,qf = exp−jqθf p ∑ k=0 p+ 1 k+ 1 ( p ∑ l=k Γ−(l+2)f cp,ldl,k ) OF M Mk,qf (12)
where OF M Mk,qf is the original orthogonal Fourier-Mellin moment, θf = arg(OF M M1,1f ),
Γf =
√
OF M M0,0f , cp,l is defined by (11) and dl,k is given by:
dl,k= (2k + 2)
l!(l + 1)!
(l − k)!(l + k + 2)! (13)
As for the original moments, it can be proven that when q = 0, OF M M Ip,0f = P ZM Ip,0f .
3
Results and discussion
In this section we evaluate the behavior of the three moment-invariant sets relative to their original sets, as well as to the Hu’s moment invariants [12]. Because the magnitude of the orthogonal complex moments is supposedly invariant to rotation, we will only use this modulus in the rest of the paper. Hu’s moments will be denoted as Hun with n indicating the same
invariant moment number as given in Hu’s paper.
3.1 Material
The evaluations were performed on a synthetic image and on in vivo ultrasound data.
The synthetic image was composed of an elliptically-shaped region set within a background region. The ultrasound simulation was performed by the method described in [20]. This method predicts the appearance and properties of a B-Scan ultrasound image from the spatial distri-bution of point scatterers. In our case, each region was characterized by a specific acoustic impedance and spatial distribution of scatterers. The parameters defined in [20] for fat and liver were used to differentiate the two regions. This scatterer model served as input for the
simulation of an ultrasound image acquired with a C2 5 circular ultrasound scanning 3.5 MHz probe (Fig. 1-a). In this image the gray scale depended only on the spatial distribution of the scatterers. The image size was 512 × 512.
The in-vivo data was a transrectal prostate image acquired intraoperatively on an Ablatherm device (Fig. 1-b). The transrectal ultrasound imaging probe operated at 7.5 MHz. A slice had 500 × 490 pixels with a transverse pixel size of 0.154 mm/pixel and a thickness of 2 mm.
3.2 Invariance to rotation and scale
First, we evaluated the rotation and scale invariance of our moment-invariant sets. We extracted a 51 × 51 ROI window from the bottom of the simulated ultrasound image (see Fig. 1-a) and applied rotation and scaling transformations to this sub-image. The moment sets were then computed in the center of this transformed sub-image.
Rotation invariance: the extracted sub-image was first rotated by an angle from 0 to 90.
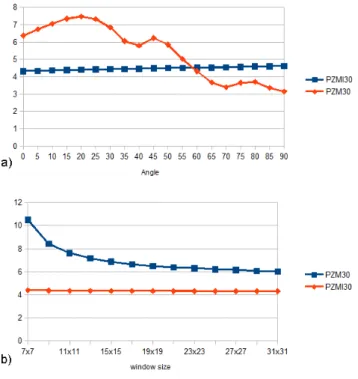
We evaluated the variation of the modulus of the moment sets and the moment invariants with regard to the rotation angle. In this paper, we present this variation and compare the sets of classical moments with their invariant forms for P ZM and P ZM I only. However, these results can be generalized to all the other moment sets. So, as an example, Fig. 2-a shows the variation of the moduli of P ZM3,0 and P ZM I3,0 in relation to rotation angle. Surprisingly, even if the
moduli of the classical moments (ZM , P ZM and OF M M ) should be theoretically invariant to rotation they show some relatively high variations around a mean value when the angle changes. Our proposed invariant sets (ZM I, P ZM I and OF M M I) remains almost constant when the angle changes.
Scale invariance: we tested this invariance by increasing the moment window size from 7 × 7
to 31 × 31 pixels. The same speckle pattern was seen at several scales when the window size was varied. An example of moment behavior with scale can be seen in Fig. 2-b. In this figure, as was also the case for all the moment sets, the value of the classical moments is window-dependent but remains stable for the moment invariants.
3.3 Moment widow size
Although the moment invariants are scale independent, window size is an important parameter for any texture feature extraction method. A compromise must be found between a large window size to capture the feature and a small window size to accurately locate the information. Window
size is usually related to the spatial scale of the texture. We choose to illustrate the effect of the window size on the estimation of the P ZM I1,1 feature of the synthetic image. This feature
presents some fine structures which will directly impacted by the window size. In this image, the speckle longitudinal size was about 20 pixels. Fig. 3 shows the P ZM I1,1 feature computed
with a window sizes of 11 × 11, 21 × 21 and 31 × 31. It can be clearly notified that the feature homogeneity increases with the window size but at the expense of the thinness of the features. In this case, the 21 × 21 window seemed to be a good compromise between the homogeneity of the features and the accuracy to extract some image components. This window size will be used in the rest of this paper. This behavior was confirmed for the other moment feature measurements.
3.4 Order and repetition characteristics
In this section we will try to evaluate the behavior of the moment invariants according to the order p and repetition q parameters.
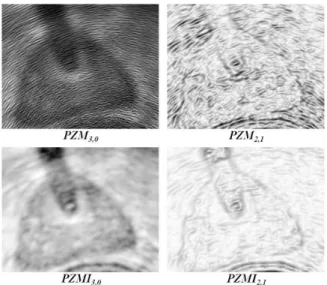
Order itself has a relatively low influence on the final result. As an example Fig. 4 shows the resulting images for P ZM Ip,0 with p increasing from 1 to 3. We can observe that the images
are relatively similar. Maybe the images seems to be a bit more irregular for higher orders but the details like then contours are more well defined.
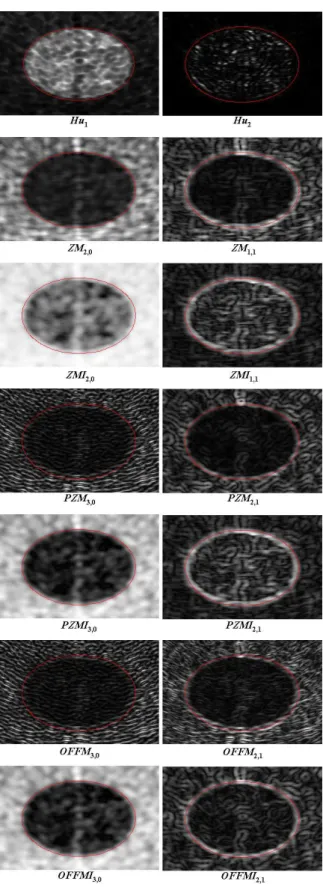
The effect of the repetition is more interesting in the context of further segmentation. The behavior of the repetition can be clearly seen on Fig. 5. We can note that Hu1 and the moments
of repetition q = 0 (see first column of Fig. 5) are able to extract some features that are sensitive to regional texture information. On all these images, it can be seen that the moments and the moment invariants are able to characterize differently the two textured regions. However, when q = 1, and also to a certain extent for Hu2 (see second column of Fig. 5), the features are
sensitive to rupture between two textures. These later features seem to be very informative about the boundaries of the objects and could be similar to a ”gradient of texture”.
This regional and boundaries extraction behavior can also be seen on the features estimated from the real transrectal prostate ultrasound data (see Fig. 6 for the pseudo-Zernike case). On this figure, the features extracted using the moment invariants are also more homogeneous than those obtained using the classical moments.
3.5 Invariance properties for texture estimation
We tried to prove the invariance properties of moment invariants for texture feature estimation both qualitatively and quantitatively. We made these tests on the simulated ultrasound image in Fig. 1-a. Qualitative results can be seen on Fig. 5 which shows a selection of extracted features from several kinds of moments and moment invariants with different values of order p and repetition q. For the quantitative evaluation, we choose forty points (the crosses on Fig. 1-a) in the same region but at different locations, thus having different speckle orientation and scale. The measurement of the Relative Standard Deviation (RSD - the absolute value of the ratio of the standard deviation to the mean) of the features computed on those points was used to estimate the invariance ability (Table 1).
It can be seen on Table 1 that for the classical moments the value of the texture feature is very dependent on the location of the ROI because of differences in speckle orientation and scale. In contrast, moment invariants showed a relatively (or more) stable measure. The proposed orthogonal moment invariants also showed more stable features than Hu’s moment invariants. This behavior is also noticeable on the feature images of Fig. 5 when visually comparing the images of the classical moments and its equivalent (same order and repetition) moment invariants. In all the cases the features in a same region are more homogeneous when estimated by moment invariants. This is specially true for P ZM and OF F M which seems to have an incoherent behavior in a region sharing the same speckle distribution. This could be generalized for moments of any order or repetition.
However, it could be noted that the RDS for the moments (classical and invariants) with repetition q = 1 and for Hu2 were much higher than for the moments with q = 0 and for
Hu1. This increase is explained by the fact that in these cases where the moments features are
sensitive to the rupture between two textures, the means of the values were close to 0.
In conclusion, the features extracted by moments invariants, are relatively homogeneous (small RDS) within a region sharing the same speckle distribution. They can so be used as texture descriptors. In all the cases, moments invariants showed a more homogeneous behavior than the classical moments.
3.6 Proposal for using moment texture features
In texture analysis, a set of texture features (moments and others) are usually measured on the image, and a classification process is then performed in order to characterize the objects
of interest. However, as the moment-invariant features with repetition q = 0 provide regional information and those with q = 1 provide information on the boundaries of a textured re-gion, this allows us to use the texture features differently. In many segmentation techniques, boundary information alone or in combination with regional information is needed, i.e. active contours, deformable models, level sets, etc. Some of these techniques have been adapted to deal with ultrasound images and require boundary information (e.g. [21] where some Gabor based invariants where used to constraint snake models). Our two kinds of moment-invariant features (q = 0 regional information and q = 1 boundary information) could be directly used in such a segmentation scheme dealing with ultrasound images.
3.7 Graph-cut, a way to integrate region and boundary information
The aim of this section is to try to prove the previous assessment, without loss of generality, by using the two kinds of moment-invariant features in a min-cut/max-flow graph cut algorithm. So we will show how the features extracted by orthogonal moments can be directly used in a combined region and boundary based segmentation algorithm and how the boundary infor-mation can improve the segmentation. However, the goal of this section is neither to evaluate finely the impact of the several parameters used in the graph-cut segmentation nor to compare its performance to other techniques.
The min-cut/max-flow graph cut algorithm popularized by Boykov is able to handle regional and boundary information simultaneously [22]. To summarize, the segmentation problem can then formulated by the energy function ET = Eclassif+ λ · Econtinuity. Eclassif is an energy term
coding the probability that a pixel belongs to the class ”object” or ”background” (a regional energy). Econtinuityis an energy term coding the degree of similarity or discontinuity between two
neighboring pixels (a boundary energy). The coefficient λ controls the balance between these two energy terms. The energy terms are encoded within the graph as link weights estimated from the pixel values based on the region and continuity (or boundary) properties of the image [22, 23]. To validate the usability of the moment invariants, we adapted a variant of the min-cut/max-flow graph cut algorithm presented in [23]. We used the moment-invariant features with repeti-tion q = 0 in order to encode the regional informarepeti-tion and the moment-invariant features with repetition q = 1 to encode the similarity between adjacent pixels. As an example, we will take the case with Zernike moment invariant features. In this method, the user labels interactively some pixels as ”object” and others as ”background” (e.g. Fig. 7-a or 8-a). The normalized
histogram of these pixels in ZM Ip,0 is used to define the probability density function Pobject
(resp. Pbackg). For a pixel u, the weights {u,S} (resp. {u,T})1 associated with the regional
energy can be seen in Table 2. Econtinuity is encoded on the links between two adjacent pixels
{u, v}. This weight should be high between two neighboring pixels within the same region and low on boundaries. We first normalized and inverted ZM Ip,1 to obtain image ZM Ip,1′ which
was representative of the continuity between neighboring pixels. The weight between {u, v} was then given by: ZM Ip,1′ (u)+ZM Ip,1′ (v)
2 (see Table 2).
We performed the evaluation for the Hu’s moment invariants and the three orthogonal moment invariants on the simulated US image (Fig. 1-a). Some small areas of pixels were interactively selected in both the object and background regions (Fig. 7-a). These were used as seed points for the segmentation and also serve as training basis for the Eclassif-related initial
weight assignment. The extracted region was compared with the real elliptically-shaped region. Each pixel could be classified as true positive (with T P the number of true positives), false positive (resp. F P ), true negative (resp. T N ) or false negative (resp. F N ). The performance of our segmentation scheme is presented as fractional area difference (F P−F N
T P+F N ) , sensitivity ( T P T P+F N ) and accuracy(T PT P+F N−F P).
The crucial points of our method are: the choice of the features used to encode the region and boundary information, and the balance coefficient λ.
After some exploratory work we noticed that the more accurate results were obtained by using relatively high order moments for the regional information Hu1, ZM I2,0, P ZM I3,0 and
OF M M I3,0 and for the regional information Hu2, ZM I1,1, P ZM I2,1 and OF M M I2,1. These
features can be seen in Fig. 5 and are consistent with the remarks made in the previous section about more well defined details for higher moment orders.
The λ parameter setting was trickier because its influence is not linear and is data dependent. First, in an exploratory study, we interactively tuned λ to analyze its influence. We noticed that, even with a relatively small λ, the continuity term was taken into account within the segmentation. Then, for a relatively large range of variation in λ, the segmentation results remained almost the same, with only some small changes on the boundaries. Finally, for very high values of λ (over 100) the segmentation accuracy decreased. Fig. 7 shows the impact of the variation of λ. The segmentation results presented were obtained using the ZM I set. For λ = 0,
1S and T are the two terminal nodes associated with the labels ”object” and ”background” respectively,
we only had the influence of the regional information of ZM I2,0 (Fig. 7-b). With λ = 1, the
boundary information of ZM I1,1 was mixed with the regional information in order to delineate
the region with a higher accuracy (Fig. 7-c).
Table 3 compares the performance between the segmentation results of the min-cut/max-flow graph cut algorithm with λ = 1, using methods based on Hu, Zernike, pseudo-Zernike and orthogonal Fourier-Mellin moment invariants and the equivalent classical moments. In all cases (except one), moment invariants gave better results than the classical moments. The classical P ZM and OF M M totally failed to extract the elliptic region because their behavior was too inhomogeneous. Surprisingly, the classical ZM gave very good results. Even though its relative standard deviation was not as good than that of ZM I (see Table 1) the contrast (the mean values difference) between the 2 regions in ZM2,0 was much higher than in ZM I2,0, allowing
good regional information. If we compare the results obtained using the four moment-invariant sets we can see that OF M M I showed a relatively better performance in the case of the synthetic data.
We applied our method to the real transrectal prostate image (Fig. 1-b). In this data, the speckle within and outside the prostate was more heterogeneous than that in the synthetic US. Moreover, a urethral catheter was placed to protect the urethra from injury during HIFU ablation, and this catheter projected the classical ultrasonic shadow. However we expected to be able to overcome this problem by interactively setting some well adapted seed points (see Fig. 8-a). The input images were the same moment features (same order and repetition) as for the synthetic data. However we changed the window size to 11 × 11 to adjust it to the transrectal prostate speckle dimension. Fig 8 compare the segmentation results of the min-cut/max-flow graph cut algorithm with a λ = 1, using the different moment sets. Because of the non-homogeneity of speckle within the prostate, all the segmentation results show some gaps within the extracted region . However, two facts can be observed from Fig 8. First, the classical moment sets were less efficient than the invariant moment sets for describing the prostate, mainly because they were less capable of expressing the regional information. This was especially true for P ZM and OF M M that have failed to close the boundary of the prostate. Second, it can be seen that the orthogonal moment-invariant sets provided smoother boundaries than the classical sets, probably because they estimated more homogeneous features. Nevertheless it is difficult to significantly compare the different classes of moments on only the graph cut because the final segmentation result is directly dependent on user interaction (variables seed points and
λ value). However, in all the cases the segmentation was easier to tune with the orthogonal moment-invariant sets than with the other sets.
In conclusion, the purpose of this section was only to demonstrate that the region and boundary information obtained by moment-invariant sets on ultrasound image can be directly used in a classical segmentation method. Within the min-cut/max flow graph-cut framework, moments invariants showed their ability to extract texture information from the ultrasound image. Moreover the fact that moment invariants were able to extract boundary information clearly improved the segmentation results.
4
Conclusion
In this paper, we presented three sets of orthogonal moment invariants that can be used to ex-tract texture features when the texture pattern has a concentric organization or when its scale changes in the image, as with the speckle in ultrasound images, for example. The moment-invariant features extracted on a simulated circular ultrasound image demonstrated that they are able to extract the global distribution of the speckle and that they are little sensitive to speckle orientation or scale changes. These results also showed that some features were sensi-tive to regional texture information and others enhanced the boundaries between two textured regions. The features sensitive to the boundaries between two textured regions can be seen as texture ”gradient” and can thus be used in segmentation techniques where the boundary information is needed, i.e. active contours, deformable models, level sets, etc. In order to demonstrate the usability of moment-invariant features, such as region and boundary informa-tion, we introduced this joint information into the min-cut/max-flow graph cut algorithm. The resulting segmentations on simulated and real ultrasound images demonstrated the benefits of the joint region- and boundary-sensitive moment-invariant texture features. Moment invari-ants are so eligible to be used to adapt techniques based on the combination on regional and boundary information to the segmentation of ultrasound images.
5
Acknowledgment
This work was part of the MULTIP project (ANR-09-TCS-011-04)) which was supported by the French National Research Agency under the Health Technology Program (ANR TecSan), by the National Basic Research Program of China under Grant 2011CB707904, the National
Natural Science Foundation of China under Grants 61073138, 60911130370, 61271312, and by a PhD grant from the China Scholarship Council.
References
[1] R. F. Wagner, S. W. Smith, J. M. Sandrik, and H. Lopez. Statistics of speckle in ultrasound B-scans. IEEE Trans. Sonics Ultrason., 30(3):156–163, 1983.
[2] J. A. Noble and D. Boukerroui. Ultrasound image segmentation: a survey. IEEE Trans.
Med. Imag., 25(8):987–1010, 2006.
[3] J. C. Seabra, F. Ciompi, O. Pujol, J. Mauri, P. Radeva, and J. Sanches. Rayleigh mixture model for plaque characterization in intravascular ultrasound. IEEE Trans. Biomed. Eng., 58(5):1314–1324, 2011.
[4] P. M. Shankar. The use of the compound probability density function in ultrasonic tissue characterization. Phys. Med. Biol., 49(6):1007–1105, 2004.
[5] J. Zhang and T Tan. Invariant texture segmentation via circular Gabor filters. In 16th
IAPR International Conference on Pattern Recognition, ICPR’02, volume 2, pages 901–
904, Qu´ebec, Canada, 2002.
[6] Ju Han and Kai-Kuang Ma. Rotation-invariant and scale-invariant Gabor features for texture image retrieval. Image Vision Comput., 25:1474–1481, 2007.
[7] D.G. Shen, Y.Q. Zhan, and C. Davatzikos. Segmentation of prostate boundaries from ultrasound images using statistical shape model. IEEE Trans. Med. Imag., 22(4):539–551, 2003.
[8] Y. Q. Zhan and D. G Shen. Deformable segmentation of 3-D ultrasound prostate images using statistical texture matching method. IEEE Trans. Med. Imag., 25:256–272, 2006. [9] J. Bigun and J. M. H. du Buf. N-folded symmetries by complex moments in Gabor space
and their application to unsupervised texture segmentation. IEEE Trans. Pattern Anal.
Mach. Intell., 16(1):80–87, 1994.
[10] M. Tuceryan. Moment-based texture segmentation. Pattern Recogn. Lett., 15(7):659–668, 1994.
[11] M.K. Mandal, T. Aboulnasr, and S. Panchanathan. Image indexing using moments and wavelets. IEEE Trans. Consum Electr, 42(3):557–565, 1996.
[12] M. K. Hu. Visual pattern recognition by moment invariants. IRE Trans. Inf. Theory, 8(2):179–187, 1962.
[13] B Chen, H. Z. Shu, H. Zhang, G. Coatrieux, L. M. Luo, and J. L. Coatrieux. Combined invariants to similarity transformation and to blur using orthogonal Zernike moments.
IEEE Trans. Image Process., 20(2):345–360, 2011.
[14] H. Zhang, Z. F. Dong, and H. Z. Shu. Object recognition by a complete set of pseudo-Zernike moment invariants. In IEEE International Conference on Acoustics Speech and
Signal Processing (ICASSP), pages 930–933, Dallas, TX, 2010.
[15] H. Zhang, H. Z. Shu, P. Haigron, B. S. Li, and L. M. Luo. Construction of a complete set of orthogonal Fourier-Mellin moment invariants for pattern recognition applications.
Image Vision Comput., 28(1):38–44, 2010.
[16] R. Mukundan and K.R. Ramakrishnan. Moment functions in image analysis: theory and
applications. World Scientific, 1998.
[17] J. Flusser. On the independence of rotation moment invariants. Pattern Recognition, 33(9):1405–1410, 2000.
[18] C.-H. Teh and R. T. Chin. On image analysis by the methods of moments. IEEE Trans.
Pattern Anal. Mach. Intell., 10(4):496–513, 1988.
[19] Y. L. Sheng and L. X. Shen. Orthogonal Fourier-Mellin moments for invariant pattern recognition. J. Opt. Soc. Am. A, 11(6):1748–1757, Jun 1994.
[20] J.-L. Dillenseger, S. Laguitton, and E. Delabrousse. Fast simulation of ultrasound images from a CT volume. Comput. Biol. Med., 39(2):180–186, 2009.
[21] C. M. Chen, H. H. Lu, and Y. C. Lin. An early vision-based snake model for ultrasound image segmentation. Ultrasound Med Biol, 26(2):273–285, Feb 2000.
[22] Yuri Boykov and Gareth Funka-Lea. Graph cuts and efficient N-D image segmentation.
[23] S. Esneault, N. Hraiech, E. Delabrousse, and J.-L. Dillenseger. Graph cut liver segmentation for interstitial ultrasound therapy. In 29th IEEE EMBS conf. (EMBC’07), pages 5247–50, Lyon, 2007.
List of Figures
1 Image data. a) A simulated C2 5 circular probe ultrasound image. The elliptic region and the outer region simulate the properties of liver and fat tissues, re-spectively. The square in the bottom is the ROI used in section 3.2. The crosses indicate the location of 40 ROIs used in section 3.5. b) A transrectal prostate ultrasound image. . . 19 2 Invariance ability. Variation of P ZM3,0, P ZM I3,0 in relation to: a) speckle
orientation and b) speckle scale. In this later case, the speckle remains constant but the moment window size is varying. . . 20 3 P ZM I1,1 values estimated with a 11 × 11, 21 × 21 and 31 × 31 window size. In
this figure only a rectangular window around the elliptic region of the simulated image is shown. The elliptic region boundary is shown in red. . . 20 4 Influence of the order p. P ZM Ip,0 with p increasing from 1 to 3. In this figure
only a rectangular window around the elliptic region of the simulated image is shown. The elliptic region boundary is shown in red. . . 20 5 Selection of texture features extracted from classical moments and moment
in-variants at several order p and repetition q. The first column shows Hu1 and
several orthogonal moments and moment invariants of repetition q = 0. The sec-ond column shows Hu2 and several orthogonal moments and moment invariants
of repetition q = 1. In this figure only a rectangular window around the elliptic region of the simulated image is shown. The elliptic region boundary is shown in red. . . 21 6 Some features extracted on the transrectal prostate ultrasound image. . . 22 7 Graph cut segmentation results. a) Graph cut seed points (green: ’object”, red:
”background”). The estimated boundaries using ZM I features with: b) λ = 0, with only the regional information, and c) λ = 1, with a mixture of region and boundary information. . . 22 8 Transrectal prostate ultrasound image segmentation. a) the seed points (green:
”object”, red: ”background”) and (in black) the contour drawn by an expert. Others: segmentation results. . . 23
List of Tables
1 Comparisons of the invariance properties of the moments on a simulated US image. RSD Relative Standard Deviation. . . 24 2 Initial weights for the graph cut segmentation. . . 25 3 Comparisons of moments-based texture segmentation on a simulated US image . 25
Figure 1: Image data. a) A simulated C2 5 circular probe ultrasound image. The elliptic region and the outer region simulate the properties of liver and fat tissues, respectively. The square in the bottom is the ROI used in section 3.2. The crosses indicate the location of 40 ROIs used in section 3.5. b) A transrectal prostate ultrasound image.
Figure 2: Invariance ability. Variation of P ZM3,0, P ZM I3,0in relation to: a) speckle orientation
and b) speckle scale. In this later case, the speckle remains constant but the moment window size is varying.
Figure 3: P ZM I1,1 values estimated with a 11 × 11, 21 × 21 and 31 × 31 window size. In this
figure only a rectangular window around the elliptic region of the simulated image is shown. The elliptic region boundary is shown in red.
Figure 4: Influence of the order p. P ZM Ip,0 with p increasing from 1 to 3. In this figure only
a rectangular window around the elliptic region of the simulated image is shown. The elliptic region boundary is shown in red.
Figure 5: Selection of texture features extracted from classical moments and moment invariants at several order p and repetition q. The first column shows Hu1 and several orthogonal
mo-ments and moment invariants of repetition q = 0. The second column shows Hu2 and several
orthogonal moments and moment invariants of repetition q = 1. In this figure only a rectan-gular window around the elliptic region of the simulated image is shown. The elliptic region
Figure 6: Some features extracted on the transrectal prostate ultrasound image.
Figure 7: Graph cut segmentation results. a) Graph cut seed points (green: ’object”, red: ”background”). The estimated boundaries using ZM I features with: b) λ = 0, with only the regional information, and c) λ = 1, with a mixture of region and boundary information.
Figure 8: Transrectal prostate ultrasound image segmentation. a) the seed points (green: ”ob-ject”, red: ”background”) and (in black) the contour drawn by an expert. Others: segmentation results.
Table 1: Comparisons of the invariance properties of the moments on a simulated US image. RSD Relative Standard Deviation.
Repetition q = 0 Repetition q = 1 Method RSD Method RSD ZM2,0 28.1% ZM1,1 1125% ZM I2,0 0.70% ZM I1,1 77.2% P ZM3,0 31.5% P ZM1,1 1125% OF F M3, 0 OF M M1,1 2604% P ZM I3,0 2.36% P ZM I1,1 382% OF F M I3, 0 OF M M I1,1 137% Hu1 21.3% Hu2 96.8%
Table 2: Initial weights for the graph cut segmentation.
links costs condition
{u, v} λ·ZM In,1′ (u)+ZM In,1′ (v)
2 for {u, v} ∈ N
{u,S}
∞ for u label. ”object”
Pobject(ZM In,0(u)) for the other u
{u,T}
∞ for u label. ”backg”
Pbackg(ZM In,0(u)) for the other u
Table 3: Comparisons of moments-based texture segmentation on a simulated US image Fract area diff Sensitivity Accuracy
Hu -7.8% 91.81% 91.42% ZM -4.63% 95.0% 94.63% ZM I -6.42% 93.47% 93.36% P ZM -90.87% 9.13% 9.13% P ZM I -4.22% 95.33% 94.88% OF M M -90.83% 9.17% 9.17% OF M M I -2,35% 96,99% 96,33%