Publisher’s version / Version de l'éditeur:
Annals of Glaciology, 6, pp. 9-14, 1985
READ THESE TERMS AND CONDITIONS CAREFULLY BEFORE USING THIS WEBSITE. https://nrc-publications.canada.ca/eng/copyright
Vous avez des questions? Nous pouvons vous aider. Pour communiquer directement avec un auteur, consultez la première page de la revue dans laquelle son article a été publié afin de trouver ses coordonnées. Si vous n’arrivez pas à les repérer, communiquez avec nous à PublicationsArchive-ArchivesPublications@nrc-cnrc.gc.ca.
Questions? Contact the NRC Publications Archive team at
PublicationsArchive-ArchivesPublications@nrc-cnrc.gc.ca. If you wish to email the authors directly, please see the first page of the publication for their contact information.
NRC Publications Archive
Archives des publications du CNRC
This publication could be one of several versions: author’s original, accepted manuscript or the publisher’s version. / La version de cette publication peut être l’une des suivantes : la version prépublication de l’auteur, la version acceptée du manuscrit ou la version de l’éditeur.
Access and use of this website and the material on it are subject to the Terms and Conditions set forth at
Characteristics of flowing snow and avalanche impact pressures
McClung, D. M.; Schaerer, P. A.
https://publications-cnrc.canada.ca/fra/droits
L’accès à ce site Web et l’utilisation de son contenu sont assujettis aux conditions présentées dans le site LISEZ CES CONDITIONS ATTENTIVEMENT AVANT D’UTILISER CE SITE WEB.
NRC Publications Record / Notice d'Archives des publications de CNRC:
https://nrc-publications.canada.ca/eng/view/object/?id=1ae5cca7-3de7-46a0-8c2a-cf4fd5839d4f
https://publications-cnrc.canada.ca/fra/voir/objet/?id=1ae5cca7-3de7-46a0-8c2a-cf4fd5839d4f
Ser
TH1
N21d
10.
1354
National Research
Conseil national
c.
2
19
Council Canada
de recherches Canada
Institute for
lnstitut de
-Research in
recherche en
Construction
construction
Characteristics of Flowing Snow and
Avalanche Impact Pressures
by D.M. McClung and P.A. Schaerer
Reprinted from
Annals of Glaciology,
6, 1985
p. 9-14
(IRC Paper No. 1354)
Price $1.25
NRCC 25354
Ce document fait &at
de donn6es exp6rimentales sur les
pressions d'impact et les vitesses des avalanches seches et
humides dans un couloir d'avalanches situ6 dans le col Rogers,
en Colombie-Britannique.
Les donnees obtenues
3
l'aide de
petits dynamomstres de pression
( 6 4 5
mm2 de surface) plac6s en
divers points de la section verticale des avalanches montrent
que la fr6quence d'impact des particules, et donc leur densit6,
augmentent rapidement.
au fil de la coul6e.
Les donnees fournies par une grande plaque d'impact circulaire
( 1 9 6
000 mm2) install& juste au-dessus de la surface du sol
-indiquent que, pour une m8me vitesse, les pressions maximales
des avalanches seches sont relatlvement plus 6lev6es, et leurs
pressions moyennes relativement plus faibles, que celles des
avalanches humides.
Dans les deux types d'avalanche, les
coulees de debris peuvent prgsenter des caract6ristiques
d'ondes
longitudinales, mais il semble que ce soit
1
'exception.
La cornparaison des
d'autres 6tudes re
pressions maximale
pour ce qui est
attribuable au
--dynamomstres don1
la dimension
d
l'influence de
1
avec de petits
plaque d
'
impact
,ltats
r
des
6lev6
est
- - --A,des
:t de
Itrer
bnues
rande
Annals o f Glaciology 6 1985
@ International Glaciological Society
CHARACTERISTICS OF FLOWING SNOW AND AVALANCHE
IMPACT PRESSURES
by
D.
M.
MCCLUNG AND P. A. SmmmmNational Research Council, 3904 West 4th Avenue, Vancouver, BC, V6R 1P5
ABSTRACT
Experimental data on avalanche impact pressures and speeds from a n avalanche path a t Rogers Pass, B.C., are presented f o r both dry and wet avalanches. Data from small load cells (645 mm2 surface) a t various heights through the vertical cross-section of the avalanches show that the frequency of particle impact and hence flow density increases rapidly from top to bottom of the flow.
Data from a large circular impact plate (196 000 mm2) just above the ground surface show that dry avalanches have relatively higher peak pressures and relatively lower average pressures than wet avalanches for a given speed. Longitudinal wave-like characteristics in the flow may be seen for both wet and dry avalanches, but they appear to be the exception rather than the rule.
Comparison of pressure results with those of other studies shows good agreement f o r peak pressures, but average pressures are generally less than those of previous studies. This discrepancy is attributed to the past use of cells f o r which loading surface size approached typical particle size. The size effect may be demonstrated by comparison of small cell data with results from the large impact plate a t Rogers Pass. INTRODUCTION
Field measurements of impact pressures and speeds of avalanches are necessary to provide information about expected dynamic loading on structures placed i n their paths. Coupled with observations of avalanches, such data also supply information about the related problem of formulation of avalanche dynamics models. Owing to the experimental difficulties involved and the necessity for making studies under full-scale conditions, there is a scarcity of usable data regarding this important applied problem. With this in mind the avalanche research group of the National Research Council of Canada has carried out observations of avalanche impact pressures and speeds f o r several years.
The impact pressure measurements described in this paper d i f f e r f r o m those of most other studies because the impact loading surface is usually much larger than the size of typical avalanche debris particles. Enough data are now available to indicate trends in characterisitics of both wet and d r y avalanches. They reveal that mechanical properties of wet and dry flowing snow may d i f f e r considerably. Flow characteristics and impact pressures, together with supporting field observations, indicate some important trends relevant to the choice of avalanche type f o r design impact pressures and maximum runout distances. CHARACTERISTICS O F OBSERVATION SITE AND AVALANCHES
The observations were obtained in the Tupper No 1 avalanche path a t Rogers Pass in the Selkirk Mountains of British Columbia. I t is characterized by a vertical drop of about 1000 m and a long straight gully about 25 m wide and 500 m long a t a n incline of 35 deg. Pressure observations were made a t the end of the
gully. T h e avalanches occurred naturally, starting in several locations high on the mountainside. For the five years of the study (1979-1984) 95 avalanches were observed in this path, but only 12 (Table 1) yielded pressure information.
Of the 95 avalanches, 55% contained d r y debris with a n average density of particles in the deposit of 330 kg/m3; 24% had moist debris with average particle density 420 kg/m3, and 21% had wet debris with average particle density 500 kg/m3. The overall average debris particle density was 390 kg/m3, ranging f r o m 180 kg/m3 (small d r y avalanche) to 590 kg/m3 (wet avalanche). Field measurements showed dry debris with densities as high as 500 kg/m3, indicating that the physical situation is not so simple as these averages seem to imply. The average avalanche mass for the 95 deposits was 1200 t, with a range f r o m 10 t (minumum put in records) to 14 000 t. T h e total recorded mass of snow debris per year averaged about 23 000 t.
INSTRUMENTATION
The experimental set-up comprised two types of load cell mounted on steel frames high enough o n the mountain to prevent avalanche debris from collecting there. A series of five load cells mounted on a 5.2-m high steel f r a m e yielded information about avalanche flow characteristics. These cells had 645-mm2 disc-shaped surfaces and were placed a t various heights f r o m 0.2 to 2 m above ground or snow surface, perpendicular to the flow direction (Schaerer and Salway 1980).
In order to obtain realistic impact pressures and to assess the effects of loading surface size a large circular aluminum plate (diameter 0.5 m, thickness 25.4 mm) was installed on a steel frame next to the small cell pressure stand in December 1979. The bottom of the plate, which was originally supported by four load cells with 110 kN force capacity each, was about 0.2 m above the ground. The cells were very soon destroyed by a high pressure event, but the plate was re-installed in November 1980 with three large load cells mounted i n a n equilateral triangle pattern (side dimension 0.154 m) around the centre of the plate. The cells a r e Strainsert universal flat load cells with a maximum capacity of 110 kN each and a natural frequency of about 2000 H z with the loading plate installed. The cells have a f l a t frequency response in the range 0
-
100 Hz with the loading plate installed, and were statically calibrated i n the laboratory using the same electronic recording system as was used in the field.Reliability of the large plate system and eccentricity of avalanche loading were checked by recording the output of each cell separately and the output of all three cells tied together. Actual records from avalanches showed a maximum difference of 20% between average pressures determined by adding pressures from the individual cells and values obtained from the three tied together. This analysis also showed that the pressures appeared to be applied fairly evenly over the face of the plate.
The speeds of avalanches approaching the pressure stands were estimated using geophones coupled to the rock in the gully a t depths of about 0.15 m below the
McClung and Schaerer: Snow and avalanch impact pressures
ground surface. These geophones were placed a t distances varying from about 85 m above the pressure stands to beside them. Salway (1978) and Schaerer and Salway (1980) have discussed the method and equipment in detail and presented typical records.
It should be recognized that the speeds of
avalanche debris determined by geophones are difficult to quantify and are subject to inaccuracy because a n avalanche can excite them before they have been
reached. If a geophone has high sensitivity, the
accuracy is very poor. Another problem is that snow often collects higher up in the gully, making it impossible to detect avalanches late i n the winter. The geophone data, therefore, are not accurate enough to provide information on velocity surges inside a debris wave or avalanche. Normally, information about frontal speeds only is provided. The speed information in this paper therefore refers to frontal speed of avalanches or
frontal speeds of waves in avalanches f o r those
avalanches that consist of a series of waves of debris. Geophones placed high in the gully were also used to trigger the tape recording system before the pressure stands had been struck. This triggering system was discussed by Salway (1978) and by ~ c h a e r e r and Salway (1 980).
RESULTS
Small cells
Small cells with a n effective loading surface of only 645 mm2 d o not provide accurate estimates of impact pressures, because the typical particle size in avalanche flows usually exceeds the size of the loading
surface. The small cells can provide descriptive
information about frequency of particle impact and therefore of flow density as a function of depth if i t is assumed that all debris particles have the same density.
Field measurements indicate that this is a good
assumption. Data from the small cells a r e illustrated in Figures 1 and 2 respectively, f o r avalanches with moist and wet debris in the deposits. Figure 1 shows a trend, observed in all pressure records to date, that implies
F i g l a . Pressure record for avalanche with moist debris in the deposit from a small cell 0.70 m above the ground (Avalanche 81 - 12-09, No.1).
Fig.lb. Pressure record for avalanche with moist debris in the deposit from a small cell 0.45 m above the ground (Avalanche 81
-
12-09, No.1).increase of flow density with depth through the flow a t the measuring site.
Figure 2 shows gaps in the debris flow, also
mentioned by Salway (1978) and by Schaerer and Salway (1980). This effect i s evident i n data reported from France (Bon Mardion and others 1974) for both wet and
dry avalanches. For the Rogers
Pass
data. however, thiswave-like behaviour is the exception rather than the
rule.
The small cells may also provide information about the depth of the dense, flowing core of the avalanche. Above the core only sporadic hits are recorded by the impact cells. For the Tupper 1 path the results to date
show that this flow height varies from 0.5 to 2 m, f o r
I
estimated speeds of 8 to 47 m/s. Schaerer and Salway I
(1980) have given estimates of flow depths f o r
avalanches occurring a t this site.
Field observations show that dry avalanches a r e often enveloped by snow dust clouds consisting of small material suspended by turbulent eddies, whereas wet avalanches d o not display such characteristics. This, coupled with data from the small cells, indicates that most large, dry avalanches have a structure that could be described by terminology used in sediment transport theory: a dense flowing core (bed load) enveloped by a powder cloud (suspended load). T o date, data have been obtained from only one avalanche that might be termed
a powder avalanche i n which the bed load is absent.
Field experience shows that this type of avalanche may reach fairly high speeds but is much less serious in terms of its destructive effects. Data presented f o r the powder avalanche i n the next section support these field observations.
Large Plate
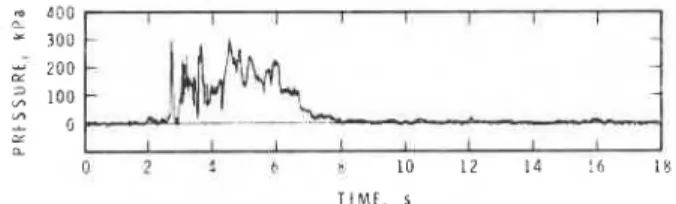
Figures 3 and 4 show pressure records f o r avalanches with, respectively, moist a n d wet debris in their deposits. Together with Figures 1 and 2, they illustrate the effect of loading surface size. Analysis of
T I M F , r
Fig.3. Pressure record for avalanche with moist debris in the deposit, from the large plate; compare with record in Fig.1 (Avalanche 8 1-12-09, No.1).
the pressure peaks shows that the large plate gives lower values by roughly an order of magnitude for the wet avalanche and in the order of a factor of 2 for the moist avalanche. Other data indicate that the size effect is usually more pronounced for wet avalanches, possibly owing to larger particles on average. For comparison, Figure 5 is a
pressure record of
a
dry avalanche.Figures 3, 4 and 5 also show features typical of dry and wet avalanches observed in data from the small cells. Generally, dry avalanches have higher peak pressures and relatively lower average pressures, resulting in higher levels of fluctuation than for wet avalanches. There is a tendency for the highest pressures to occur in the first half of the
Fig.2. Pressure record from wet avalanche recorded by a small cell 0.70 m above the ground, showing wave-like behaviour (Avalanche 80-12-26, No.4).
McCIung and Schaerer: Snow and avalanch impact pressures
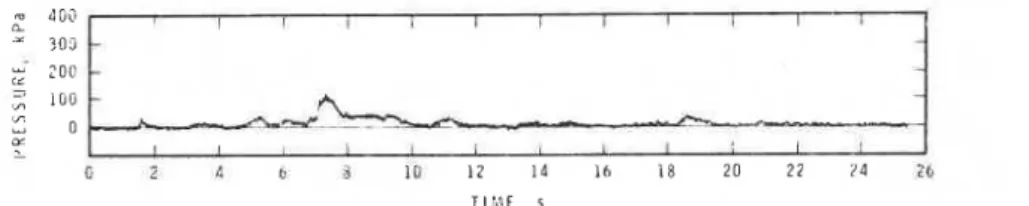
Fig 4. Pressure record for wet avalanche, from the large plate; compare with record in Fig. 2 (Avalanche 82-01-2, No.1).
flow. Records with the highest pressure at the head of the flow are the exception rather than the rule. There is a considerable variation of position of peak pressure in the
data records collected to date.
:.
LL
:
:
:
;
I
4011All data from the large plate are listed in Table 1, 2
:
2000
- -
with values for maximum or peak pressures PM (Pa), p.
average pressure
7
(Pa), speed V (m/s), density of deposit a 3 2 4 h 8 10 1 2 14 l a I 8 pD (kg/m3), free water content of debris (D = dry, M = T I I I 1 E . smoist. W = wet). and mass of deposit Itonnes). Values of
P, and
F
wer; determined by euminationof
calibrated Fig.5. Pressure record for dry the largeprintouts of the pressure records. Peak pressure was defined plate (Avalanche 82-01-23. No.1). as the highest instantaneous value of the pressure [ s ~ i k e
height) in-the pressure record. Values of
H
were determinedTABLE 1. OBSERVATIONS FROM THE LARGE PLATE, ROGERS PASS, TUPPER NO. 1.
-
p~ P
v
"
D content of Mass Durationdebris
Date No. (10-'~a) ( I O - ~ P ~ ) (m/s) (kg/ms) (t) (s)
Flowing avalanches 37 22 500-550 51 22 500-550 36 19 500-550 14 12 500-550 16 12 500-550 38 12 500-550 19 14 500-550 11 11 500-550 8 9 500-550 6 8 500-550 33
-
460 24-
400 33 26 400 68-
-
7 8 32 360 76 30 350 28-
400 53 34 410 40 24 440 Powder avalanche 19 47-
McClung and Schaerer: Snow and avalanch impact pressures
by using a calibrated planimeter. Estimates of pD were made using a standard Swiss snow density kit (500 cms). Gaps in the data indicate that it was not possible to determine values.
The deposit mass is the most difficult parameter to measure at Tupper No 1 because there are often several avalanches per day and it is not always possible to determine which pressure record belongs to which of the deposits. The frontal speeds, V, are given for either individual debris waves or for the avalanche as a whole if the debris came only in one wave. A debris wave was considered finished when the pressure dropped to zero on the large plate. Several avalanches showed a wave-like structure, but it was only possible to determine speeds of individual waves for two of them (80-12-26 No 4, and 81-02-16, NO 1).
One avalanche (80-12-26. No I) is considered to be a powder avalanche. The data from this event imply that it did not have a dense flowing core like the other avalanches. Figure 6 shows the pressure record, which displays a wave-like character.
T I M E , r
Fig.6. Pressure record for powder avalanche, from the large plate (Avalanche 80- 12-26, No.1).
Table I also lists the duration of the avalanche waves or avalanche pressure record in seconds. This together with estimates of V makes it possible to specify the spatial length of the avalanches or debris waves.
ANALYSIS O F RESULTS FROM T H E LARGE PLATE AND COMPARISON WITH SIMPLE THEORY
Some quantitative trends in the data for flowing avalanches (Table 1) may be specified, but it is not yet possible to supply quantitative estimates of design loads since the data are limited. I t is a virtual certainty that the actual numbers in the analysis will change as more data become available. The maximum or peak pressures recorded a r e associated with impacts of solid debris chunks, peaks in density fluctuations, velocity surges, or a combination of these effects. As no information is available on velocity surges, the data were analysed based upon density fluctuations a t constant speed, but this is only a n approximation a t best.
Maximum pressures, PM, were analysed assuming that they are due to impacts of solid debris chunks or regimes of high flow density. Mellor (1968) gave a simple onedimensional theory that accounts f o r compaction of snow upon impact by compressibility effects resulting from upstream propagation of a plastic wave. Using mass and momentum conservation across the wave front:
where PM is in Pa and V is in m/s. Equation 1 neglects elastic response so that i t represents only a simple approximation to the actual physical situation. For analysis pi is taken as initial flow density and pf as final density of compressed snow. A maximum value of pf = 600 kg/ms is assumed, based upon observations of Wakahama and Sato (1977) that fracturing will occur rather than higher densities for loading rates resulting from speeds typical of avalanches. The ratio pM/V2 may be interpreted as a n effective flow density, pe, which would have a n approximate upper limit of 600 kg/m3 for dry snow.
A regression analysis of the data yields the best f i t f o r a power law with PM as a function of V rather than a polynomial expansion in V. This analysis gives:
with R' = 0.717 and S = 0.626, where R is the correlation coefficient and S is standard error. This indicates a trend towards agreement with Equation 1. The range of speed, V, is 8 to 34 m/s (Table l), with a mean of about 19 m/s.
The values of pM/V2 have a mean of 334 kg/m3 and a standard deviation of 225 kg/ms, with a range of 148 to 792 kg/ms. The mean of these data implies a flow density f o r peak pressures (pi) of about 215 kg/m3 using Equation 1 and pf = 600 kg/ms. If the density of the particles, pD, is taken as the mean f o r observed Tupper No 1 debris (390 kg/m3), these results imply that the volume fraction of solids is near 55%, which is in approximate agreement with the recommendation of Schaerer (1973) that peak pressures may be approximated by ~ ~ - 1 / 2 ~ ~ ~ ~ . An alternate picture is that a solid chunk covered about half the area of the plate. Mellor's theory is actually more appropriate f o r this case, but the concept of pressure breaks down because the effective area over which the load is applied varies with the size of the chunk, which is unknown.
For the analysis, flowing avalanches with dry and moist debris were grouped together and classified as dry. Field observations show that in most cases avalanches with moist debris began as dry ones a n d that the particles became moist by the time they reached the runout zone, presumably as a result of heat generated by collisions with other particles and by friction on the sliding surface over which the avalanche runs. This classification is supported by the similarity of pressure records f o r moist a n d dry avalanches in a number of cases.
For the data in Table 1, dry and moist avalanches phi
have a n average value
-
= 450 kg/ms and wetv2
PM
avalanches a n average value
-
= 290 kg/ms,v2
indicating a trend towards higher peak pressures f o r dry avalanches a t a given speed.
For average pressure, a simple fluid dynamic model is adopted. The average pressure, P, f o r fluidized debris impinging on the plate is approximated as:
where
7
is average flow density and CD is a drag coefficient. For a circular plate with a free edge in turbulent fluid flow experimental data show CD is 1.1 f o r Reynolds numbers between lo3 and lo6 (Addison 1956). For laminar flow experimental data show that CD is a function of Reynolds number and that it is greater than the value for turbulent flow. Prandtl and Tietjens (1934) list a n experimental value of 2 as typical of laminar flow.A regression analysis of the data shows that i t is described better by a power law than by a polynomial expression, i.e:
with R~ = 0.834 and S = 0.338. If CD is assumed constant, as data show in the fluid turbulent case, Equation 4 implies
-
1P - -
f l
This result will change when more data become available, but i t shows a physically appealing trend towards a decrease in flow density and hence a n
McClurzg and Schaerer: Snow and avalanch impact pressures
increase in flow height with increasing speed. This is consistent with field observations.
The data in Table I show that the ratio ?/V2 has a mean of 97 kg/m3 and a standard deviation of 50 kg/m3. With CD taken as 1.1 this implies a n average flow density near 170 kg/m3. If pq is taken near the
mean of Rogers Pass data, this Implies an average volume fraction of solids in excess of 40% f o r wet and dry avalanches together.
Moist a n d dry-avalanche data taken together show a mean value of p/V2 = 70 kg/m3, which may be compared with a n average value 107 kg/m3 f o r wet avalanches. This indicates that average flow densities a r e higher f o r wet avalanches if CD is assumed constant. For a value of C = 1.1, average flow densities would be near 125 kg/$ a n d 195 kg/m3 for dry and wet avalanches, respectively. For Tupper No. 1, from 1979 to 1984, estimates f o r 95 avalanches show a n average value pD = 360 kg/m3 for dry and moist debris and pD = 500 kg/m3 f o r wet debris, to give estimated average volume fraction of near 35% and 40%, respectively. Caution has to be used in accepting these values; if the flows contain such high debris concentrations, the mechanical properties can d i f f e r substantially from the turbulent fluid dynamic modelling.
The pressure record of the small, dry powder avalanche on 80-12-26 (Figure 6) has a peak pressure of 125 kPa and a n average pressure of 19 kPa, with a speed of 47 m/s. For these data pM/V2 = 57 kg/m3 and Y/V2 = 8.6 kg/m3. Both values fall f a r below the averages of-450 kg/m3 and 70 kg/m3 f o r dry avalanches. The value p/V2 implies a n average flow density near 15 kg/m3 f o r CD = 1.1 and the volume fraction of solids may be less than 10% if debris particle densities are taken near estimated values f o r small d r y avalanches.
Taken together, the data in Table 1 show t k t power law regression gives the best f i t of PM versus P. This relation is
with R 2 = 0.716 and S = 0.571. Dry and moist avalanches together have a n average value of
P,/F
=6.0,-whereas wet avalanches show a n average value PM/P = 2.6. This supports the descriptive analysis of the pressure records and again indicates that average flow densities a r e lower for dry and moist avalanches for a given speed.
COMPARISON WITH OTHER DATA
Perla and others (1978) provided data from impact pressure drop tests as a function of snow density, using snow cylinders and an impact area of 0.196 m2 on a circular aluminum plate of the same thickness as was used in the present tests. Tests were made f o r snow densities in the range 252 kg/m3 to 658 kg/m3, with a mean near 385 kg/m2 a t one speed of 13.5 m/s.
A regression analysis of the data shows that a polynomial f i t with pi is better than power law regression and gives the following relation:
with R 2 = 0.876 and S = 0.0688.
If one assumes that peaks a r e due to single chunks, then f o r pi = pD = 390 kg/m3, a mean value for Tupper No. 1 debris, this estimate yields P,/v* =
408 kg/m3, which is greater than but close to the field measured value of 334 kg/m3. The drop tests should give higher values than the actual measurements in the avalanches because the effective area of load transfer for a debris chunk would generally be less than the plate area, yielding lower pressure estimates if peaks were due to single debris chunks smaller than 0.5 m diameter. Also, the drop tests provide data f o r perpendicular loading near the plate center, whereas field data may represent off-center loading a t different directions on the plate. This analysis provides some,
although not conclusive, support for the concept that peaks a r e due to single chunks. Mellor's (1968) theory would be much more appropriate to apply to the solid impact data of Perla and others (1978) than f o r avalanche flows if fluidized debris had a volume fraction of solids of 50% or less. Application of Equation 1 with pf = 600 kg/m3 indicates that the compaction term is a correction of only a few percent for the mean value of the data of Perla and others (1978).
Another important data set is provided from France by Eybert-Berard and others (1978). These data consist of field measurements of PM. P and V for 15 avalanches, of which only two are wet avalanches. For comparison V is taken as measured avalanche frontal speed, and if that is not available V is taken as the maximum speed estimated from a flowmeter mounted on the pressure stand. The French data are for speeds of 10-28 m/s with a mean near 17 m/s. The debris density showed a mean value pD = 327 kg/m3, with a range of 165-600 kg/m3, which is somewhat lower on the average than the Rogers Pass data, perhaps owing to a greater proportion of dry avalanches.
The regression analysis showed that a polynomial function is the best fit for PM as a function of V (R2 = 0.643). For comparison, a power law regression gives P ~ - v ~ . ~ ~ with R2 = 0.609 and S = 0.330 indicating weaker speed dependence than the Rogers Pass data. The mean value of P,/v* is 340 kg/m3 with a standard deviation of 149 kg/ms ~ndicating slightly higher values than Rogers Pass data, although average debris density is less. The agreement for this parameter is quite good and it is also consistent with the solid impact of Perla and others (1978).
A regression analysis of data f o r average pressures showed that a polynomial expansion gave the best f i t (R2 = 0.643 f o r terms-up to v 2 ) . For comparison, power law regression shows P
-
v'."
with R 2 = 0.517 a n d S= 0.404, indicating again a weaker speed dependence as compared to the Rogers Pass data.
The ratio
?/v2
f o r French data has a mean near 150 kg/m3 and a standard deviation 62 kg/m3. These values a r e higher than those determined f o r the Rogers Pass data by a factor of roughly 2. Application of the fluid dynamic equation 3 to this value yields the conclusion thatii
x CD = 300 kg/m3. For a drag coefficient near 1 f o r the French experiments (Eybert-Berard a n d others 1978) the conclusion is that average implied flow densities approximate the average value of pD f o r this set of avalanches or that the volume fraction of solids is about 100%. One possible explanation for this physically unrealistic result is the size effect. T h e pressure sensors in the French experiments are 0.1m
i n diameter, implying a sensor area 25 times smaller than those used to obtain the Rogers Pass data. The concept of average pressure would lose meaning as the sensor size approaches the debris particle size.For the French data the mean value of the ratio
P,/P
is near 2.3. This mean value would approach the Rogers Pass mean value f o r dry avalanches if the values ofP
a r e higher by a factor of 2 for the French data due perhaps to size effects.Kotlyakov and others (1977) observed avalanche impact pressures using steel cones that penetrated aluminum plates. No concurrent speed data were given. This type of measurement system is known to provide estimates of impact pressures that are too high (e.g. Shimizu and others 1980). Kotlyakov and others (1977) recommend that maximum and average pressures be estimated by P, = 4.8 P,V' and
P
= 2pDV2, which is about five to ten times the estimates, based on the Rogers Pass data, the data of Perla and others (1978) o r the data of Eybert-Berard and others (1978). The implied ratioP,/P
is approximately that of the French data, however.CONCLUSIONS AND DISCUSSION
Pressure and speed data on flowing avalanches measured a t Rogers Pass, B.C., indicate the following trends:
McClung and Schaerer: Snow and avalanch impact pressures
1. Data from small cells consistently show that
frequency of particle impacts and hence flow density increase through the cross-section of wet and dry avalanches from the top of the flow to the sliding surface.
2. A size effect is clearly evident when data from small cells a r e compared with those obtained with a large pressure plate. An order of magnitude higher pressures were observed f o r peak pressures measured with small cells.
3. Dry avalanches generally have higher values of
peak pressure and a higher ratio of
peak-to-average pressure, by about a factor of 2,
than wet avalanches. The values p M / v 2 and
F/v'
indicate reasonable values of peak and average flow densities with volume fraction of solids estimated to be 55% or less.
Measurements from a high-speed powder avalanche
indicate values of p M / v 2 and P/V' much lower than
those f o r flowing avalanches, with a n average flow density a n order of magnitude lower than that f o r dry flowing avalanches and a volume fraction of solids near 10%.
Comparison of Rogers Pass data with other data indicates the following:
1 . T h e ratio p M / v 2 is slightly lower than that determined by Eybert-Berard a n d others (1978) from avalanche observations and slightly lower than the solid impact experiments of Perla and others (1978), as would be expected f r o m the physical differences. The supposition that peak pressures are due to high density clusters of particles or large particle impacts is supported.
2. Comparison of
T/v2
indicates that the Rogers Passdata give values about half those of Eybert-Berard and others (1978). This may be due to the size effect f o r the measurement gauges.
The Rogers Pass data show a tendency f o r dry, flowing avalanches to have the highest peak pressures and highest speeds. There are indications also that dry avalanches have lower average flow densities. This latter may be due to lower friction a t the ground. Field experience confirms these trends in the measurements. This leads to the conclusion that dry, flowing avalanches must be considered as the basis for design impact forces on structures and estimates of maximum avalanche runout distances. I t is believed, however, that more data are needed to permit specifying accurate design loads.
With respect to design peak pressures, i t may be of
interest that application of Mellor's (1968) theory
(Equation 1) coupled with Wakahama and Sato's (1977) maximum density estimate implies that p M / v 2 should have a n approximate upper limit near 600 kg/ms, the value for dry, close-packed snow, assuming that a block
of snow covers the entire plate and strikes it
perpendicularly. The mean and standard deviations of
P,/v' imply that the 95% confidence limit of the data is 700 kg/m3 f o r Rogers Pass and 570 kg/m3 f o r the data of Eybert-Berard and others, respectively, assuming Gaussian distributions. The actual data have higher ranges, but this could be due to particle size greater than the sensor size, experimental errors, or water-soaked dense snow. Similar conclusions follow from analysis of the data of Perla and others (1978).
Although enough data are now available to
indicate trends i n flow characteristics and impact pressures for flowing avalanches, more are needed to enable design loads to be specified with a good degree of confidence.
for their co-operation and support. This paper is a contribution from the Division of Building Research, National Research Council of Canada, and is published with the approval of the Director of the Division.
ACKNOWLEDGEMENTS
The authors wish to thank Paul Anhorn and Brant Benum f o r assistance with the field measurements and the Superintendent and Staff of Glacier National Park
REFERENCES
Addison H 1956 A treatise on applied hydraulics.
.London, Chapman and Hall
Bon Mardion G, Coche G, Eybert-Berard A, Jourdan P,
Perroud P, Rey L 1974 Mesures dynamiques dans
l'avalanche. Premiers resultats experimentaux. Note
CENGIASP No 74-01. Communication prksentee a la
rkunion d e la Section de Glaciologic de la Socikte
Hydrotechnique d e France, Paris, les 7 el 8 Mars 1974
Eybert-Berard A, Perroud P, Brugnot
G,
Mura R , ReyL 1978 Mesures dynamiques dans l'avalanche.
Resultats experimentaux d u col d u Lautaret (1972-78).
Comptes rendus: Deuxi2me Recontre Internationale sur la
Neige et les Avalanches, Grenoble. France: 203-212
Kotlyakov V M, Rzhevskiy R N, Samolov V
A 1977 The dynamics of avalanching i n the
Khibins. Journal of Glaciology 19(81): 431439
Mellor M 1968 Avalanches. Cold Regions Science and
Engineering. Part 111. Section A-3. US Army CRREL,
Hanover, N.H.
Perla R , Beck T , Banner J 1978 Impact force of snow.
Ottawa, Environment Canada, Inland Waters Directorate. National Hydrology Research Institute (NHRI Paper 2).
Prandtl L, Tietjens 0 G 1934 Applied hydro- and
aeromechanics. New York, Dover Publications
Salway A 1978 A seismic a n d pressure transducer
system for monitoring velocities and impact pressures of snow avalanches. Arctic and Alpine Research lO(4): 769-774
Schaerer P A 1973 Observations of avalanche impact
pressures. In Advances in North American Avalanche
Technology: 1972 Symposium. US Dept. Agriculture.
Forest Service, General Technical Report RM-3, FI
Collins. Colorado: 51 -54
Schaerer P A, Salway A 1980 Seismic and impact
monitoring of flowing avalanches. Journal o f
Glaciology 26(94): 179-187
Shimizu H, Huzoika T, Akitaya
E.
Narita H, NakagawaM, Kawada K 1980 A study on high speed
avalanches in the Kurobe canyon, Japan. Journal of
Glaciology 26(94): 141
-
151Wakahama G, Sato A 1977 Propagation of a plastic
wave in snow. Journal of Glaciology 19(81): 175-183