Publisher’s version / Version de l'éditeur:
Vous avez des questions? Nous pouvons vous aider. Pour communiquer directement avec un auteur, consultez la
première page de la revue dans laquelle son article a été publié afin de trouver ses coordonnées. Si vous n’arrivez pas à les repérer, communiquez avec nous à [email protected].
Questions? Contact the NRC Publications Archive team at
[email protected]. If you wish to email the authors directly, please see the first page of the publication for their contact information.
https://publications-cnrc.canada.ca/fra/droits
L’accès à ce site Web et l’utilisation de son contenu sont assujettis aux conditions présentées dans le site LISEZ CES CONDITIONS ATTENTIVEMENT AVANT D’UTILISER CE SITE WEB.
Journal of the Acoustical Society of America, 77, 3, pp. 1250-1252, 1985-03
READ THESE TERMS AND CONDITIONS CAREFULLY BEFORE USING THIS WEBSITE. https://nrc-publications.canada.ca/eng/copyright
NRC Publications Archive Record / Notice des Archives des publications du CNRC :
https://nrc-publications.canada.ca/eng/view/object/?id=3634ec9c-d324-43f9-8131-d4bb55bc8973 https://publications-cnrc.canada.ca/fra/voir/objet/?id=3634ec9c-d324-43f9-8131-d4bb55bc8973
NRC Publications Archive
Archives des publications du CNRC
This publication could be one of several versions: author’s original, accepted manuscript or the publisher’s version. / La version de cette publication peut être l’une des suivantes : la version prépublication de l’auteur, la version acceptée du manuscrit ou la version de l’éditeur.
Access and use of this website and the material on it are subject to the Terms and Conditions set forth at
Interlaboratory variability in the determination of sound power
Ser
TIEL K:
N21d
National Research
Conseil national
c. 2BZDG
I
Division of
Division des
-
--
Building Research
recherches en bdtiment
Interlabom tory Variability in the
Determination of Sound Power
by R.E. Halliwell
Reprinted from
Journal of the Acoustical Society of America
Volume 77,
No. 3, March 1983
p. 1250- 1252 (DBR Paper No. 1298)
Price $1.75
NRCC 24688
La puissance du son dlune source de rgfbrence a St6 mesurge cjans un c e r t a i n nombre de laboratoires au Canada e t aux
Etats-Unis, en u t i l i s a n t
l e
d m e gquipement e t la &me source. La v a r i a b i l i t g des & s u l t a t s indique des d i f f 6rences d'un,.lrerlaooratory variability in the determination of sound power
INT
I . Halliwell
onal Research Counc da, Division of Building Research, Ottawa, , Ontario, 1 Canada KIA OR6
(Received 9 September 1984; accepted for publication 24 November 1984)
Sound power measurements of a reference sound source were made at a number of laboratories in Canada and the United States. The same reference source and the same measurement equipment were used in all cases. The variability of the results reflects differences in the laboratories. PACS numbers: 43.50.Cb, 43.50.Yw, 43.85.Fm
'RODUCl 'ION
A recent rouna robln on sound absorption measure-
ments' in which the same sample and measurement equip- ment were taken to a number of laboratories in Canada and the United States also provided an opportunity for sound power measurements to be made on the same source in a number of different reverberation rooms. Any differences in the measured levels should reflect the variations in the geom- etry, absorption, or diffuser configuration of the reverbera- tion rooms.
I. MEASUREMENT PROCEDURE
level in the room. The microphones, 1/2-in. B & K type 4149, have a flat response in a free field. To provide correct sound pressure levels in a reverberant field, a correction was applied as a function of frequency to give the random inci- dence response. The absolute sound pressure level was ob- tained by the use of a B & K 4230 calibrator. Sound pressure levels were measured for six positions of the source (except in Laboratory E); reverberation times were then used with the mean sound levels to obtain the mean sound power level and the standard deviation about the mean. The sources were positioned at least 1.5 m from any reflecting surface, other than the floor, and at least 1.8 m apart.
ration tin surement
n the reve
The sound power levels were corrected for the air tern-
The direct for detemining sound power as de-
perature but not for the barometric pressure. There is a pas-
fined in ANSI S1.3 1- 198O2 was followed, allowing the empty
sible of
-
0.2 dB due t~ possible changes in room reverbesorption mea!
la previously determined for the ab- pressure. The relative humidity was monitored to ensure it s to be used.
remained constant during the measurement period. To obtaii rberation times, the room was excited
with four loudspeakers, each driven with an independent noise source. Sound decays were collected in 1/3-oct bands from 80-5000 Hz using a real time analyzer interfaced to a minicomputer. This system provided simultaneous level measurements on all 19 bands every 1/16 s. For each of the eight microphones, the average of 20 decays was obtained using the decay curve averaging procedure described by Chu.' The reverberation times were calculated from a least- squares straight line fit to the top 25 dB of decay for each band from the average decay curves and then averaged over the eight microphones. This procedure is described in detail in Ref. 1. The sound pressure levels from an ILG reference sound source were measured on each of the eight micro- phones with a 32-s integration time, corrected for any micro- phone calibration, and then averaged to get the mean sound
II. PARTICIPATING LABORATORIES
Nine laboratories in Canada and the United States par- ticipated in this round robin. Details of the reverberation rooms are given in Table I. All of the rooms were rectangular except one; it had five walls, although they were vertical and met both floor and ceiling at right angles. Four of the rooms did not have rotating diffusers and one did not have fixed diffusers.
Ill. RESULTS AND DISCUSSION
The mean sound power levels for each laboratory, the overall mean sound power level, and the overall standard deviation are given in Table I1 and plotted in Fig. 1. The mean sound power and standard deviation for each labomto-
TABLE I. Participating laboratories.
Volume Surface Floor Fixed diffuser Rotating diffuser Total diff
Laboratory . (m3) area (m2) area (m2) area (m2) area (m2) m a (0
TABLE 11. Sound power levels. Frequen C'" m Sigma 80 71.9 73.7 73.8 73.7 73.4 70.4 70.8 73.2 72.4 1.3 100 73.6 75.1 73.5 72.4 74.7 73.2 73.5 74.3 73.7 0.8 125 74.6 76.3 75.5 74.3 75.2 75.5 75.1 75.9 75.0 0.7 160 76.0 76.2 75.8 74.8 74.7 74.7 75.2 76.1 75.3 0.6 200 76.0 76.6 75.0 75.7 75.0 74.6 74.9 75.0 74.9 76.4 75.3 0.7 250 75.9 76.6 75.5 76.2 75.9 75.8 75.8 75.8 76.0 76.5 75.9 0.3 315 76.6 76.9 76.1 76.4 76.1 76.0 75.9 75.9 76.4 76.9 76.3 0.4 400 76.0 76.8 75.7 76.4 76.0 75.7 75.6 75.7 76.1 76.5 76.0 0.4 500 75.9 76.7 75.8 76.3 76.0 75.7 75.4 75.7 76.1 76.2 75.9 0.4 630 75.7 76.5 75.4 75.8 75.6 75.4 75.1 75.3 75.7 75.8 75.6 0.3 800 75.5 76.0 75.1 75.7 75.4 75.2 75.0 75.1 75.4 75.5 75.4 0.3 1000 75.9 76.3 75.3 76.0 75.7 75.5 75.3 75.3 75.7 75.7 75.7 0.3, 1250 76.1 76.6 75.8 76.3 76.0 75.8 75.6 75.6 76.1 76.0 76.0 0.3 1600 76.1 76.5 75.8 76.3 76.1 75.9 75.6 75.7 76.1 76.1 76.0 0.2 2000 76.1 76.5 75.7 76.0 76.0 75.8 75.5 75.5 76.0 76.0 75.9 0.3 2500 75.7 76.5 75.3 75.9 75.7 75.4 75.1 75.1 75.6 76.0 75.5 0.4 3150 75.6 76.4 75.1 75.6 75.5 75.3 75.0 75.0 75.5 76. 4000 75.2 76.4 74.7 75.0 75.0 75.0 74.6 74.6 75.0 76.( 5000 75.1 76.1 74.4 75.1 75.0 75.0 74.6 74.5 75.1 75.. Number of positions 2b 6 6 4 6 6 6 6 6 6
-
-
"Levels obtained using the ILG belonging to Laboratory C. These data are not used in calculating the mean and sigma.
Due to an error, some of the data from this laboratory were lost, thus the mean given is for only two positions. The standard dev.,..,.. ,..,,n in Fig. 2 is from a subsequent measurement using the same ILG reference source but different instrumentation.
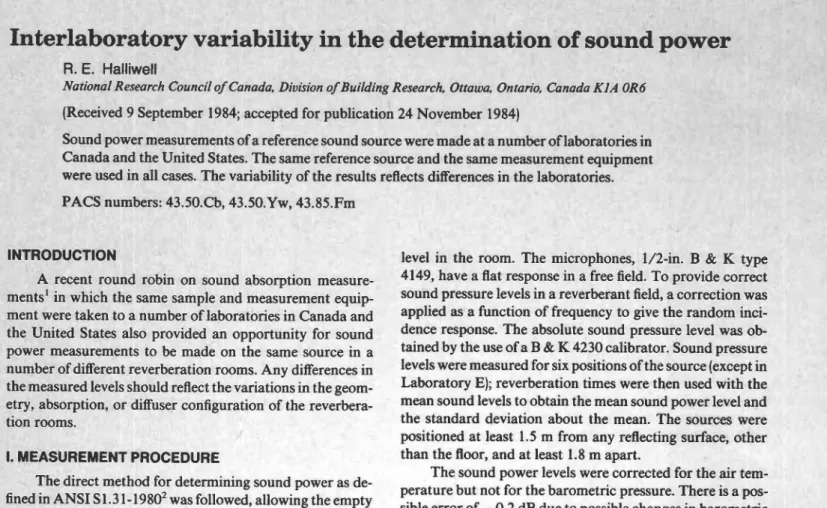
ry, plotted as deviations from the overall mean, are shown in Fig. 2, and the standard deviation about the mean for each laboratory is shown in Fig. 3.
The sound power measured for the ILG source at Labo- ratory C is higher than the overall mean. This would suggest that there is a signature associated with a particular room geometry, particularly at low frequency. The increased level and standard deviation at high f'requencies found at Labora- tory C are a result of rf contamination of several of the mi- crophone outputs for these bands. It is not clear from the room specifications which parameters are important in de-
THIRD OCTAVE BAND CENTER FREQUENCY. Hz
FIG. I. Mean and standard deviation of sound power for all laboratories.
LAB: E
100 200 500 l k 2k 5k
FREQUENCY. HZ
100 200 500 l k 2k 5k FREQUENCY. Hz
FIG. 2. Mean sound power and standard deviation for each laboratory plot- ted as deviations from the overall mean.
LAB: B
7
LAB: C-
2 LAB: E FREI-
10 200 500 lk 2k 5k JUENCY. Hz LAB: F7
-
B 2 --
\ LAB: G-
i 5 0 - 5-
B 2 - E- \
LAB: H-
0 --
-
Z 0 2 - LAB: I-
100 200 500 l k 2k 5k FREQUENCY. HzFIG. 3. Standard deviation about the mean sound power for each laborato- ry.
terrnining the room signature as there does not appear to be any correlation with room volume, presence of a rotating vane, or presence of fixed diffusers. Although six source lo- cations were used at most of the laboratories, rather than the eight specified in the standard ANSI S 1.3 1
-
1980 to qualify a laboratory for broadband sound power determination, it is clear that all of these rooms would qualify for measuring the sound power levels of broadband sources in the frequency range 100-5 kHz.IV. CONCLUSIONS
The requirements of ANSI S1.31-1980 to qualify a room for performing sound power measurements of broad- band sources is easily met by most reverberation rooms.
There is a small dependence. on room geometry which will only be understood through further careful measure- ments. Although there are differences between the laborato- ries, the small overall standard deviation indicates that the reproducibility of the measurement (in which instrumenta- tion is kept invariant) is quite good.
'R. E. Halliwell, "Inter-Laboratory Variability of Sound Absorption Mea- surement," J. Acoust. Soc. Am. 73, 880 (1983).
2"American National Standard Precision Methods for the Determination of Sound Power Levels of Broad Band Noise Sources in Reverberation Rooms," ANSI S1.31-1980, American Institute of Physics, New York. 'W. T. Chu, "Comparison of Reverberation Measurements Using
Schroeder's Impulse Method and Decay Curve Averaging Method," J. Acoust. Soc. Am. 63, 1944 (1978).
T h i s p a p e r , w h i l e b e i n g d i s t r i b u t e d i n r e p r i n t form by t h e D i v i s i o n of B u i l d i n g R e s e a r c h , remains t h e c o p y r i g h t of t h e o r i g i n a l p u b l i s h e r . It s h o u l d n o t be r e p r o d u c e d i n whole o r i n p a r t w i t h o u t t h e p e r m i s s i o n of t h e p u b l i s h e r . A l i s t of a l l p u b l i c a t i o n s a v a i l a b l e from t h e D i v i s i o n may be o b t a i n e d by w r i t i n g t o t h e P u b l i c a t i o n s S e c t i o n , D i v i s i o n of B u i l d i n g R e s e a r c h , N a t i o n a l R e s e a r c h C o u n c i l of C a n a d a , O t t a w a , O n t a r i o , K l A OR6. C e document e s t d i s t r i b u s s o u s forme de t i r 6 - 3 - p a r t par l a D i v i s i o n d e s r e c h e r c h e s e n bbtiment. Les d r o i t s de r e p r o d u c t i o n s o n t t o u t e f o i s l a p r o p r i 6 t 6 de l ' g d i t e u r o r i g i n a l . C e d o c u m e n t n e p e u t S t r e r e p r o d u i t en t o t a l i t s ou en p a r t i e s a n s l e consentement de l ' d d i t e u t . Une l i s t e d e s p u b l i c a t i o n s d e l a D i v i s i o n p e u t S t r e o b t e n u e en s c r i v a n t