Glob Change Biol. 2020;00:1–13. wileyonlinelibrary.com/journal/gcb
|
1 Received: 6 March 2020|
Accepted: 22 August 2020DOI: 10.1111/gcb.15333
P R I M A R Y R E S E A R C H A R T I C L E
Projecting the continental accumulation of alien species
through to 2050
Hanno Seebens
1| Sven Bacher
2| Tim M. Blackburn
3,4,5| César Capinha
6|
Wayne Dawson
7| Stefan Dullinger
8| Piero Genovesi
5,9,10| Philip E. Hulme
11|
Mark van Kleunen
12,13| Ingolf Kühn
14,15,16| Jonathan M. Jeschke
17,18,19|
Bernd Lenzner
8| Andrew M. Liebhold
20,21| Zarah Pattison
22| Jan Pergl
23|
Petr Pyšek
23,24| Marten Winter
16| Franz Essl
5,81Senckenberg Biodiversity and Climate Research Centre (SBiK-F), Frankfurt am Main, Germany 2Department of Biology, University of Fribourg, Fribourg, Switzerland
3Department of Genetics, Evolution and Environment, Centre for Biodiversity and Environment Research, University College London, London, UK 4Institute of Zoology, Zoological Society of London, London, UK
5Centre for Invasion Biology, Department of Botany and Zoology, Stellenbosch University, Stellenbosch, South Africa
6Centro de Estudos Geográficos, Instituto de Geografia e Ordenamento do Território – IGOT, Universidade de Lisboa, Lisbon, Portugal 7Department of Biosciences, Durham University, Durham, UK
8Department of Botany and Biodiversity Research, University of Vienna, Vienna, Austria 9Institute for Environmental Protection and Research (ISPRA), Rome, Italy
10Chair IUCN Species Survival Commission Invasive Species Specialist Group (ISSG), Rome, Italy 11Bio-Protection Research Centre, Lincoln University, Christchurch, New Zealand
12Ecology, Department of Biology, University of Konstanz, Konstanz, Germany
13Zhejiang Provincial Key Laboratory of Plant Evolutionary Ecology and Conservation, Taizhou University, Taizhou, China 14Department of Community Ecology, Helmholtz Centre for Environmental Research – UFZ, Halle, Germany
15Geobotany and Botanical Garden, Martin Luther University Halle-Wittenberg, Halle, Germany 16German Centre for Integrative Biodiversity Research (iDiv), Halle-Jena-Leipzig, Leipzig, Germany 17Leibniz-Institute of Freshwater Ecology and Inland Fisheries (IGB), Berlin, Germany
18Department of Biology, Chemistry, Pharmacy, Institute of Biology, Freie Universität Berlin, Berlin, Germany 19Berlin-Brandenburg Institute of Advanced Biodiversity Research (BBIB), Berlin, Germany
20USDA Forest Service Northern Research Station, Morgantown, WV, USA
21Faculty of Forestry and Wood Sciences, Czech University of Life Sciences Prague, Praha-Suchdol, Czech Republic 22School of Natural and Environmental Sciences, Newcastle University, Newcastle upon Tyne, UK
23Department of Invasion Ecology, Institute of Botany, Czech Academy of Sciences, Průhonice, Czech Republic 24Department of Ecology, Faculty of Science, Charles University, Prague, Czech Republic
This is an open access article under the terms of the Creative Commons Attribution License, which permits use, distribution and reproduction in any medium, provided the original work is properly cited.
© 2020 The Authors. Global Change Biology published by John Wiley & Sons Ltd Correspondence
Hanno Seebens, Senckenberg Biodiversity and Climate Research Centre (BiK-F), Senckenberganlage 25, 60325 Frankfurt am Main, Germany.
Email: hanno.seebens@senckenberg.de
Abstract
Biological invasions have steadily increased over recent centuries. However, we still lack a clear expectation about future trends in alien species numbers. In particular, we do not know whether alien species will continue to accumulate in regional floras
1 | INTRODUCTION
Humans are increasingly reshaping global biogeography by trans-porting species to regions beyond their natural ranges, where they may become permanent additions to local biota (Meyerson & Mooney, 2007; Sax & Gaines, 2008; Turbelin, Malamud, & Francis, 2017). For the last few centuries, numbers of established alien species have increased in many taxonomic groups, and in most cases, so have the rates of species accumulation (Seebens et al., 2017). These trends in biological invasions have been driven particularly by the intensification of trade and transport (Hulme, 2009), land-use change (Pauchard & Alaback, 2004) and access to new source pools (Seebens et al., 2018). Besides being an outcome of globalization, biological invasions are also considered a major driver of global bio-diversity change (IPBES, 2019; Pyšek et al., 2020) and have become a defining feature of the Anthropocene (Lewis & Maslin, 2015). Thus, knowledge about future developments in alien species dynamics is of great significance for science and society.
Many studies have considered future trends in biological inva-sions, though mostly qualitatively (Sax & Gaines, 2008; Walther et al., 2009) or for a limited number of species, using for instance niche modelling approaches (Bellard et al., 2013). A few studies
provide quantitative projections of future invasion dynamics for vascular plants (Bradley et al., 2012; Knapp, Winter, & Klotz, 2017; Rouget et al., 2016; Seebens et al., 2015), insects (Liebhold, Brockerhoff, & Kimberley, 2017) or marine algae (Seebens, Schwartz, Schupp, & Blasius, 2016) based on changes in environ-mental conditions, dynamics of international trade or assuming a time lag between the actual introduction of species and its subse-quent establishment. These studies are, however, restricted to sin-gle taxonomic groups or regions. A recent global study addressed future trends in threats from alien species in general based on changes in the drivers of biological invasions rather than the dy-namics of alien species themselves (Early et al., 2016). Surprisingly, most previous studies predicting future biological invasions have not considered how alien species numbers have developed over past times (see Knapp et al., 2017; Liebhold et al., 2017; Seebens et al., 2015 for exceptions). Such temporal dynamics are, however, of crucial importance for predictions, as they allow for a general understanding of temporal dynamics as a basis to quantify future dynamics and enable the validation of model results.
The temporal accumulation of alien species varies among taxonomic groups and continents (Seebens et al., 2017). Continents differ in key features relevant to alien species introduction and Funding information
OP RDE, Grant/Award Number: EVA4.0 and CZ.02.1.01/0.0/0.0/16_019/000 0803; Schweizerischer Nationalfonds zur Förderung der Wissenschaftlichen Forschung, Grant/Award Number: 31003A_179491 and 31BD30_184114; Bundesministerium für Bildung und Forschung, Grant/Award Number: 01LC1807A, 01LC1807B and 01LC1807C; Austrian Science Fund, Grant/Award Number: I 4011-B32; Fundação para a Ciência e a Tecnologia, Grant/Award Number: CEECIND/02037/2017,
UIDB/00295/2020 and UIDP/00295/2020; Grantová Agentura České Republiky, Grant/Award Number: 19-28807X; Akademie Věd České Republiky, Grant/ Award Number: RVO 67985939; Deutsche Forschungsgemeinschaft, Grant/Award Number: 264740629, FZT 118, JE 288/9-2 and SE 1891/2-1; USDA Forest Service; Belmont Forum; Open access funding enabled and organized by Projekt DEAL.
and faunas, or whether the pace of accumulation will decrease due to the depletion of native source pools. Here, we apply a new model to simulate future numbers of alien species based on estimated sizes of source pools and dynamics of historical invasions, assuming a continuation of processes in the future as observed in the past (a business-as-usual scenario). We first validated performance of different model versions by con-ducting a back-casting approach, therefore fitting the model to alien species numbers until 1950 and validating predictions on trends from 1950 to 2005. In a second step, we selected the best performing model that provided the most robust predictions to project trajectories of alien species numbers until 2050. Altogether, this resulted in 3,790 stochastic simulation runs for 38 taxon–continent combinations. We provide the first quantitative projections of future trajectories of alien species numbers for seven major taxonomic groups in eight continents, accounting for variation in sam-pling intensity and uncertainty in projections. Overall, established alien species num-bers per continent were predicted to increase from 2005 to 2050 by 36%. Particularly, strong increases were projected for Europe in absolute (+2,543 ± 237 alien species) and relative terms, followed by Temperate Asia (+1,597 ± 197), Northern America (1,484 ± 74) and Southern America (1,391 ± 258). Among individual taxonomic groups, especially strong increases were projected for invertebrates globally. Declining (but still positive) rates were projected only for Australasia. Our projections provide a first baseline for the assessment of future developments of biological invasions, which will help to inform policies to contain the spread of alien species.
K E Y W O R D S
biodiversity, biological invasions, business-as-usual scenario, future predictions, global, modelling, species richness, trends
establishment: these include evolutionary history and isolation (Fridley & Sax, 2014), prehistoric and modern human colonization (Ellis et al., 2013) and the level of past (di Castri, 1989) and cur-rent socio-economic activities that facilitate alien species intro-duction (Dyer et al., 2017) and establishment (Pyšek et al., 2020). Furthermore, the dynamics of important drivers of alien species in-troduction and establishment (e.g. trade, human population density and land-use intensity) exhibit considerable variation among conti-nents in recent history (Ellis et al., 2013). The temporal patterns of alien species accumulation may differ among different taxonomic groups on the same continent, as the importance of the underlying mechanisms (e.g. the relevance of different introduction pathways, environmental and habitat characteristics) may vary substantially (Essl et al., 2015). While we are beginning to understand the de-terminants of current numbers and rates of alien species invasions across space and taxa, comprehensive attempts to analyse and proj-ect future dynamics of alien species accumulations across multiple continents and taxonomic groups are largely missing.
Here, we present the first global and cross-taxonomic quan-titative projections of alien species numbers for major biogeo-graphical regions (hereafter described as ‘continents’) through to 2050. The projections and their evaluation are based on the re-cently established and freely available Alien Species First Records Database (Seebens et al., 2017, 2018). We present a new model-ling approach to simulate alien species numbers on continents for different taxonomic groups based on observed long-term historic trends. We developed a modelling approach without the consider-ation of driver dynamics to be able to apply the same method to all taxonomic groups on all continents considered here. This im-plies that we assume a continuation of processes in the future as observed in the past. In line with well-known scenario exercises (IPBES, 2016; IPCC, 2014), this can be considered as a business-as-usual scenario. We parameterized and evaluated different model versions by reconstructing the dynamics of alien species numbers between 1950 and 2005. Subsequently, we applied the model to project trends in alien species accumulation for seven taxonomic groups on eight continents up to 2050.
2 | MATERIALS AND METHODS
2.1 | First-records database
The analysis was based on the Alien Species First Records data-base (Seebens et al., 2017, 2018), which contains first records of alien species that have become established—that is, forming perma-nent self-sustaining populations (Blackburn et al., 2011)—in one or more mainland or island regions. The regions largely correspond to countries; however, large islands administered politically by a main-land country, but located in biogeographically distinct locations or with a particularly high number of samples are considered as dif-ferent regions. Each region was assigned to one of eight continents (Antarctica was excluded due to a very low number of first records)
following the classification of the Taxonomic Database Working Group (TDWG) World Geographical Scheme for Recording Plant Distributions Version 2.0 (https://www.tdwg.org/stand ards/wgsrp d/) for region delineation (Figure S1). The first-records database is de-scribed in detail in Seebens et al. (2017), was subsequently extended and revised (Seebens et al., 2018) and is available online (https://doi. org/10.5281/zenodo.3690748).
We used first records up to the year 2005, as more recent data have been shown to be affected by delays in reporting alien spe-cies records into databases (Muñoz-Mas & García-Berthou, 2020; Seebens et al., 2017). We focused on seven major taxonomic groups with the largest number of first records (>1,000), resulting in a data-set of 45,531 first records of 15,628 established alien species across 271 regions worldwide. In this final dataset, most first records are for vascular plants (54% of all records), followed by arthropods other than crustaceans (for simplicity called ‘arthropods’ hereafter, 28%), birds (6%), fishes (4%), mammals (3%), molluscs (2%) and crustaceans (2%). The geographical distribution of first records is biased towards Europe (38% of all first records), followed by Northern America (16%), Australasia (15%), Southern America (9%), Temperate Asia (9%), Africa (6%), Pacific Islands (5%) and Tropical Asia (2%; Figure S2).
Besides the total number of first records, we additionally ex-tracted the earliest first record of each alien species on a continent. Those species that appeared for the very first time on a continent as alien are called ‘emerging alien species’ here. This is in contrast to Seebens et al. (2018) where emerging alien species were defined at the global scale. Thus, in the present study, each alien species was considered an emerging alien species at its very first occurrence on a continent. We use the term ‘all alien species’ to refer to the total set of first records, which includes repeated first records of the same species on the same continent (and of which emerging alien species are a subset).
Long-term dynamics and invasion patterns of alien species may be different for aquatic and terrestrial habitats (Cox & Lima, 2006; Essl et al., 2020). To assess these potential differences, we distinguished between aquatic and terrestrial species. Sensible comparisons be-tween aquatic and terrestrial habitats could only be done for large species groups with members characterized as being either aquatic or terrestrial, which applied only to vascular plants and insects in our dataset. The habitats of aquatic insects have been identified at the family level, whereas those for aquatic plant species have been identi-fied at the species level. Aquatic insects were defined as those species that have at least one developmental stage in water, whereas aquatic plants were defined as species that normally grow to maturity with at least some photosynthetic organs permanently on (floating) or under (submerged) standing or flowing water. Thus, riparian species found only at the margins of waterbodies were not considered as aquatic.
2.2 | Overview of the modelling approach
In what follows, we use the terms ‘prediction’ and ‘simulation’ to de-scribe model output in general and ‘projection’ for trends in future
dynamics, which in our case refers to the time after 2005. Our model estimates changes in the number of emerging alien species over time. More precisely, the model simulates the years of first record of alien populations that have been recorded as established in the region. This implies that the model does not cover dynamics of intro-duction, establishment or detection before the actual first record. For instance, local population dynamics, Allee effects or time lags cannot be considered in our approach. Simulations are based on two input variables: the size of source pools (i.e. the ‘candidate species pools’, see below) and the first-record rates of all alien species (i.e. the number of first records per year). Thus, projections can be con-sidered as extrapolations of alien species first records constrained by the finite size of source pools.
The ‘candidate species pool’ represents a pool of species, which have the potential to become an alien species on the respective con-tinent. It does not necessarily include all species native outside the respective continent, because not all species are likely to become alien somewhere. Characteristics of the candidate species pool such as size or abundance distribution are unknown. However, knowledge about the candidate species pools is essential for the quantification of future dynamics, as the finite size of these pools constrains the total number of emerging alien species and thus provides an upper limit to alien species numbers (Liebhold et al., 2017). Here, we esti-mated the size of candidate species pools as follows: The candidate species pools are specific for each combination of a continent and a taxonomic group. The species pool has size X, which may be either
constant or variable in time t, denoted then as Xt. Initially, X is
un-known and thus estimated from observed long-term trends of emerg-ing and all alien species numbers followemerg-ing Seebens et al. (2018). The basic idea behind this approach is that the size of the candidate spe-cies pool is a strong determinant of the rate by which emerging alien species are sampled from this pool. For instance, when repeatedly sampling individuals from a large candidate species pool, chances are high to select a new species not already present in the focal region. This would result in high rates of emerging alien species even after a long time (more precisely, after many draws from the pool) and a slow depletion of the candidate species pool. In contrast, only a few species could establish when the candidate species pool is small, which would then result in a rapid decline in the rate of emerging alien species (fast depletion). Similar approaches have been applied to estimate the total number of species on Earth from time series of species descriptions (Mora, Tittensor, Adl, Simpson, & Worm, 2011). Abundances of the species in the source pool are assumed to be log-normally distributed with a fixed mean (log µ = 0) and variance
(log σ2 = 1), which is a common way to describe the distribution of
species abundances in natural communities (Bell, 2000; Liebhold et al., 2017). Modifying these parameter values has little influence on projections (Figure S3) as long as the full range of the distribution is sampled, as we do here.
The model simulates changes in the number of emerging alien species of a certain taxonomic group on a continent by randomly selecting individuals from the candidate species pool with size X at a rate in time t, which was obtained from the observed first-record
rates of all alien species of that group, continent and time. The se-lected individuals are then added to the alien species pool of the particular continent and taxonomic group. Once the simulation fin-ishes in the year 2005, the rate of emerging alien species can be computed for the full time series. The model can be considered as a process of resampling with replacement, where individuals are ran-domly selected from a log-normal distribution of X species. The only
parameter of the basic model is X. In a refined model version, Xt was
allowed to change in time. For simplicity, Xt was considered to be a
stepwise linear function of moderate complexity, but high flexibil-ity. We selected a function with three linear segments of indepen-dent slopes, which has proven to capture observed dynamics very well (Seebens et al., 2018). The flexibility of such a function is much higher compared to, for example, exponential functions as it covers shapes ranging from constant to linear, near-exponential and various other nonlinear forms. Another advantage is that the final shape of the function is determined by the data and the fitting process (see below) rather than pre-defined by the user. Both slopes and position of inflection points along t were estimated by model fitting. The use of three linear segments with a fixed start and end date requires knowledge about the timing of two inflection points and four size
values, which altogether resulted in six parameters describing Xt for
the refined model version.
2.3 | Modelling steps
In brief, our approach consists of the following data manipulation and modelling steps (Figure 1): (1) correction of first records to ac-count for temporal variation in sampling intensity; (2) identification of the rate of emerging alien species from the first-records dataset; (3) fitting the model to the observed rates of emerging alien species, thereby estimating the size of candidate species pools; (4) future ex-trapolation of model input variables, namely the estimated sizes of candidate species pools and the first-record rates and (5) projection of the accumulation of emerging alien species constrained by the size of the candidate species pools. As steps 1 and 3 include sto-chastic elements (see below), all modelling steps 1–5 were repeated 100 times for each taxon–continent combination; this allowed us to explore the full range of predicted future trajectories and to assess the uncertainty inherent in these projections. In more detail, the procedure applied was as follows:
2.3.1 | Step 1 (bias-correction)
Time series of first records are likely biased by temporal variation in sampling intensity, which may affect model predictions. As docu-mentation of sampling intensity is largely missing, we define a time series of likely changes in sampling intensity, which can be used to explore variations of results due to a temporal sampling bias follow-ing Seebens et al. (2018). In this approach, the year of each first re-cord was shifted to earlier years acre-cording to a presumed rere-cording
lag between actual introduction and recording of that species in a given region. Due to missing data, we had to make assumptions about the temporal development of sampling intensity: we assumed that the size of the time lag is a direct result of sampling intensity, and we further assumed an exponentially increasing sampling inten-sity since 1500 ranging from a time lag of a maximum of 100 years at 1500 to 5 years in 2005 due to increasing effort and efficiency in sampling species. This assumption is related to findings of studies on native species description rates (Appeltans et al., 2012; Costello, Wilson, & Houlding, 2012). This correction resulted in a shift in the year of first record to earlier dates and in a less steep increase in rates of first records in recent decades (Figure S4), and thus provides more conservative predictions of future trajectories. Even without actual data on changes in sampling intensities, we believe such a bias-correction provides more realistic results compared to an ap-proach ignoring temporal biases.
2.3.2 | Step 2 (extraction of first-record rates)
From the bias-corrected time series, first records of emerging alien species were extracted. The numbers of records were aggregated over time intervals of 5 years to reduce the number of gaps and the amount of noise, which is particularly problematic for taxonomic groups with few records such as mammals. The number of first re-cords per time interval is referred to as the first-record rate.2.3.3 | Step 3 (estimation of source pools)
The model was fitted to the observed time series of emerging alien species. This was done by modifying X in such a way that predictions best match the observed changes in rates of emerging alien species. Deviations between observed and simulated rates were measured using the root mean squared error (RSME) between observed and predicted values. Finding the optimal value of X, which minimized RSME, was done using the Nelder–Mead optimization algorithm im-plemented in the R software package ‘optim’ (R Core Team, 2019).
For the model version considering temporal changes in Xt, the six
pa-rameters defining Xt were estimated. As it is a stochastic model, only
the mean of 100 single runs was used for fitting to avoid extreme trajectories. Further details of the modelling approach can be found in Seebens et al. (2018).
2.3.4 | Step 4 (extrapolation of model input
variables)
For projections, input variables of the model (i.e. the size of the candidate species pool and the first-record rate of all alien species)
have to be extrapolated into the range of projections. As X or Xt
are either constant or linear functions, the size of the candidate species pool was linearly extrapolated (Figure S5), while a more flexible approach was used for the first-record rates to capture their more dynamic nature. We tested six different approaches for extrapolation, which were fitted to each taxon–continent
com-bination separately: a linear [y = a + bt], exponential [y = aebt],
power law [y = atb], saturating [y = a(1 − e−bt)], sigmoidal [y = a(xb/
(tb + cb))] or hump-shaped (Weibull) [a(c/b*(t/b)c e−(t/b)c)] function
of first-record rates y with time t, and a, b and c denoting param-eters defining the shape and scale of the functions (see Figure S5 for examples). The functions were fitted individually to the time series of first-record rates from 1800 until 1950 or 2005, respec-tively, using the Nelder–Mead optimization algorithm. The best function was determined as the one with the lowest AIC. In some cases, different functions performed equally well with a ΔAIC < 5 (Burnham & Anderson, 2004). To avoid unnecessary complexity and less robust projections, simpler functions were preferred over more complex ones in these cases. That is, from the set of best-fitting functions (ΔAIC < 5), linear functions were preferred over nonlinear ones and monotonic functions over hump-shaped ones. In addition, we restricted the choice of the hump-shaped func-tion to cases where the time series of first-record rates declined in recent times to avoid false predictions of declining trends due to noisy data. This was tested by additionally fitting a linear func-tion to the last five time intervals (1985–2005). If the slope of this
F I G U R E 1 Overview of data
manipulation and modelling steps to generate future projections (left column) and brief explanations (right column). The applied approach consists of two parts, involving historic and future dynamics, respectively. In each part, time series of model input variables were first generated (indicated by ‘Data’) and then used for modelling (‘Model’) to either fit the model to historic time series and determine parameter values (‘Historic’) or to calculate future projections (‘Future’)
fit was negative, the selection of the hump-shaped function was accepted. In cases where the slope was positive, the second-best fit was chosen. The simplest of the best-fitting functions thus ob-tained was used for extrapolation.
2.3.5 | Step 5 (calculation of quantitative
projections)
Projections of emerging alien species accumulation were obtained by performing simulations using the candidate species pool sizes ob-tained from step 3 and the extrapolated time series of first records and candidate species pool sizes from step 4. Since the first-records database does not include first records for all established alien spe-cies, we applied a correction for spatial variation in sampling inten-sity among continents using available databases of established alien species as references (vascular plants, Pyšek et al., 2017; birds, Dyer et al., 2017; fishes, Froese & Pauly, 2015; no databases were avail-able for mammals or invertebrates). This was done by applying a cor-rection factor to simulation results to achieve the same number of emerging alien species on the respective continent in the year 2005 as reported by these databases.
These five steps were repeated 100 times for each taxon–conti-nent combination to assess the uncertainty inherent in this approach. Projections were sensitive to a low number of first records and a low variation in the time series (e.g. constant time series). We therefore defined a set of minimum requirements of a time series to run the model: Projections were only calculated for first-record time series of taxon–continent combinations with at least 15 values, a mean of at least two emerging alien species per time interval and a standard deviation of at least one. Consequently, projections could only be accomplished for 38 out of 56 taxon–continent combinations (68%). Due to data limitations, analyses of dynamics on subsets of the data, such as islands-mainland and aquatic–terrestrial comparisons, could only be conducted at the global scale.
2.4 | Predicting invasion dynamics
To validate model predictions, we performed a back-casting exercise to evaluate model performances by predicting historical dynamics of emerging alien species numbers. For this purpose, the model was fitted to emerging alien species numbers until 1950 to predict spe-cies numbers for the period 1950–2005. Observed and predicted numbers during the latter time period were compared to assess the reliability of predictions. The comparison was done using the rela-tive absolute error (RAE). The RAE is a measure of improvement of the model compared to using a single constant rather than the more complex model, with a value of 1 or larger denoting no improvement. In addition, the reliability of predictions for each taxon–continent combination was assessed. We excluded taxon–continent combina-tions with an RAE > 1 for the calculation of projeccombina-tions. We made an exception to this rule for mammals, as the observed first-record
rates of mammals changed at around 1950 from an increasing to a decreasing trend, which is difficult to predict using our approach. Note that an RAE of 1 does not necessarily imply poor model perfor-mance as the trends in emerging alien species numbers can be close to constant.
In a sensitivity analysis, we tested different versions of the model and data-manipulation steps of varying complexity to as-sess their influences on model results. As mentioned above, the size of the candidate species pool was either set constant or al-lowed to vary through time. In an alternative approach, first-re-cord rates were assumed to remain constant in the future. For this, we extrapolated the mean value of first-record rates observed during the last 50 years into the future. Furthermore, we tested the influence of different bin sizes (1, 3, 5, 10 and 15 years), used to aggregate first records (step 2), on model results. In the selec-tion of the optimal bin size, we had to find a compromise between the number of observations and the variability of the time series. Using a large bin size of, for example, >10 years would have re-sulted in a low number of observations reducing the chance of convergence of the fit algorithm. In contrast, using a low bin size of, for example, <5 years may result in noisy time series or time series with very low variability (e.g. constant), which are difficult to fit as well. For the selection of the optimal bin size, model per-formance was therefore also assessed by the number of successful model runs, constrained by our minimum requirement for a time series (step 5). Finally, we tested whether bias correction using a linear versus an exponential increase in sampling intensity (see step 1) influenced model results.
After the identification of the model version that best described past observed invasion dynamics, the modelling steps were applied to first-record rates over the whole time series until 2005 to project trajectories of emerging alien species until 2050.
3 | RESULTS
In a sensitivity analysis, we validated the performance of different model versions in our back-casting exercise by predicting emerging alien species numbers during 1950–2005, which revealed that model performance varied considerably among model versions, regions and taxa. For most model versions, only a few taxon–continent combi-nations provided a reasonable performance with an RAE lower than 0.75 (Figure S6). For instance, only 16% of all simulations using the model with a constant candidate species pool and a non-constant ex-trapolation of first-record rates (Figure S6c) reached an RAE < 0.75, while this was the case for 40% of the simulations using the best performing model (Figure S6a). Across all combinations, the poorest performance was obtained for the two model versions assuming a constant candidate species pool size, with a mean RAE of 0.9 ± 0.18 (standard deviation calculated over all taxon–continent combina-tion) and 0.88 ± 0.2, respectively. Allowing for changes in the size of the candidate species pool and a constant extrapolation of first-record rates clearly improved performance (RAE = 0.78 ± 0.22). Best
model performance was obtained when allowing for dynamic (rather than constant) future developments of both candidate species pools and first-record rates (Figure S6a): that is, when the sizes of candi-date species pools were allowed to change in time (increase or de-crease) and first-record rates were predicted using one of the set of different functional forms (linear or nonlinear) described in Section 2 (step 4). In addition, we tested the influence of varying parameter values of the log-normal distribution, which determines the shape of the candidate species pool (step 3), on model performance. Overall, selecting a mean of the distribution of around zero, as done here, provided the best model performance, albeit the differences to other parameter values were low (Figure S3). Furthermore, testing the influ-ence of different bin sizes used to aggregate first records (other than 5 years; step 2) revealed that model performance as well as the num-ber of successful model runs clearly decreased using both smaller bin sizes (1 or 3 years) and larger bin sizes (10 or 15 years; Figure S7). In particular, using bin sizes of 1 year (no aggregation) or 15 years re-sulted in a very low number of successful model runs, which is due to the fact that variability of time series was too low (i.e. constant time series) and/or the number of observations was too low, respectively. Differences in using 5 or 10 year bin sizes were minor and in some cases, model performance even improved using a bin size of 10 years. However, for reasons of consistency, we selected a bin size of 5 years for all model runs as this provided the best compromise across all taxon–continent combinations.
The best model performance was obtained using the model ver-sion with a nonlinear development of candidate species pools, flex-ible extrapolations of first-record rates and a temporal resolution of 5 years (RAE = 0.78 ± 0.22; Figure S6). We removed two taxon– continent combinations (fishes and molluscs in Australasia) with low numbers of successful simulation runs (n < 15). Using this configura-tion, we obtained projections of emerging alien species numbers (i.e. number of earliest first records of species on a continent, see Section 2) through 2050 for a total of 3,790 simulation runs for 38 taxon– continent combinations (99.7 simulations each on average). Model vali-dation revealed that in general consistently good model fits (RAE < 0.5) were obtained for projections for the European continent, vascular plants and to some degree for arthropods, while poorer fits with RAE often between 1 and 0.75 were gained for mammals and birds (Figure 2).
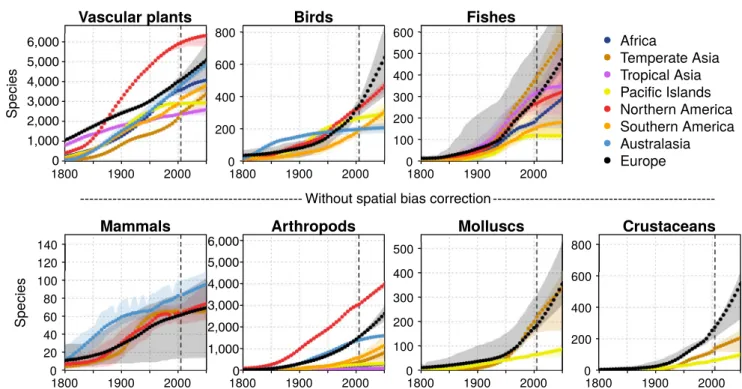
Mean projections of future developments of emerging alien spe-cies numbers roughly fell into three groups: (a) a steep increase, as shown, for instance, for many European trajectories; (b) a low in-crease, as shown for arthropods in Australasia; or (c) saturation, as shown for fishes and vascular plants on Pacific Islands (Figure 3). In general, variation in the mean projections was comparatively low for taxonomic groups with high species numbers, such as vascular plants and arthropods, and high for those with low numbers, such as vertebrates. For mammals in particular, the range of obtained trajectories was large, which indicates a high uncertainty in these projections. To account for large-scale spatial variation in sampling intensity, projections were adjusted to reach the same level of spe-cies numbers as reported in the literature in recent years. This ad-justment, which could only be performed for vascular plants, birds
and fishes due to the lack of comprehensive alien species data for other taxonomic groups, resulted in a more uniform picture for most continents (compare Figure 3 and Figure S8). That is, after account-ing for spatial variation in samplaccount-ing intensities, trajectories for less well-sampled regions such as Tropical Asia increased distinctly and revealed similar shapes of alien species increases as neighbouring regions such as Temperate Asia and the Pacific Islands.
According to our model, numbers of emerging alien species on a continent were predicted to increase from the year 2005 to 2050 by 36% on average but with a large variation across all taxonomic groups and continents (Tables 1 and 2). The total number of emerg-ing alien species on a continent was projected to increase by 1,195 species averaged over projections of those taxonomic groups, which are available for most continents to enable a fair comparison (vascu-lar plants, fishes, birds and arthropods; Table 1). Highest increases can be expected for Europe in both relative and absolute terms (64%, 2,543 ± 237 alien species) followed by Temperate Asia (50%, 1,597 ± 197), Northern America (23%, 1,484 ± 74) and Southern America (49%, 1,391 ± 258). Lowest increases in relative values were projected for Australasia (16%), while in absolute terms this was the case for the Pacific Islands (+132 species). In a more detailed analy-sis, projected relative increases in numbers of emerging alien species
F I G U R E 2 Performance of the best-fitting model for all
taxonomic groups and continents. Performance was tested by parameterizing the model with first records until 1950 to predict dynamics from 1950 to 2005. Model performance was measured using the relative absolute error (RAE) between observed and predicted rates of emerging alien species. Size of bubbles and colours indicate the median RAE averaged over 100 model runs for each combination of taxa and continent. Lower values of RAE denote better model performance. Gaps indicate taxon–continent combinations for which the resulting time series of first records did not fulfil our minimum requirements for simulations (step 5 in Section 2), and thus projections could not be calculated
Mean Africa Asia−T emperate Asia−T ropical A ustralasi a Europe No rt he rn Amer ic a P acific Islands Souther n Amer ic a Mean Arthropods Birds Crustaceans Fishes Mammals Molluscs Vascular plants
<0.25
0.25−0.5
0.5−0.75
1−0.75
RAE:
ranged from 0% (fishes on Pacific Islands and mammals in Temperate Asia) to 117% (arthropods in Temperate Asia; Table 2). Invertebrates showed the highest relative increases. In absolute terms, highest num-bers of alien species among all continents were expected for Europe (for birds, fishes, arthropods, molluscs and crustaceans), Australasia (mammals) and Temperate Asia (vascular plants) by 2050 (Figure 3; Table 2). For arthropods, high increases in absolute terms were also predicted for Northern America. This was not only due to the already high numbers of alien species on these continents but also due to the steep rises in alien species numbers projected up to 2050 (Figure S9).
Predicted trajectories of alien species numbers were surprisingly similar for both mainland and island regions across taxonomic groups (Figure S10). While numbers of predicted alien species were generally higher in mainland regions, those for islands were at a similar magni-tude. Trends in alien species numbers are predicted to show further increases across all taxonomic groups, albeit less clearly for mammals in mainland regions, with a tendency towards steeper increases in mainland regions. The comparison of trajectories in aquatic and ter-restrial habitats for vascular plants and insects revealed that total alien species numbers are much lower in aquatic habitats (Figure S11). Trends of alien species numbers are predicted to distinctly increase further, with higher relative increases predicted for aquatic vascular plants and terrestrial insects. However, due to the lower number of aquatic alien species in these two taxonomic groups, the variation around the mean is very high and predictions for aquatic alien species are less robust compared to those of terrestrial alien species.
To evaluate changes in the dynamics of alien species numbers, we calculated increases over the same period of time (45 years) be-fore and after the end of reported first records (2005). A comparison
F I G U R E 3 Predicted developments of alien species numbers on different continents for seven taxonomic groups until 2050. The dots
represent means of up to 100 model runs, while the full range of all predicted trajectories is indicated by shaded areas. To account for spatial variation in sampling intensity among continents, trajectories are corrected to have the same value of alien species numbers in 2000 as reported in recent publications for vascular plants, birds and fishes. This was not possible for mammals and invertebrates. Uncorrected trajectories are shown in Figure S8. See Section 2 for more information
With spatial bias correction
Without spatial bias correction
1,000 0 2,000 3,000 4,000 5,000 6,000 1,000 0 2,000 3,000 4,000 5,000 6,000
TA B L E 1 Projected relative and absolute increases in emerging
alien species numbers from 2005 to 2050 across taxonomic groups for each continent. Relative increases represent mean relative increases and range of increases across taxonomic groups, while absolute increases denote sums of emerging alien species numbers and standard deviations across taxonomic groups
Continent Relative increase 2005–2050 (%) Absolute increasea 2005–2050 Africa 39 (14, 51) 767 ± 133 Temperate Asia 50 (0, 117) 1,597 ± 197 Tropical Asia 30 (10, 67) 360 ± 78 Australasia 16 (5, 28) 1,286 ± 44 Europe 64 (13, 100) 2,543 ± 237 Northern America 23 (6, 42) 1,484 ± 74 Pacific Islands 21 (0, 56) 132 ± 29 Southern America 49 (16, 99) 1,391 ± 258 Average 36 (0, 117) 1,195 ± 131
aAbsolute increases were calculated only including projections of those
taxonomic groups that were available for most continents (i.e. vascular plants, fishes, birds and arthropods) to avoid biases towards continents with a high number of projections.
of past (1960–2005) and future (2005–2050) increases in alien spe-cies numbers revealed that the rates of emerging alien spespe-cies were projected to accelerate particularly for arthropods worldwide but also for birds (Figure 4). In contrast, rates were projected to decline in the future for mammals and fishes. Among continents, a uniquely accelerating rise in alien species numbers was projected for Europe, where rates of emerging alien species were expected to increase in all taxonomic groups except mammals (Figure 4). In Australasia, pro-jected increases in alien species numbers were consistently lower than in the past, indicating a consistent decline in the rate of emerg-ing alien species.
The sizes of the candidate species pools were predicted to in-crease for all taxa and continents with two exceptions: mammals in Temperate Asia and birds in Australasia (Figure S12). Particularly strong increases since the early 20th century were simulated in nearly all cases. However, the trajectories of the sizes of candidate species pools of individual simulation runs may differ widely (see large bands around the mean in Figure S12). The predicted sizes of candidate species pools ranged from around 800 species of mam-mals to over 100,000 species for arthropods (Figure S12).
4 | DISCUSSION
This study provides the first quantitative estimates of future alien species accumulation trajectories at a global scale, resolved to continents and major taxonomic groups and based on historic in-formation on alien species trends. Our projections indicate that
T A B LE 2 Pr oj ec te d r el at iv e ( % ) i nc re as es i n n um be rs o f e m er gi ng a lie n s pe ci es i n t he y ea rs 2 00 5– 20 50 . V al ue s r ep re se nt m ea ns ov er u p t o 1 00 i nd iv id ua l r un s a nd 0 .0 25 % a nd 0 .9 75 % qu an til es o f 1 00 s im ul at io n r un s i n s qu ar e b ra ck et s. M ea n a bs ol ut e i nc re as es i n a lie n s pe ci es n um be rs t og et he r w ith s ta nd ar d d ev ia tio ns a cr os s i nd iv id ua l s im ul at io n r un s a re p rov id ed i n pa re nt he se s. G re y-sh ad ed n um be rs r ep re se nt s p re di ct io ns c or re ct ed f or s pa tia l v ar ia tio n i n s am pl in g i nt en si ty a m on g c on tin en ts Ta xo n A fri ca Tem per at e A si a Tr op ic al A si a A us tr al as ia Eur op e N or the rn A me ric a Pa ci fic Is la nds Sou th er n A me ric a V as cula r p la nt s 14 [ 4, 1 9] (5 03 ± 11 3) 41 [ 28 , 5 4] (9 87 ± 17 0) 10 [ 0, 1 7] (2 27 ± 67 ) 28 [ 22 , 2 9] (1 ,0 65 ± 41 ) 24 [ 16 , 3 9] (9 97 ± 2 09) 6 [ 1, 7 ] (3 65 ± 3 3) 1 [ 0, 2 ] ( 38 ± 9) 21 [ 18 , 2 5] (6 69 ± 52 ) M am mal s 0 [ 0, 1 0] ( 0 ± 1) 14 [ 2, 2 9] ( 12 ± 3 ) 13 [ 0, 1 67 ] ( 8 ± 9) 16 [ 1, 4 6] ( 10 ± 9) B irds 42 [ 12 , 6 7] (59 ± 2 6) 67 [ 40 , 8 6] (78 ± 1 5) 5 [ 1, 8 ] ( 9 ± 4) 88 [ 61 , 1 20 ] (2 99 ± 5 3) 42 [ 35 , 4 6] (1 38 ± 11 ) 9 [ 2, 2 6] (24 ± 2 2) 60 [ 22 , 6 9] (11 5 ± 2 0) Fi sh es 49 [ 7, 7 3] (96 ± 3 9) 42 [ 12 , 5 6] (1 65 ± 4 8) 10 [ 1, 4 2] (3 1 ± 3 4) 59 [ 52 , 8 7] (17 5 ± 3 2) 20 [ 3, 6 1] (5 4 ± 57 ) 0 [ 0, 0 ] ( 0 ± 0 ) 16 [ 2, 8 6] (2 5 ± 3 9) A rt hr op od s 51 [ 0, 6 9] (1 09 ± 51 ) 11 7 [ 80 , 1 41 ] (4 45 ± 87 ) 35 [ 0, 5 3] (24 ± 13 ) 15 [ 13 , 1 7] (2 12 ± 14 ) 69 [ 65 , 8 4] (1 ,0 72 ± 9 2) 30 [ 29 , 3 2] (9 27 ± 31 ) 26 [ 13 , 3 2] (7 0 ± 17 ) 99 [ 15 , 1 24 ] (5 82 ± 24 9) M oll us cs 53 [ 5, 6 9] (11 6 ± 4 0) 93 [ 69 , 1 31 ] (17 0 ± 31 ) 32 [ 2, 4 3] (2 1 ± 7 ) Cr us tac ea ns 47 [ 27 , 7 1] (6 6 ± 18 ) 10 0 [ 77 , 1 12 ] (27 3 ± 3 4) 56 [ 37 , 8 2] (3 6 ± 8 )
F I G U R E 4 Comparison of observed past (1960–2005) and
projected (2005–2050) increases in alien species numbers for all combinations of continents and taxonomic groups. Values above the 1:1 line indicate a larger increase in alien species numbers projected for the period 2005–2050 than observed between 1960 and 2000, while values below the line denote a lower increase in alien species numbers in the future than observed in the past. Alien species numbers plus one is shown to include zeros in the log–log plot as well. Hence, values at one actually indicate zero change in alien species numbers
Past increases +1 (1960−2005)
Future increases +1 (2005−2050)
1
10
100
1,000
1
10
100
1,000
AfricaTemperate AsiaTropical Asia Pacific Islands Northern America Southern America Australasia Europe Birds Mammals Vascular plants Fishes Arthropods Molluscs Crustaceans
by the mid-21st century there will be distinct increases in alien species numbers particularly for Europe but also for Temperate Asia and Northern America, and for invertebrates in all regions (Table 2). Our results suggest that the observed past trends of biological invasions will continue to accelerate also in the next decades for many taxonomic groups and continents. Likewise, the increases in global candidate species pools in the past are likely to continue into the future, resulting in the emergence of more new alien species.
The highest increases, both in absolute and relative terms, were predicted for Europe, the continent with arguably the longest his-tory of alien species recording. Indeed, comparing the number of first records of alien vascular plants with published alien species numbers (van Kleunen et al., 2015) revealed that first records seem to be most complete for Europe (a total of 3,895 alien vascular plant species for Europe in the first-record database compared to known 4,140 alien vascular plants in this continent, 94%). The proportion is often much lower for other continents, such as Northern America (43% coverage), Temperate Asia (45%) or Africa (26%), which may affect model predictions. Accounting for spatial variation in sam-pling intensities increased alien species numbers particularly for less sampled continents such as Tropical Asia, Southern America and Africa, resulting in a more balanced picture with similar trajectories among continents (compare Figure 3 and Figure S8). Due to the lack of publicly available global databases, this correction could only be applied to alien vascular plants, birds and fishes, but it seems reason-able to expect similar results for other mammals and invertebrates as well. Thus, the low alien species numbers observed, for example, for mammals in Southern America or arthropods in Asia are likely an effect of low sample sizes for those continents and taxonomic groups in the first-records database. True numbers of alien species can be expected to be higher. In contrast to absolute values, relative increases and the shape of the accumulation curves can be regarded as more robust to spatial variation in sampling intensities since even distinct modifications of the first records resulted in only slight mod-ifications of the time series (Figure S4).
The predicted increases in alien species numbers were consis-tent across different geographical units such as islands and mainland regions or across habitats such as aquatic and terrestrial (Figures S10 and S11). For islands, it has been shown that both the total number of alien species and the first-record rate are comparable to those in mainland regions, although usually a bit lower (Seebens et al., 2017), which is confirmed by our projections. This is remarkable as the area of mainland regions in our database is 12 times larger than the area covered by islands. Although alien species are certainly not equally distributed across regions, this imbalance further emphasizes the high numbers of alien species observed on islands compared to mainland regions (Dawson et al., 2017). However, our simulations indicate that the future rise in the number of alien species will be greater for mainland regions than for islands, as a consequence of the observed recent accelerations in mainland alien species numbers (Figure S10). This acceleration will lead to larger differences in num-bers of alien species between islands and mainland regions in the
future. Nevertheless, islands should still be viewed as being particu-larly vulnerable to the introduction of alien species (Russell, Meyer, Holmes, & Pagad, 2017), with major drivers in the future being trade, transport, tourism, land-use changes and climate change (Lenzner et al., 2020).
Absolute and relative accumulation rates provide complemen-tary insights into future trajectories of alien species accumulation (Figure 3; Figure S9). While the former are sensitive to characteris-tics of continents such as geographical size, human population size or economic growth and to the level of recording of alien species (the better historical recording has been and the more records are in our database, the higher the projected absolute number of new established aliens, given a particular trajectory), relative accumula-tions are less sensitive to these confounding factors and provide insights into the relative increases of alien species compared to the status quo. On the other hand, the relative increase in alien spe-cies numbers does not indicate if these increases are based on small or large absolute numbers of alien species currently present in a continent.
The predicted rises in alien species numbers may not come as a surprise, given the continuous increases observed during recent centuries, and the general lack of indications of slowdowns world-wide (Aukema et al., 2010; Blackburn, Dyer, Su, & Cassey, 2015; Liebhold et al., 2017; Muñoz-Mas & García-Berthou, 2020; Seebens et al., 2017). Furthermore, major drivers of alien species introductions and establishment are predicted to rise as well, with clear implications for biological invasions. In a recent expert-based assessment on future dynamics of drivers of biological invasions, trade and transport are assumed to highly likely play a dominant role in driving future increases in alien species numbers, even in the best case scenario considering a human society addressing threats to biodiversity appropriately (Essl et al., 2020). Other driv-ers such as climate change, biodivdriv-ersity loss, land-use change and human migration are assumed to become more dominant in the less optimistic scenario (Essl et al., 2020). All of these drivers are predicted to intensify in the future as well, increasing the proba-bility of introduction and establishment. Countermeasures would need to be put in place to alter these trajectories, and indeed leg-islations relating to alien species have increased in number during recent decades (Turbelin et al., 2017). However, the capacity of most countries to proactively counter the rising tide of alien spe-cies is still poor for most regions worldwide (Early et al., 2016), and it seems likely that this will not change substantially in the near future. Overall, numbers of alien species will very likely increase as predicted by our model.
Projecting alien species accumulation rates into the future is sub-ject to a number of caveats. We have explicitly accounted for several of the most important factors (e.g. the size of the candidate pool of potential alien species, recording bias and some sources of uncer-tainty), but two main limitations remain:
First, the statistical extrapolations assume that the patterns observed for past alien species accumulation will continue in the future. Thus, potential sudden changes in the underlying dynamics
driving alien species introductions were ignored. Examples of such potential changes are the implementation of new mitigation strate-gies (Albert, Lishman, & Saxena, 2013), strengthening of biosecurity regulations such as those now implemented in Australia and New Zealand (Sikes et al., 2018), changes in the global transportation network (e.g. use of the standardised intermodal container since the 1950s, Cudahy, 2006), accelerated climate change and changes in land use (such as increased cultivation of biofuels). The conse-quences of these types of changes for biological invasions are dif-ficult to project, even if the respective drivers could explicitly be incorporated in the model. Assuming a continuation of past dy-namics into the future seemed to be a strong assumption, but it is a standard practice in well-known scenario-based assessments of future dynamics such as for climate change (IPCC, 2014) or biodi-versity loss (IPBES, 2016). Accordingly, our results can be regarded as a business-as-usual scenario, where distinct shifts in underlying drivers are not considered. For such a scenario, we are confident that the calculated trajectories provide a reasonable baseline for the exploration of future alien species accumulations under diverging future scenario assumptions.
Second, projections of alien species numbers were calculated without explicit information on underlying drivers except the size and dynamics of the candidate species pools. Data on many drivers of biological invasions are currently lacking for the period before the last 50–100 years and not consistently available for all taxonomic groups. An integration of driver dynamics into the model would have restricted the analysis to a limited time span and to just a few drivers with sufficient historical data (Early et al., 2016; Seebens et al., 2018), resulting in a higher risk of errors in the overall trends used for extrapolation of first-record rates into the future. In addi-tion, observed trends of emerging alien species numbers during the 20th century were surprisingly stable despite distinct political and socio-economic changes during that time (Figure S4). The reason may be the coarse spatial and temporal resolution of our analysis, which reduces much of the variation observed on finer scales.
Our approach takes advantage of the long time series currently available for first records. We see our model approach as comple-mentary to more mechanistic approaches and as an important base-line for comparison to get confidence in projections of alien species dynamics. However, mechanistic model approaches on a compa-rable scale are currently lacking and still need to be developed. Thus, this study provides an important first step towards thorough quantifications of future dynamics of biological invasions (Lenzner et al., 2019).
5 | CONCLUSIONS
Our analyses indicate that for multiple taxonomic groups on most continents, alien species numbers will continue to increase—often at accelerating rates—in the next three decades (Figures 3 and 4). We show that although the absolute values of predicted alien spe-cies numbers may be uncertain, the continental-scale trends are
robust. The overall results may not be entirely surprising given the continuous increase in alien species numbers observed during the last decades (Seebens et al., 2017), but we here provide a first quantitative baseline for the assessment of how biological invasions may unfold in the future. The availability of such a baseline enables comparisons of scenario projections of potential future dynamics (Lenzner et al., 2019) and can help to direct management strategies efficiently to mitigate the spread of alien species. The predicted in-creases in alien species numbers would be expected to slow down with the application of additional regulations aimed at preventing alien species incursions. Indeed, it has been repeatedly shown that the implementation of targeted biosecurity efforts can reduce the numbers of new alien species becoming established (Bacon, Bacher, & Aebi, 2012; Leung, Springborn, Turner, & Brockerhoff, 2014; Sikes et al., 2018). However, a significant decrease in rates of alien species numbers on a large scale can only be achieved by a coordinated at-tempt across political borders.
ACKNOWLEDGEMENTS
We thank the many colleagues and institutions that contributed data to the Alien Species First Record Database (for a full list, see Seebens et al., 2018). The study was supported by grants from the Deutsche Forschungsgemeinschaft (DFG, grant SE 1891/2-1 to H.S., grant 264740629 to M.v.K., grant JE 288/9-2 to J.M.J. and grant FZT 118 via iDiv to M.W.). H.S., J.M.J., I.K., F.E., S.D. and B.L. re-ceived funding from the BiodivERsA-Belmont Forum Project ‘Alien Scenarios’ (BMBF grant 01LC1807A/B/C, FWF project no I 4011-B32). C.C. was supported by Portuguese National Funds through Fundação para a Ciência e a Tecnologia (CEECIND/02037/2017; UIDB/00295/2020 and UIDP/00295/2020). P.P. and J.P. were sup-ported by EXPRO grant no. 19-28807X (Czech Science Foundation) and long-term research development project RVO 67985939 (The Czech Academy of Sciences). A.M.L. received support from grant EVA4.0, No. CZ.02.1.01/0.0/0.0/16_019/0000803 financed by OP RDE and from the USDA Forest Service. The Invasion Dynamics Network (InDyNet) contributed to this manuscript. S.B. was sup-ported through the 2017–2018 Belmont Forum and BiodivERsA joint call for research proposals, under the BiodivScen ERA-Net COFUND programme and by the Swiss National Science Foundation (grant numbers 31BD30_184114 and 31003A_179491). Open ac-cess funding enabled and organized by Projekt DEAL.
AUTHOR CONTRIBUTION
H.S. designed and implemented the model, conducted the analy-sis and wrote the initial draft of the manuscript together with F.E. Information about aquatic species was provided by Z.P. and A.M.L. All authors contributed to the overall study design and paper writing.
DATA AVAIL ABILIT Y STATEMENT
Data of first records are provided at https://doi.org/10.5281/ zenodo.3690748.
Code availability statement: Computer code to reproduce results of this study is provided at https://doi.org/10.5281/zenodo.3690797.
ORCID
Hanno Seebens https://orcid.org/0000-0001-8993-6419
Sven Bacher https://orcid.org/0000-0001-5147-7165
Tim M. Blackburn https://orcid.org/0000-0003-0152-2663
César Capinha https://orcid.org/0000-0002-0666-9755
Wayne Dawson https://orcid.org/0000-0003-3402-0774
Piero Genovesi https://orcid.org/0000-0002-0262-1420
Philip E. Hulme https://orcid.org/0000-0001-5712-0474
Mark van Kleunen https://orcid.org/0000-0002-2861-3701
Ingolf Kühn https://orcid.org/0000-0003-1691-8249
Jonathan M. Jeschke https://orcid.org/0000-0003-3328-4217
Bernd Lenzner https://orcid.org/0000-0002-2616-3479
Andrew M. Liebhold https://orcid.org/0000-0001-7427-6534
Zarah Pattison https://orcid.org/0000-0002-5243-0876
Jan Pergl https://orcid.org/0000-0002-0045-1974
Petr Pyšek https://orcid.org/0000-0001-8500-442X
Marten Winter https://orcid.org/0000-0002-9593-7300
Franz Essl https://orcid.org/0000-0001-8253-2112
REFERENCES
Albert, R. J., Lishman, J. M., & Saxena, J. R. (2013). Ballast water reg-ulations and the move toward concentration-based numeric dis-charge limits. Ecological Applications, 23(2), 289–300. https://doi. org/10.1890/12-0669.1
Appeltans, W., Ahyong, S. T., Anderson, G., Angel, M. V., Artois, T., Bailly, N., … Costello, M. J. (2012). The magnitude of global marine species diversity. Current Biology, 22(23), 2189–2202. https://doi. org/10.1016/j.cub.2012.09.036
Aukema, J. E., Cullough, D. G. M., Holle, B. V., Liebhold, A. M., Britton, K., & Frankel, S. J. (2010). Historical accumulation of nonindigenous forest pests in the continental United States. BioScience, 60(11), 886–897. https://doi.org/10.1525/bio.2010.60.11.5
Bacon, S. J., Bacher, S., & Aebi, A. (2012). Gaps in border controls are re-lated to quarantine alien insect invasions in Europe. PLoS One, 7(10), e47689. https://doi.org/10.1371/journ al.pone.0047689
Bell, C. (2000). The distribution of abundance in neutral communities. The American Naturalist, 155(5), 606. https://doi.org/10.2307/3078983 Bellard, C., Thuiller, W., Leroy, B., Genovesi, P., Bakkenes, M., &
Courchamp, F. (2013). Will climate change promote future invasions? Global Change Biology, 19(12), 3740–3748. https://doi.org/10.1111/ gcb.12344
Blackburn, T. M., Dyer, E. E., Su, S., & Cassey, P. (2015). Long after the event, or four things we (should) know about bird invasions. Journal of Ornithology, 156(1), 15–25. https://doi.org/10.1007/s1033 6-015-1155-z
Blackburn, T. M., Pyšek, P., Bacher, S., Carlton, J. T., Duncan, R. P., Jarošík, V., … Richardson, D. M. (2011). A proposed unified framework for biological invasions. Trends in Ecology & Evolution, 26(7), 333–339. https://doi.org/10.1016/j.tree.2011.03.023
Bradley, B. A., Blumenthal, D. M., Early, R., Grosholz, E. D., Lawler, J. J., Miller, L. P., … Olden, J. D. (2012). Global change, global trade, and the next wave of plant invasions. Frontiers in Ecology and the Environment, 10(1), 20–28. https://doi.org/10.1890/110145
Burnham, K. P., & Anderson, D. R. (2004). Model selection and inference – A practical information-theoretic approach. Sociological Methods & Research, 33(2), 261–304.
Costello, M. J., Wilson, S., & Houlding, B. (2012). Predicting total global species richness using rates of species description and estimates of taxonomic effort. Systematic Biology, 61(5), 871–883. https://doi. org/10.1093/sysbi o/syr080
Cox, J. G., & Lima, S. L. (2006). Naiveté and an aquatic-terrestrial dichotomy in the effects of introduced predators. Trends in Ecology & Evolution, 21(12), 674–680. https://doi.org/10.1016/j.tree.2006.07.011 Cudahy, B. J. (2006). The containership revolution: Malcom McLean’s
1956 innovation goes global. Transportation Research News, 246, 5–9. Dawson, W., Moser, D., van Kleunen, M., Kreft, H., Pergl, J., Pyšek, P., … Essl, F. (2017). Global hotspots and correlates of alien species rich-ness across taxonomic groups. Nature Ecology & Evolution, 1, 0186. https://doi.org/10.1038/s4155 9-017-0186
di Castri, F. (1989). History of biological invasions with special emphasis on the Old World. In J. A. Drake, H. A. Mooney, F. di Castri, R. H. Groves, F. J. Kruger, M. Rejmánek, & M. Williamson (Eds.), Biological invasions: A global perspective (pp. 1–30). Chichester: John Wiley and Sons.
Dyer, E. E., Cassey, P., Redding, D. W., Collen, B., Franks, V., Gaston, K. J., … Blackburn, T. M. (2017). The global distribution and drivers of alien bird species richness. PLoS Biology, 15(1), e2000942. https:// doi.org/10.1371/journ al.pbio.2000942
Early, R., Bradley, B. A., Dukes, J. S., Lawler, J. J., Olden, J. D., Blumenthal, D. M., … Tatem, A. J. (2016). Global threats from invasive alien species in the twenty-first century and national response capacities. Nature Communications, 7, 12485. https://doi.org/10.1038/ncomm s12485 Ellis, E. C., Kaplan, J. O., Fuller, D. Q., Vavrus, S., Goldewijk, K. K., Verburg,
P. H., … Verburg, P. H. (2013). Used planet: A global history. Proceedings of the National Academy of Sciences of the United States of America, 110(20), 7978–7985. https://doi.org/10.1073/pnas.12172 41110 Essl, F., Bacher, S., Blackburn, T. M., Booy, O., Brundu, G., Brunel, S., …
Jeschke, J. M. (2015). Crossing frontiers in tackling pathways of bio-logical invasions. BioScience, 65(8), 769–782. https://doi.org/10.1093/ biosc i/biv082
Essl, F., Lenzner, B., Bacher, S., Bailey, S., Capinha, C., Daehler, C., … Roura-Pascual, N. (2020). Drivers of future alien species impacts: An expert-based assessment. Global Change Biology, 26(9), 4880–4893. https://doi.org/10.1111/gcb.15199
Fridley, J. D., & Sax, D. F. (2014). The imbalance of nature: Revisiting a Darwinian framework for invasion biology. Global Ecology and Biogeography, 23(11), 1157–1166. https://doi.org/10.1111/geb.12221 Froese, R., & Pauly, D. (Eds). (2015). FishBase. Retrieved from http://
www.Fishb ase.de/
Hulme, P. E. (2009). Trade, transport and trouble: Managing invasive spe-cies pathways in an era of globalization. Journal of Applied Ecology, 46(1), 10–18. https://doi.org/10.1111/j.1365-2664.2008.01600.x IPBES. (2016). Summary for policymakers of the methodological
assess-ment of scenarios and models of biodiversity and ecosystem services of the Intergovernmental Science-Policy Platform on Biodiversity and Ecosystem Services. In V. C. S. Ferrier, K. N. Ninan, P. Leadley, R. Alkemade, L. A. Acosta, H. R. Akçakaya, L. Brotons, W. Cheung, N. H. R. K. A. Harhash, J. Kabubo-Mariara, C. Lundquist, M. Obersteiner, H. Pereira, G. Peterson, R. Pichs-Madruga, & B. W. C. Rondinini (Eds.). Bonn, Germany: Secretariat of the Intergovernmental Science-Policy Platform on Biodiversity and Ecosystem Services.
IPBES. (2019). Summary for policymakers of the global assessment report on biodiversity and ecosystem services of the Intergovernmental Science-Policy Platform on Biodiversity and Ecosystem Services. In S. Díaz, J. Settele, E. S. Brondizio, H. T. Ngo, M. Guèze, J. Agard, & C. N. Zayas (Eds.). Bonn, Germany: IPBES Secretariat.
IPCC. (2014). Climate change 2014: Synthesis report. Contribution of working groups I, II and III to the fifth assessment report of the Intergovernmental Panel on Climate Change. Geneva, Switzerland: IPCC.
Knapp, S., Winter, M., & Klotz, S. (2017). Increasing species richness but decreasing phylogenetic richness and divergence over a 320-year period of urbanization. Journal of Applied Ecology, 54(4), 1152–1160. https://doi.org/10.1111/1365-2664.12826
Lenzner, B., Latombe, G., Capinha, C., Bellard, C., Courchamp, F., Diagne, C., … Essl, F. (2020). What will the future bring for biological invasions