HAL Id: hal-03017379
https://hal.archives-ouvertes.fr/hal-03017379
Submitted on 4 Dec 2020HAL is a multi-disciplinary open access
archive for the deposit and dissemination of sci-entific research documents, whether they are pub-lished or not. The documents may come from teaching and research institutions in France or abroad, or from public or private research centers.
L’archive ouverte pluridisciplinaire HAL, est destinée au dépôt et à la diffusion de documents scientifiques de niveau recherche, publiés ou non, émanant des établissements d’enseignement et de recherche français ou étrangers, des laboratoires publics ou privés.
Type 2 diabetes mellitus metabolic control correlates
with the phenotype of human monocytes and
monocyte-derived macrophages
Monica Valtierra-Alvarado, Julio Enrique Castañeda-Delgado, Sandra Iveth
Ramírez-Talavera, Geanncarlo Lugo-Villarino, Fátima Dueñas-Arteaga, Anahí
Lugo-Sánchez, Mercedes Scarlett Adame-Villalpand, Bruno Rivas-Santiago,
José Enciso-Moreno, Carmen Serrano
To cite this version:
Monica Valtierra-Alvarado, Julio Enrique Castañeda-Delgado, Sandra Iveth Ramírez-Talavera, Gean-ncarlo Lugo-Villarino, Fátima Dueñas-Arteaga, et al.. Type 2 diabetes mellitus metabolic control correlates with the phenotype of human monocytes and monocyte-derived macrophages. Journal of Diabetes and its Complications, Elsevier, 2020, 34 (11), pp.107708. �10.1016/j.jdiacomp.2020.107708�. �hal-03017379�
Journal of Diabetes and Its Complications
TYPE 2 DIABETES MELLITUS METABOLIC CONTROL CORRELATES WITH THE
PHENOTYPE OF HUMAN MONOCYTES AND MONOCYTE-DERIVED
MACROPHAGES
--Manuscript
Draft--Manuscript Number: JDC-D-20-00252
Article Type: Research Paper
Keywords: Diabetes; Monocytes; Macrophages; metabolism; chronic inflammation Corresponding Author: Carmen Judith Serrano, PhD
Instituto Mexicano del Seguro Social Zacatecas, Zacatecas MEXICO
First Author: Monica Alejandra Valtierra-Alvarado, MSci Order of Authors: Monica Alejandra Valtierra-Alvarado, MSci
Julio Enrique Castañeda-Delgado, PhD Sandra Iveth Ramírez-Talavera, MSci Geanncarlo Lugo-Villarino, PhD Fátima Dueñas-Arteaga, MD Anahí Lugo-Sánchez
Mercedes Scarlett Adame-Villalpando Bruno Rivas-Santiago, PhD
José Antonio Enciso-Moreno, PhD Carmen Judith Serrano, PhD
Abstract: AIMS
Monocytes and macrophages express cell-surface markers indicative of their inflammatory and activation status. In this study, we investigated whether these markers are affected or correlated in T2D, non-obese subjects, or glycemic/metabolic control variables. METHODS. Clinical data was recorded, and peripheral blood drawn from T2D patients (n=28) and control subjects (n=27). Isolated monocytes were evaluated by flow cytometry for the expression of CD14, CD16, and the phenotypic markers for the different states of activation spectrum, such as pro-inflammatory (M1) (HLA-DR, CD86), anti-inflammatory/pro-resolving (M2) (CD163, CD206, MERTK, PD-L1) and metabolically-activated (MMe) (CD36, ABCA-1). From a subset of individuals, monocytes-derived macrophages (MDM) were obtained and evaluated for phenotypic markers. A correlation analysis was performed between the clinical variables and the marker expression. RESULTS: The frequency of CD14++CD16- monocytes was lower in T2D patients and it correlates negatively with poor control in glycemic and metabolic variables. T2D monocytes expressed lower levels of HLA-DR, CD86, PD-L1, and CD163, which correlated negatively with poor metabolic control. In MDM from T2D patients, HLA-DR, CD86 and CD163 expression was lower and it inversely correlates with deficient glycemic or metabolic control parameters. CONCLUSION: The
glycemic/metabolic control associated with T2D influences monocyte and MDM phenotypes toward an anti-inflammatory and immune-suppressive phenotype. Suggested Reviewers: Blanca Ines Restrepo, PhD
Principal Investigator, UTHealth Houston blanca.i.restrepo@uth.tmc.edu
leader in the study of comorbidity diabetes and tuberculosis Ahmad Aljada, PhD
Principal Investigator ljadaa@ksau-hs.edu.sa
Research line in immune cell phenotypic in diabetes mellitus
Ana Paula Junqueira-Kipnis, PhD
Principal Investigator, Patologia Tropical e Saúde Pública, Universidade Federal de Goiás, Rua 235, Setor Universitário, Goiânia, Goiás, CEP 74605050 Brazil
ana_kipnis@ufg.br
Research line in immune cell phenotypic in diabetes mellitus and comorbidities
Paseo de la Reforma No. 476, MN OTE, Col. Juárez, Alcaldía Cuauhtémoc, C. P. 06600, CDMX. Tel. (55) 5238 2700, Ext. XXXXX www.imss.gob.mx
DIRECCIÓN DE VINCULACIÓN INSTITUCIONAL Y EVALUACIÓN DE DELEGACIONES
Unidad de Comunicación Social Coordinación Técnica de Difusión
Vivian Fonseca, MD
Tulane University Health Sciences Center, 1415 Tulane Ave,
New Orleans, Louisiana, LA 70112, United States
Zacatecas, Zac., May 15th, 2020
Dear Editor and Editorial staff,
We are excited to submit our manuscript entitled “Type 2 diabetes mellitus metabolic control correlates
with the phenotype of human monocytes and monocyte-derived macrophages” for publication as a
Research Article in the Journal of Diabetes and its Complications.
Human monocyte subsets have been explored in type 2 diabetes (T2D) almost exclusively in subjects with morbid obesity and relatively good glycemic/metabolic control, as well as in subjects receiving mixed or unknown treatments for this disease. Consequently, it has been difficult to dissect the exact contribution of T2D to monocyte biology, without the confounder impact exerted by obesity in the metabolism and immunity. In addition, there is a gap in the characterization of cell-surface markers distinguishing the different activation programs in monocytes and monocyte-derived macrophages (MDM) in the T2D context. This is important because the monocyte/macrophage activation program is influenced by their physiological environment and tightly linked to their functional role in health and disease. In fact, the association between glycemic/metabolic clinical parameters and the activation marker profile in monocytes/macrophages has been scarcely studied.
In this study, using a flow cytometry approach, we assessed the phenotypic markers of monocytes and MDM from a group of non-obese T2D patients, including those from the recently described metabolically
activated program (MMe). We established that, while the frequency of CD14+CD16- monocytes is lower
in T2D patients and it correlates negatively with glycemic and metabolic control, CD14+CD16+ monocytes
correlate negatively with metabolic control. We also found that T2D diminishes the marker expression profile of the pro-inflammatory activation program (M1) of both monocytes and MDM; T2D also reduced the marker expression of the anti-inflammatory activation program (M2) in monocytes and MDM, but it failed to exert changes in those markers associated to the MMe program. In fact, poor metabolic control influenced negatively the expression of HLA-DR, CD86 and CD163 expression in monocytes and MDM. Interestingly, we observed these changes in the monocyte compartment in T2D patients receiving metformin/glibenclamide treatment for diabetes, indicating that the drug treatment does not override the T2D effect in these cells. Collectively, our findings suggest that, instead of establishing a predominant activation program in monocytes and MDM, T2D alters marker expression associated to specific functions that would translate in comorbidity with infectious disease.
Paseo de la Reforma No. 476, MN OTE, Col. Juárez, Alcaldía Cuauhtémoc, C. P. 06600, CDMX. Tel. (55) 5238 2700, Ext. XXXXX www.imss.gob.mx
DIRECCIÓN DE VINCULACIÓN INSTITUCIONAL Y EVALUACIÓN DE DELEGACIONES
Unidad de Comunicación Social Coordinación Técnica de Difusión
We believe that our study is relevant to a wide readership interested in the immune and metabolic response and pathogenesis of T2D. Indeed, this work contributes to a better understanding of how the microenvironment of metabolic diseases alters important immune cells, which could influence T2D pathology. It is our hope that you share our enthusiasm about the pertinence of these findings and suitability to this journal.
Thank you again for your time and consideration. Please let us know if you need more information. Sincerely yours, Carmen Judith Serrano Ph. D. Corresponding author Principal Investigator Unidad de Investigación Biomédica Zacatecas Instituto Mexicano del Seguro Social México carmenyuyu2000@yahoo.com.mx
Highlights
- The frequency of classical monocytes (CM) is lower in monocytes from T2D patients
- Glycemic and metabolic control negatively correlates with CM frequencies
- In T2D, monocytes/MDM show lower M1 and M2 markers expression without changes in MMe
- Poor metabolic control influences HLA-DR, CD86, and CD163 expression (monos and MDM)
TYPE 2 DIABETES MELLITUS METABOLIC CONTROL CORRELATES WITH THE PHENOTYPE OF HUMAN MONOCYTES AND MONOCYTE-DERIVED MACROPHAGES
Valtierra-Alvarado M.A.a,b,g, Castañeda Delgado J.E. c,g, Ramírez-Talavera S.I. a,b,
Lugo-Villarino G.d, Dueñas-Arteaga F.e , Lugo-Sánchez A. a, f, Adame-Villalpando M.S. a, f,
Rivas-Santiago B.a, Enciso-Moreno J.a, Serrano C.J.a *
a Unidad de Investigación Biomédica Zacatecas, Instituto Mexicano del Seguro Social,
México
b Departamento de Inmunología, Centro de Investigación en Ciencias de la Salud y
Biomedicina, Universidad Autónoma de San Luis Potosí (UASLP), México
c Cátedras CONACyT, Consejo Nacional de Ciencia y Tecnología (CONACyT- México),
Unidad de Investigación Biomédica Zacatecas, Instituto Mexicano del Seguro Social. Zacatecas, México
d Institut de Pharmacologie et de Biologie Structurale, Université de Toulouse, CNRS,
UPS, Toulouse, France
e Universidad Autónoma de Zacatecas, Unidad Académica de Medicina Humana y
Ciencias de la Salud, Zacatecas, México
f Universidad Autónoma de Zacatecas, Unidad Académica de Ciencias Químicas,
Zacatecas, México
* Correspondence: Carmen J. Serrano PhD. Unidad de Investigación Biomédica Zacatecas, IMSS. Zacatecas, Zac., México. Interior Alameda No. 45, Zacatecas, Zac., 98000, México. Tel 01 52 (492) 922 6019. carmenyuyu2000@yahoo.com.mx
g These authors contributed equally to this work
ABSTRACT
AIMS: Monocytes and macrophages express cell-surface markers indicative of their inflammatory and activation status. In this study, we investigated whether these markers are affected or correlated in T2D, non-obese subjects, or glycemic/metabolic control variables. METHODS. Clinical data was recorded, and peripheral blood drawn from T2D patients (n=28) and control subjects (n=27). Isolated monocytes were evaluated by flow cytometry for the expression of CD14, CD16, and the phenotypic markers for the different states of activation spectrum, such as pro-inflammatory (M1) (HLA-DR, CD86), anti-inflammatory/pro-resolving (M2) (CD163, CD206, MERTK, PD-L1) and metabolically-activated (MMe) (CD36, ABCA-1). From a subset of individuals, monocytes-derived macrophages (MDM) were obtained and evaluated for phenotypic markers. A correlation analysis was performed between the clinical variables and the marker expression. RESULTS: The
frequency of CD14++CD16- monocytes was lower in T2D patients and it correlates
negatively with poor control in glycemic and metabolic variables. T2D monocytes expressed lower levels of HLA-DR, CD86, PD-L1, and CD163, which correlated negatively with poor metabolic control. In MDM from T2D patients, HLA-DR, CD86 and CD163 expression was lower and it inversely correlates with deficient glycemic or metabolic control parameters. CONCLUSION: The glycemic/metabolic control associated with T2D influences monocyte and MDM phenotypes toward an anti-inflammatory and immune-suppressive phenotype.
KEYWORDS: diabetes, monocytes, macrophages, metabolism, chronic
1. Introduction
Diabetes affects the health and quality of living of individuals, impoverishing societies, and economies. According to the International Diabetes Federation (IDF), diabetes mellitus represents a global epidemic with 463 million adults with the diagnosed disease, 90% being Type 2 diabetes mellitus (T2D) cases. Seventy-nine percent of diabetes patients live in low- and middle-income countries and the estimation for 2045 is a rise to 700 million cases (1). In Mexico, for example, diabetes national prevalence according to reports by IDF in 2019 was 15.2% among people with ages 20-79 years (1).
Monocytes are mononuclear phagocytes generated in the bone marrow and are constantly released into the circulation, forming a heterogeneous population of cells. Given their plastic nature to differentiate into a myriad of dendritic cell (DC) and macrophage subsets, they can exert multiple roles in the immune response including cytokine production, pathogen clearance, antigen presentation, wound healing, and pro/anti-tumoral response (2). Monocytes express many cell-surface markers indicative of their inflammatory and activation status. The expression of CD14, a receptor for bacterial lipopolysaccharides, and CD16, the low-affinity receptor for
immunoglobulin G (Fcγ-III receptor), distinguishes CD14++/CD16- (classical) from
CD14++/CD16+ (intermediate) and CD14+/CD16+ (non-classical) human monocyte
subsets (3). In healthy conditions, classical monocytes constitute the major
population of human monocytes (∼85%) (3). These subsets differ in their chemokine
receptor expression and phagocytic activity; classical CD16- monocytes were
described as the main antimicrobial subset, whereas the two CD16+ monocyte
subsets were linked to antigen processing and presentation, and inflammation (2-5).
As aforementioned, monocytes can replenish macrophages populations in the different organs and tissue depending on the environmental clues. The efficacy of the macrophage response resides in the coordinated expression of key proteins involved in macrophage activation (6); this process is generated by diverse stimuli such as microbial products, damaged cells, activated lymphocytes, or inflammatory
cells leading to diverse activation programs (7, 8). In general, macrophage activation is a broad spectrum mainly characterized by two opposite extremes: the classic (M1, pro-inflammatory) and the alternative (M2, anti-inflammatory/pro-resolving) (9). M1 and M2 macrophages have different transcriptional profiles and perform different functions (10). It is generally accepted that M1 cells highly express the surface markers HLA-DR, CD80, CD86, while the M2 subset expresses CD206, CD163, MERTK, PD-L1. The activation balance M1/M2 influence organ function during an inflammatory process or any other insult such as pathogen invasion. If the infection, for example, is severe enough to affect an organ, macrophages adopt an M1 phenotype to produce TNF-α, IL-1β, IL-12, and IL-23, among others, against the pathogen stimuli. However, if the M1 phase is not tightly regulated, it will then become deleterious causing tissue damage. Therefore, the necessity for the M2 macrophages; these programs counteracts the inflammatory response by secreting high amounts of immunosuppressive IL-10 and TGF-β, contributing to tissue repair and remodeling, and promoting vasculogenesis, therefore restoring tissue homeostasis (6). Recently, a new pro-inflammatory macrophage activation phenotype, the so-called metabolic (MMe), was described in adipose tissue and characterized by the expression of CD36, ABCA1, and PLIN2 (11). It was proposed that metabolic dysfunction leads to a macrophage phenotype functionally distinct from classical activation, suggesting that disease-specific environments drive macrophage inflammation via different mechanisms (11).
Macrophages cells are key players in inducing low-grade chronic inflammation in obesity and the main factor responsible for the pathogenesis of insulin resistance resulting in T2D. Apart from their phagocytic activities, macrophages produce different kinds of signals to induce chronic inflammation, triggering the mobilization of other immune cells into the local inflammatory site, and produce inflammatory cytokines (12). The number of macrophages augments with increasing adiposity (13, 14) and their phenotype diverts from M2 to M1 programs in adipose tissue (13, 15). However, the phenotypic characterization of circulating monocytes, and their potential to differentiate into macrophages, from obese subjects and T2D patients still requires further investigation. An increased proportion of circulating
non-classical and intermediate subsets in human chronic pathologies associated with low-grade inflammation, including obesity has been described (16-19). Poitou and
colleagues (19) measured the frequencies of CD14dimCD16+ and CD14+CD16+,
finding both monocyte subsets increased in obese subjects, with significant
enrichment of the CD14dimCD16+ subpopulation in obese diabetic patients. This work
also demonstrates a major impact of fat mass variations on CD14dimCD16+
monocyte subsets (19). Regarding T2D, frequently associated with obesity, there are a few studies exploring monocyte subsets, finding contradicting results. Diabetics with morbid obesity (OBDM), compared to morbid obese (OB), showed a decrease in classical, with no changes in intermediate or non-classical monocyte subsets (20). By contrast, comparing the same patients groups, another report showed an increase in intermediate and in non-classical monocytes in OBDM subjects (21). On the other hand, T2D patients with no reported BMI, showed a decrease in classical and intermediate monocytes (22), while other authors studying T2D individuals within a wide range of age, presence of complications and different pharmacological treatments for T2D, did not find differences in monocytes subsets (23). Therefore, given the different criteria to define T2D patients and their controls in these studies, it is difficult to compare their results side by side and reach a conclusion about the monocytes subsets associated with diabetes.
In terms of cell-surface markers reflecting monocytes and macrophage activation, Fadini and colleagues (23) report a M1/M2 polarization ratio increased in T2D, as
these patients display a reduction in the relative frequency of M2 markers (CX3CR1+,
CD206+/CD163+), while those belonging to the M1 program (CD68+CCR2+) do not
change compared to controls. In another report, Al Dubayee and colleagues compared the expression of several markers by RT-qPCR in PBMC from T2D patients versus non-obese controls; these patients showed an increase of CD68, IL-6, INOS and TNF (M1 markers), as well as CD36 (MMe marker), accompanied by a reduction of CD163 (M2 marker) (24). A recent report shows the expression of CD86 in OBDM patients is higher in classical, intermediate, and non-classical monocytes, in comparison to OB and lean subjects (20). In summary, the literature
points toward a mixed expression of activation markers in T2D patient blood monocytes.
Human monocyte and macrophage diversity are well-recognized but the biologic and clinical significance of the different subtypes is far from being completely elucidated. This includes the lack of extensive phenotyping (e.g., MMe program) of circulating monocytes from T2D patients, as well as an assessment of their differentiation potential towards macrophages. Besides, most of the reports in the literature about monocyte characterization in T2D patients are done in groups with very dissimilar characteristics (e.g., age, glycemic and metabolic control, obesity degree/BMI, group of comparison), which makes difficult to discriminate the impact of individual anthropometric and clinical/metabolic factors in the frequency of monocyte subsets. Given T2D patients exhibit an extensive spectrum of clinical conditions, to minimize confounders, in the present study these patients and controls were recruited under strict inclusion/exclusion criteria. The phenotype of circulating monocytes and monocyte-derived macrophages (MDM) from these individuals was evaluated by flow cytometry, and the correlation between cell-surface markers frequencies and anthropometric and clinical/metabolic variables was assessed.
2. Subjects
The experimental design of the clinical study was approved by the National Research Committee at Instituto Mexicano del Seguro Social (The Mexican Institute of Social Security, IMSS), which includes a subcommittee for ethical approval (agreement number R-2016-785-049). Informed consent was obtained from all individuals before the enrollment to the study. The control subjects and T2D patients were recruited from the Family Medical Unit No.4, IMSS at Guadalupe, Zacatecas, Mexico, by qualified medical staff. Potential participants according to clinical records were tested for fasting plasma glucose, glycated hemoglobin (HbA1c), uric acid, serum creatinine, triglycerides, total cholesterol, very-low-density lipoprotein (VLDL), low- very-low-density lipoprotein (LDL) and high-very-low-density lipoprotein (HDL), white blood cells (WBC) and Urinalysis. T2D patients had been diagnosed according to American Diabetes Association (ADA) criteria. Individuals included in any group ranged from 30 to 58 years of age, and subjects with any of the following criteria were excluded:
hypothyroidism, alcoholism, smoker, retinopathy, advanced renal failure, neuropathy, infections in any organ, morbid obesity or receiving treatment with insulin, statins and/or immunosuppressant use. For each participant, a sample of whole blood was withdrawn for isolation of cells and blood without anticoagulant to recover serum.
3. Materials and Methods
3.1. Isolation of human monocytes and preparation of monocyte-derived macrophages
Peripheral blood mononuclear cells (PBMC) were obtained by density gradient centrifugation using Lymphoprep (AXIS- SHIELD, Scotland), and analyzed by flow cytometry for phenotypic analysis. For a subset of individuals, monocytes were then purified using negative selection (Miltenyi, USA) and LD MACS magnetic columns (Miltenyi, USA). To prepare MDM, freshly isolated monocytes in RPMI-1640 medium
(Gibco, Life Technologies, USA) were seeded at a density of 1.5 x 10⁶ cells/well in
6-well plates (NEST, China). Monocytes were allowed to adhere 2 hours over cover slides, and then the medium was supplemented at final concentration of 10% autologous serum, 20 ng/ml of macrophage colony-stimulating factor (M-CSF, Miltenyi, USA), 2 mM L-glutamine (Sigma Aldrich, USA), 1% pyruvate (Sigma Aldrich, USA) and 0.1% 2-beta-mercaptoethanol (Gibco Life Technologies, USA). At day 3, the medium was changed, and MDMs were collected using Cell Dissociation buffer (Gibco, USA) and used for phenotypic analysis at day 6 or 7.
3.2. Expression of cell-surface markers in PBMC and MDM
The cell-surface marker expression on monocytes was determined by flow cytometry on PBMC. To avoid nonspecific binding of antibodies, the cells were incubated at 4°C for 15 min with heat-inactivated human serum AB (Sigma Aldrich, USA) (25). The cells were stained for 20 min at 4°C in darkness with the corresponding antibodies, and then the cells were washed with phosphate buffered saline 1X (PBS) and fixed with paraformaldehyde for subsequent acquisition in the FACS Canto II
cytometer (BD Biosciences). For MDM analysis, the viability was determined using Live/Dead Fixable Violet Dead Cell Stain (Invitrogen, USA) for 30 min on ice and darkness, and then the cells were washed with PBS 1X, blocked and stained with antibodies as described above.
For monocytes subset determination, cells were stained with Alexa Fluor 488 anti-CD14 mAb (clone MϕP9; BD, USA) and APC-Cy7 anti-CD16 mAb (clone 3G8; BD, USA). For assessment of the M1 program, we stained with APC anti-HLA-DR mAb (clone G46-6; BD, USA) and, PE-Cy5 anti-CD86 mAb (clone 2331- FUN-1-; BD, USA); for M2 program, PerCP-eFluor 710 anti-CD163 mAb (clone GHI/61; eBioscience, USA), PE anti-MERTK mAb (clone HMER5DS; Invitrogen, USA), APC anti-CD206 mAb (clone 19.2; BD, USA), and PerCP-eFluor 710 anti-CD274 (PD-L1, clone MIH1; eBioscience, USA); and for MMe program, PerCP-eFluor 710 anti-CD36 mAb (clone NL07; eBioscience, USA) and Alexa Fluor 647 anti- ABCA1 mAb (clone HJ1; Novus, USA). The analyses were performed according to the gating strategy shown in supplementary material and FlowJo VX software (BD, USA) was used for cytometry data analysis.
3.3. Statistical analyses
The normality of variables was calculated with Kolmogorov-Smirnov test. Data was compared between healthy subjects and T2D patients using Student t test for normally distributed variables and with Mann-Whitney´s U test for non-normally
distributed variables. Data are expressed as mean standard deviation for normally
distributed data and as the median and interquartile range for non-normally distributed data. Correlation analysis was calculated with Pearson´s correlation coefficient for normal variables and Spearman´s correlation coefficient for non-normal variables. Statistical analysis was performed with GraphPad Prism v.5.0 (GraphPad Software Inc, USA).
4. Results
4.1. Type 2 diabetes patients are different from controls only in the clinical parameters associated with diabetes
An analysis of the clinical characteristics for our T2D group was performed relative to control subjects to avoid variability in the experimental conditions due to differences in clinical features. The comparison of the clinical measurements between T2D patients and healthy subjects is summarized in Table 1. Both groups showed similar age, total cholesterol, and LDL-cholesterol levels. According to inclusion criteria, T2D patients showed higher BMI, glucose, HbA1c, triglycerides, and VLDL values, but lower HDL-cholesterol levels (P < 0.01 for all comparisons). Also, 28.57% in the T2D group presented hypertension, 89.28% received metformin, and 57.14% was treated with glibenclamide; all patients treated with glibenclamide were also treated with metmorfin, without a single subject treated with insulin. Therefore, this analysis of the clinical characteristics reduces the chance to obtain variable experimental results between the studied groups due to inherent differences in clinical features.
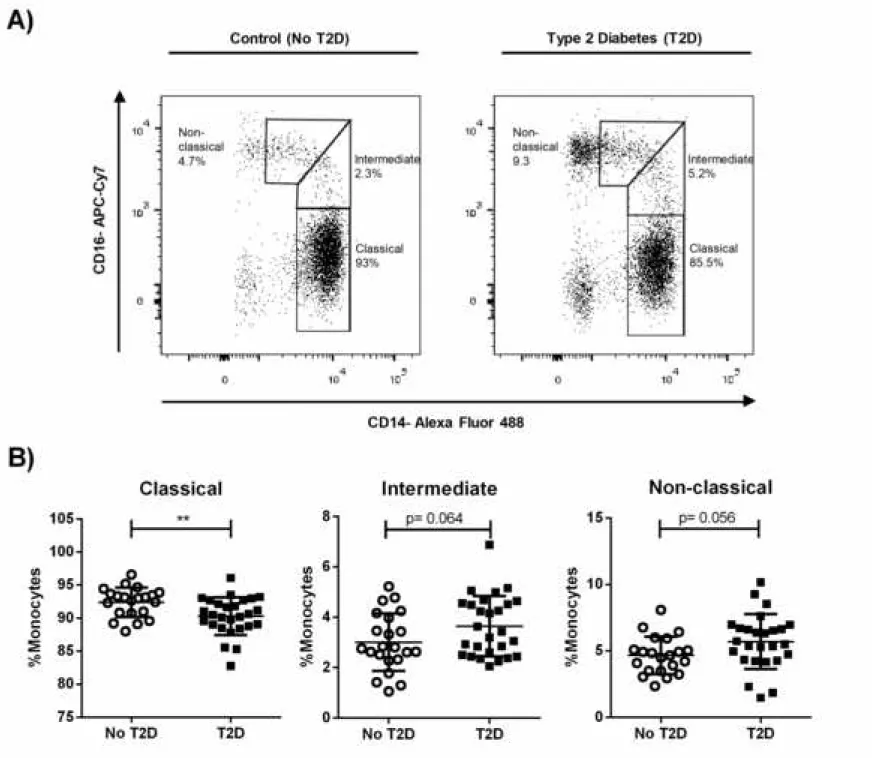
4.2. A lower frequency of classical monocytes is observed in T2D patients
Human blood monocytes comprise at least three subpopulations that differ in phenotype and function (26). The number of specific monocytes subsets is strongly linked to the physiological status of the host (18, 21), and it has scarcely been studied in monocytes from diabetic patients. Figure S1 shows the gating strategy for the flow cytometry analysis performed to classify monocytes subsets based on CD14 and CD16 expression. An example of the cell subsets is illustrated in Figure 1A for control and for a T2D subject. As shown in Figure 1B, while the frequency of classical monocytes was lower in the peripheral blood of T2D patients compared to subjects without T2D, intermediate and non-classical monocytes displayed no significant differences (p = 0.064, and p = 0.056 respectively). However, it is worth mentioning
that the total frequency of CD16+ monocytes was higher in the T2D group (not
4.3. T2D diminishes the expression of M1 and M2 markers in monocytes and do not present changes in MMe markers
To evaluate whether a bias toward a particular monocyte phenotype was being induced in T2D patients, phenotypic markers associated to M1 (HLA-DR, CD86), M2 (PD-L1, CD163, CD206, MERTK), and Metabolically activated (MMe) (CD36, ABCA-1) programs were evaluated in comparison to healthy individuals. Figure S1B shows an example (healthy individual) of the gating strategy used for the phenotyping markers. In the case of M1 markers, the MFI for HLA-DR (p = 0.024) and CD86 (p = 0.020) were lower in cells from T2D patients (Fig. 2); we also observed that the
frequency of HLADR+ cells was lower (p = 0.011) in T2D patients (Fig. S2). With
regard to M2 markers, while we observed no differences in the expression intensity of CD206 and MERTK, the FMI for PD-L1 (p = 0.032) and CD163 (p = 0.024) was lower in T2D patients (Fig. 2); of these, we noticed a lower percentage of cells positive for CD163 (p = 0.020) and MERTK (p = 0.034) (Fig.S2). By contrast, MMe markers MFI and percentage were equivalent between groups (Fig. 2 and Fig. S2). Altogether, these results indicate that the M1 and M2 programs of monocyte activation are affected in T2D patients compared to healthy individuals.
4.4. A decrease in the numbers of classical monocytes correlates with poor glycemic control and metabolic variables
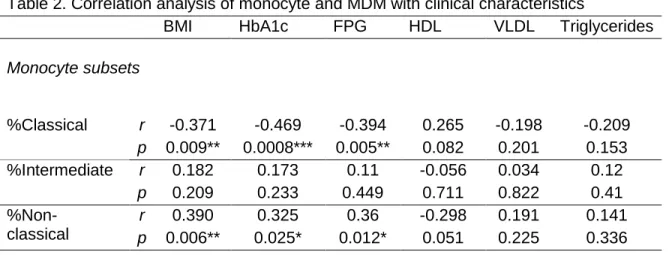
It has been described that several complications of diabetes have been associated with laboratory or clinical features due to chronicity. To explore whether clinical characteristics influence the number and type of the monocyte subsets present in our experimental groups, a correlation analysis was performed between the clinical features of the whole population studied (patients and controls) and the percentage of monocyte subsets. Table 2 shows the correlation results for the clinical parameters that were significantly different between T2D patients and controls (in Table 1). The percentage of classical monocytes was inversely correlated with BMI (r = -0.371, p = 0.009), HbA1c (r = -0.469, p = 0.0008) and FPG (r = -0.394, p = 0.005); that is, increases in BMI and poor glycemic control resulted in lower frequencies of classical monocytes. By contrast, the same clinical parameters were
positively correlated to the percentage of non-classical monocytes: BMI (r = 0.390,
p = 0.006), HbA1c (r = 0.325, p = 0.025) and FPG (r = 0.360, p = 0.012). The
correlation was also calculated for age, total cholesterol, LDL-cholesterol, and serum creatinine; no significant correlations were found (not shown). All in all, these findings suggest that the worsening in the glycemic control is associated with an increase of non-classical monocytes mirrored by a decrease in the classical subset.
4.5. A poor metabolic control influences negatively the expression of HLA-DR, CD86, PD-L1 and CD163 in monocytes
To explore the relationship between clinical characteristics and the expression (MFI) of specific phenotypic markers in monocytes, a correlation analysis was performed for all clinical measurements and markers evaluated. Table 2 summarizes only the variables showing significant correlations. While an inverse correlation was found between HbA1c (r = 0.356, p = 0.010), FGP (r = 0.288, p = 0.040), VLDL (r = -0.302, p = 0.041) and triglycerides (r = -0.311, p = 0.026) with the expression of HLA-DR, there was a positive one between the levels of HDL-cholesterol and this receptor (r = 0.305, p = 0.036). In fact, HDL levels also correlated positively with CD86 (r = 0.459, p = 0.001), PD-L1 (r = 0.390, p = 0.006) and CD163 (r = 0.288, p = 0.049) levels. In addition, an inverse correlation was found between BMI and CD163 expression (r = -0.335, p = 0.016). On the contrary, variables such as age, total cholesterol, LDL-cholesterol or serum creatinine, showed no significant correlation with any of the measured phenotypic markers. Therefore, a worse metabolic control influences the decrease on the expression of HLA-DR, CD86, PD-L1 and CD163, with a remarkable effect on HLA-DR.
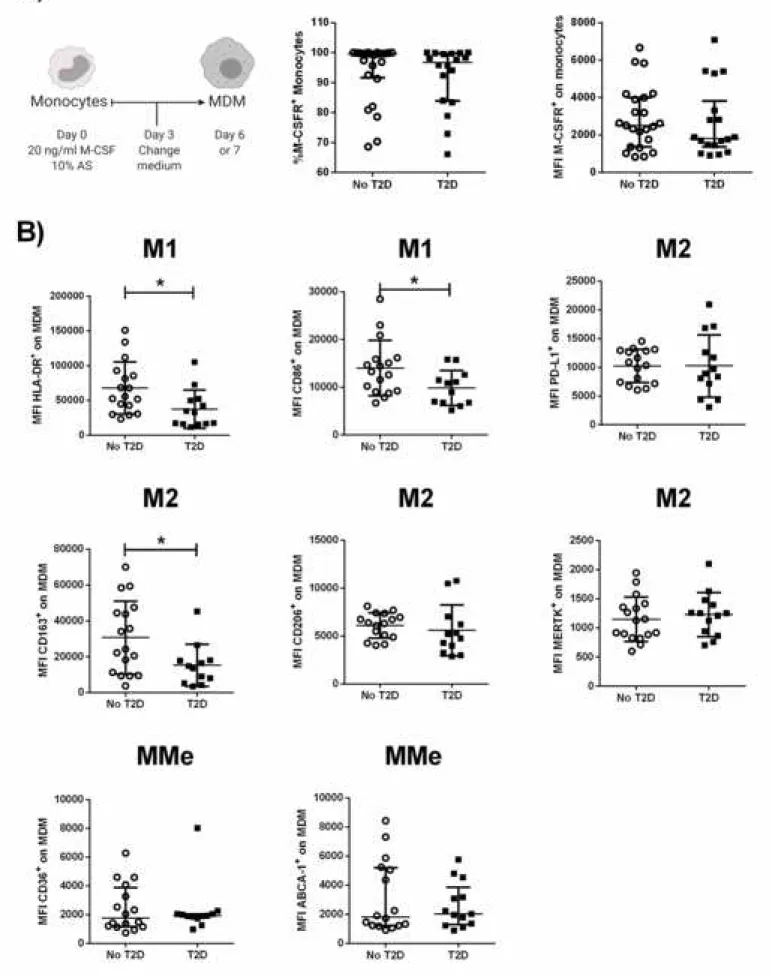
4.6. Type 2 diabetes mellitus diminishes the expression of M1 and M2 markers in MDM with no changes in Metabolic markers
Since T2D appeared to influence the number and activation status of circulating monocytes, partially as a function of the degree of metabolic control, we next explored whether this disease also alters their differentiation potential towards
macrophages in the presence of M-CSF and autologous serum (Fig. 3A). To rule out that differences in MDM phenotype could arise from differences in M-CSF receptor (M-CSFR) expression levels in monocytes from our experimental groups, we first evaluated the levels of this receptor (CD115) by flow cytometry, finding similar expression (MFI and %) in T2D patients compared to controls (Fig. 3A). Next, we evaluated the expression of M1, M2, and MMe markers in MDM from either T2D patients or healthy individuals. Figure S3 shows the gating strategy and an example of the phenotyping of each evaluated marker. As illustrated in Figure 3B, HLA-DR (p = 0.003), CD86 (p = 0.040) and CD163 (p = 0.025) were decreased in MDM from T2D patients; no differences in the levels of PD-L1, CD206, MERTK or the metabolic markers. These findings indicate that T2D may alter the monocyte differentiation potential towards a mix of the M1 and M2 program of macrophage activation.
4.7. A deficient metabolic control correlates negatively with HLA-DR, CD86, and CD163 expression in monocyte-derived macrophages (MDM)
Finally, we searched for an association between the clinical characteristics and the expression of phenotypic markers in MDM. Accordingly, the correlation analysis for the clinical variables with difference between controls and T2D patients (in Table 1) the results are shown in Table 2 (bottom). Similar to our analyses in monocytes, a positive correlation was found for HDL with HLA-DR (r = 0.494, p = 0.007). Additionally, a negative correlation was observed for HbA1c levels and CD86 expression (r = -0.400, p = 0.031), while the levels of CD163 correlated in a negative manner with FPG (r = -0.446, p = 0.015). Beyond the results shown at Table 2, we also found an inverse correlation between age and CD86 MFI (r = -0.428, p = 0.020), age and CD163 (r = -0.470, p = 0.010), and LDL and CD163 (r = -0.412, p = 0.040) (not shown). To rule out that the T2D evolution time (more than the age of subjects) is influencing marker expression in MDM, a correlation analysis was performed for the years with the T2D diagnosis and the MFI of CD86 or CD163 and yielded no significant association (not shown). Collectively, we observed that a lack of metabolic control correlates inversely with HLA-DR, CD86, and CD163 expression.
The different functional phenotypes of monocytes and macrophages influence homeostasis and, therefore, the establishment and development of pathologies. While the phenotype of monocytes has been determined in obesity, few studies have evaluated this immunological parameter in T2D. T2D is a complex and multifactorial disease, frequently associated with metabolic syndrome including obesity. Most studies in the literature have focused on the characterization of monocytes subsets in morbid obese T2D patients who have relatively good glycemic/metabolic control and were compared to morbid obese subjects with no T2D (19-21). As the obesity condition impacts the monocyte compartment, it is difficult to fully understand the individual contribution of diabetes manifested in patients within the metabolic syndrome. For this reason, in the present work we selected a group of T2D patients i) defined as overweight (but not morbidly obese), ii) within a range of glycemic/metabolic control and age, iii) without vascular complications, in order to be compared to control lean healthy group, with no one single criteria for metabolic syndrome; that is, we intended to separate the contribution of obesity from that of glycemic/metabolic control over monocytes and MDM phenotypic frequencies in T2D. To accomplish this, multiple cell-surface markers were evaluated, and our findings suggest that T2D influences the phenotypes at least partially as a function of the metabolic control.
Our study makes three important contributions. First, CD16- monocytes are
decreased and CD16+ monocytes are increased in T2D patients compared to
healthy subjects, and this correlates with glycemic/metabolic control. Regarding the few studies evaluating the effect of T2D in subjects without obesity (22, 23), our results coincide with Kumar and colleagues (22), who found a decrease in classical monocytes in the T2D patients, a pattern that is also seen in individuals with tuberculosis (22). Our results in overweight T2D demonstrated a negative correlation
in the frequency of classical monocytes (CD16-) with BMI, HbA1c, and FPG; a
positive correlation was also noticed between non-classical monocytes, as well as
consistent with the report by Poitou and colleagues annotating a positive correlation
in morbid obese-diabetics between the frequency of CD16+ monocytes and age,
IMC, FPG, HbA1c and triglycerides, and a negative correlation between this monocyte subset and the levels of HDL-cholesterol (19). Taken together, this
information suggests that CD16+ increase due to obesity, and persist during T2D
along with the decrease of CD16- monocytes in patients with a poor
glycemic/metabolic control, suggesting there is an additive effect of a rise in the obesity degree and the poor glycemic/metabolic control over the increase of
inflammatory CD16+ monocytes. Since classical monocytes are usually recruited to
infected sites and damaged tissues, as they are considered antimicrobial, we infer their decrease in poorly controlled T2D will manifest into a causal relationship with comorbidity with multiple infectious diseases, such as tuberculosis (27, 28).
The second contribution of this study concerns the assessment of cell-surface markers related to monocyte and macrophage activation in T2D patients. Indeed, we found that monocytes in T2D patients exhibit a decrease in the expression of M1 and M2 markers, and that the poor metabolic control influences negatively the expression of HLA-DR, CD86, PD-L1, and CD163 in these cells. Specifically, in monocytes we found a decrease in M1 (HLA-DR, CD86) and M2 (CD163, PD-L1) markers, but no effect in those for MMe activation. Aside from circulating monocytes, we carried out the cell-surface marker assessment in our MDM model using M-CSF and autologous human sera to mimic the diabetic’s blood microenvironment, finding also a decrease in HLA-DR, CD86, and CD163, which negatively correlated with glycemic or metabolic control parameters. Interestingly, HLA-DR is expressed by antigen-presenting cells, such as monocytes and macrophages, where this molecule stimulates adaptive immune response by presenting peptides to T lymphocytes, and CD86 is a costimulatory molecule that promotes T lymphocyte activation and differentiation, suggesting that the process of antigen presentation may be affected in T2D patients (29). In agreement with our results, a decrease of mRNA for HLA-DR in whole blood was documented in obese adolescents with insulin resistance, compared to obese and to healthy subjects without signs of insulin resistance (30).
Additionally, CD14+HLA-DRlow/- are defined as monocytic myeloid-derived
suppressor cells (M-MDSC), which can suppress T lymphocyte proliferation (31, 32).
In T2D patients, we found a lower frequency and MFI of CD14+HLA-DR+ cells, which
could be the reason for the increase in the M-MDSC population previously described in diabetes (21, 33). While CD86 expression has not been reported previously in monocytes from T2D patients, here we found lower expression levels of HLA-DR, CD86 in both monocytes and MDM from T2D patients.
Besides, HLA-DR expression in MDM from T2D patients linked positively with HDL, while the expression of CD86 correlates negatively with HbA1c. These results are in line with our previous work, where we reported that T2D MDM from monocytes, differentiated with granulocyte-macrophage colony-stimulating factor (GM-CSF) and autologous serum, had a lower CD86 expression compared to subjects with no diabetes (8). Additionally, Xiu and colleagues reported, using murine macrophages and the THP-1 cell line exposed to high palmitate and glucose concentrations, a lower expression of HLA-DR and CD86 in these cells (34), which is consistent with our results in T2D patients with hyperglycemia and hypertriglyceridemia. Of note, both hyperglycemia and hypertriglyceridemia are reported as factors contributing to impairment of immunity and immunosuppression, increasing the risk for infections in patients suffering from these clinical conditions (35-37). PD-L1 is the ligand for the programmed death 1 receptor (PD-1); it competes with CD86 for CD28 binding and its activation is responsible for inhibitory signals regulating T cell activation, immune tolerance and tissue damage (38). A decrease in the expression of PD-1 has been
reported in CD4+ and CD8+ T cells, as well as in monocytes from diabetic patients
(39); no effect has been reported for the expression of PD-L1 in these patients monocytes thus far. Another consideration is the fact that a deficiency in PD-1 expression supports macrophage activation towards the M1 program (38), and a consequent decrease in M2 macrophages, would favor a lack of insulin sensitivity. Interestingly, we did not observe any changes in PD-L1 expression in MDM from T2D patients. Nevertheless, the literature points toward a defective interaction PD-1/PD-L1 associated with diabetes (39). Beyond the alteration in molecules important for the differentiation and activation of T lymphocytes, we also found a lower
expression in CD163 in monocytes and in MDM from T2D patients. With its expression correlating positively with HDL in monocytes and negatively with FPG in MDM. CD163 is a scavenger receptor for the complex haptoglobin-hemoglobin (Hb-Hp), with anti-inflammatory activity and expressed only in monocytes and macrophages. In agreement with our results, in monocytes from diabetic patients,
CD163 correlates inversely with insulin resistance (40), and a lower CD163+ cells
frequency has been observed in diabetic patients with micro- and macro-vascular complications compared to the those without complications (41). Additionally, Al Dubayee and colleagues (24) found in PBMCs a decrease in mRNA for CD163 in obese T2D patients compared to obese and lean subjects. Regarding metabolically activated markers, in difference to its reported presence in macrophages from adipose tissue, we found no differences in the expression for CD36 and ABCA-1 in peripheral monocytes or MDM. This could imply the cells expressing those particular markers are tissue-specific and therefore only localized in tissues with a highly lipidic environment (42, 43). These results suggest that markers for different activation programs are present in peripheral monocytes and MDM, instead of a unique or predominant program being driven by hyperglycemia (24). In summary, these findings also suggest immune dysfunction in T2D patients is strongly associated with poor glycemic/metabolic control (44).
The final contribution of our study deals with the inclusion criteria used to select the T2D patients in our study, in particular with those individuals being pharmacologically treated with metformin, or metformin combined with glibenclamide, without insulin administration; this hormone is well documented to affect the activation process of antigen-presenting cells (45). In THP-1 cells, glibenclamide promoted alternative activation of these macrophages by enhancing the expression of the M2 marker CD206 (46). Other authors provided evidence that glibenclamide reduces M1 (HLA-DR and CD86) and increases M2 (CD163 and CD206) cell-surface marker expression on primary human monocytes from healthy individuals (47). However, to date, there are no reports about the glibenclamide effects in primary human monocyte/MDM phenotype and function in T2D patients. Regarding metformin, it has been documented in mouse models that this drug decreases the low-degree
inflammation associated with obesity, and it activates macrophages toward an M2 phenotype (48). Al Dubayee and colleagues (24) studied markers associated with activation programs in PBMC from lean subjects, obese persons, obese newly diagnosed diabetics, and obese T2D patients under treatment with metformin. The authors reported that the mRNA expression levels for CD68, IL6, INOS, TNF, CD36, and CD206 are higher in T2D subjects than in lean persons; such levels reverted in T2D patients treated with metformin compared with non-treated T2D subjects. In addition, mRNA expression levels for CD163 and CD169 are lower in T2D subjects compared to lean individuals, but they become higher in T2D under treatment with metformin. Therefore, this evidence points to an influence of metformin over activation programs in PBMC from T2D patients. In spite of our T2D patients being treated with metformin alone or combined with glyburide, we still detected differences in the expression of important functional markers in monocytes and in MDM, finding a critical correlation between metabolic status and markers of monocyte/macrophage activation. This indicates that T2D induces multiple changes in these activation markers that, at least in poorly controlled T2D patients, can be partially normalized by pharmacological treatment.
6. Conclusion
T2D alters human monocyte subsets and lowers the expression of HLA-DR, CD86, PD-L1, and CD163, an effect that is mirrored for HLA-DR, CD86, and CD163 markers in MDM. Instead of skewing monocytes/macrophages towards a unique program of activation, our results suggest that T2D alters specific markers associated with function, which would translate to the immune dysfunction and susceptibility to pathogenic infection which is well-documented in T2D patients. Indeed, this work contributes to the understanding of how the microenvironment of metabolic diseases alters key immune cells and influences this disease pathology.
The authors report no conflicts of interest. The authors alone are responsible for the content and writing of the paper.
ACKNOWLEDGEMENTS
We acknowledge the kindly sharing of reagents and methods from Olivier Neyrolles Ph.D. laboratory. We are also grateful to the individuals that accepted participate in our study donating the blood samples.
FUNDING: This work was supported by the Fondo de Investigación en Salud [grant
number FIS/IMSS/PROT/G17-2/1717] to CJS; and CONACYT: Apoyo al Fortalecimiento y Desarrollo de la Infraestructura Científica y Tecnológica 2016 [grant 271286/FIS/IMSS/PROT/1544] to JECD.
MAVA and JECD performed the experiments and were involved in data analysis and drafting of the manuscript. SRT and MSAV performed the experiments. GLV was involved in data analysis and drafting of the manuscript. FDA and MAVA recruited patients and analyzed clinical data. JEM and BRS were involved in drafting of the manuscript. CJS conceived of the project, involved in data analysis, and drafted the manuscript.
REFERENCES
-
1. Saeedi P, Petersohn I, Salpea P, Malanda B, Karuranga S, Unwin N, et al. Global
and regional diabetes prevalence estimates for 2019 and projections for 2030 and 2045: Results from the International Diabetes Federation Diabetes Atlas, 9(th) edition. Diabetes Res Clin Pract. 2019;157:107843.
2. Cane S, Ugel S, Trovato R, Marigo I, De Sanctis F, Sartoris S, et al. The Endless
Saga of Monocyte Diversity. Front Immunol. 2019;10:1786.
3. Ziegler-Heitbrock L, Ancuta P, Crowe S, Dalod M, Grau V, Hart DN, et al.
4. Wong KL, Tai JJ, Wong WC, Han H, Sem X, Yeap WH, et al. Gene expression profiling reveals the defining features of the classical, intermediate, and nonclassical human monocyte subsets. Blood. 2011;118(5):e16-31.
5. Yona S, Jung S. Monocytes: subsets, origins, fates and functions. Curr Opin
Hematol. 2010;17(1):53-9.
6. Shapouri-Moghaddam A, Mohammadian S, Vazini H, Taghadosi M, Esmaeili SA,
Mardani F, et al. Macrophage plasticity, polarization, and function in health and disease. J Cell Physiol. 2018;233(9):6425-40.
7. Parisi L, Gini E, Baci D, Tremolati M, Fanuli M, Bassani B, et al. Macrophage
Polarization in Chronic Inflammatory Diseases: Killers or Builders? J Immunol Res. 2018;2018:8917804.
8. Lopez-Lopez N, Martinez AGR, Garcia-Hernandez MH, Hernandez-Pando R,
Castaneda-Delgado JE, Lugo-Villarino G, et al. Type-2 diabetes alters the basal phenotype of human macrophages and diminishes their capacity to respond, internalise, and control Mycobacterium tuberculosis. Mem Inst Oswaldo Cruz. 2018;113(4):e170326.
9. Martinez F, Laura H, Siamon G. Alternative Activation of Macrophages: An
Immunologic Functional Perspective. Annual Review of Immunology. 2009;27(1):451-83.
10. Mantovani A, Sica A, Sozzani S, Allavena P, Vecchi A, Locati M. The chemokine
system in diverse forms of macrophage activation and polarization. Trends Immunol. 2004;25(12):677-86.
11. Kratz M, Coats BR, Hisert KB, Hagman D, Mutskov V, Peris E, et al. Metabolic
dysfunction drives a mechanistically distinct proinflammatory phenotype in adipose tissue macrophages. Cell Metabolism. 2014;20(4):614-25.
12. Murdoch C, Muthana M, Coffelt SB, Lewis CE. The role of myeloid cells in the
promotion of tumour angiogenesis. Nat Rev Cancer. 2008;8(8):618-31.
13. Osborn O, Olefsky JM. The cellular and signaling networks linking the immune
system and metabolism in disease. Nat Med. 2012;18(3):363-74.
14. Lee J. Adipose tissue macrophages in the development of obesity-induced
inflammation, insulin resistance and type 2 diabetes. Arch Pharm Res. 2013;36(2):208-22.
15. Lumeng CN, Bodzin JL, Saltiel AR. Obesity induces a phenotypic switch in
adipose tissue macrophage polarization. J Clin Invest. 2007;117(1):175-84.
16. Mattos RT, Medeiros NI, Menezes CA, Fares RC, Franco EP, Dutra WO, et al.
Chronic Low-Grade Inflammation in Childhood Obesity Is Associated with Decreased IL-10 Expression by Monocyte Subsets. PLoS One. 2016;11(12):e0168610.
17. Pecht T, Haim Y, Bashan N, Shapiro H, Harman-Boehm I, Kirshtein B, et al.
Circulating Blood Monocyte Subclasses and Lipid-Laden Adipose Tissue Macrophages in Human Obesity. PLoS One. 2016;11(7):e0159350.
18. Devevre EF, Renovato-Martins M, Clement K, Sautes-Fridman C, Cremer I,
Poitou C. Profiling of the three circulating monocyte subpopulations in human obesity. J Immunol. 2015;194(8):3917-23.
19. Poitou C, Dalmas E, Renovato M, Benhamo V, Hajduch F, Abdennour M, et al.
relationships with fat mass and subclinical atherosclerosis. Arterioscler Thromb Vasc Biol. 2011;31(10):2322-30.
20. Resende DP, da Costa AC, de Souza Rosa LP, Rodrigues AP, Santos A, Cardoso
CK, et al. Non-classical circulating monocytes in severe obesity and obesity with uncontrolled diabetes: A comparison with tuberculosis and healthy individuals. Tuberculosis (Edinb). 2019;114:30-41.
21. Friedrich K, Sommer M, Strobel S, Thrum S, Bluher M, Wagner U, et al.
Perturbation of the Monocyte Compartment in Human Obesity. Front Immunol. 2019;10:1874.
22. Kumar NP, Moideen K, Dhakshinraj SD, Banurekha VV, Nair D, Dolla C, et al.
Profiling leucocyte subsets in tuberculosis-diabetes co-morbidity. Immunology. 2015;146(2):243-50.
23. Fadini GP, de Kreutzenberg SV, Boscaro E, Albiero M, Cappellari R, Krankel N, et
al. An unbalanced monocyte polarisation in peripheral blood and bone marrow of patients with type 2 diabetes has an impact on microangiopathy. Diabetologia. 2013;56(8):1856-66.
24. Al Dubayee MS, Alayed H, Almansour R, Alqaoud N, Alnamlah R, Obeid D, et al.
Differential Expression of Human Peripheral Mononuclear Cells Phenotype Markers in Type 2 Diabetic Patients and Type 2 Diabetic Patients on Metformin. Front Endocrinol (Lausanne). 2018;9:537.
25. Andersen MN, Al-Karradi SN, Kragstrup TW, Hokland M. Elimination of
erroneous results in flow cytometry caused by antibody binding to Fc receptors on human monocytes and macrophages. Cytometry A. 2016;89(11):1001-9.
26. Schmidl C, Renner K, Peter K, Eder R, Lassmann T, Balwierz PJ, et al.
Transcription and enhancer profiling in human monocyte subsets. Blood. 2014;123(17):e90-9.
27. Critchley JA, Carey IM, Harris T, DeWilde S, Hosking FJ, Cook DG. Glycemic
Control and Risk of Infections Among People With Type 1 or Type 2 Diabetes in a Large Primary Care Cohort Study. Diabetes Care. 2018;41(10):2127-35.
28. Mahishale V, Avuthu S, Patil B, Lolly M, Eti A, Khan S. Effect of Poor Glycemic
Control in Newly Diagnosed Patients with Smear-Positive Pulmonary Tuberculosis and Type-2 Diabetes Mellitus. Iran J Med Sci. 2017;42(2):144-51.
29. Soares AK, Neves PA, Cavalcanti MD, Marinho SM, Oliveira WJ, Souza JR, et al.
Expression of co-stimulatory molecules CD80 and CD86 is altered in CD14 + HLA-DR + monocytes from patients with Chagas disease following induction by Trypanosoma cruzi recombinant antigens. Rev Soc Bras Med Trop. 2016;49(5):632-6.
30. Minchenko DO. Insulin resistance in obese adolescents affects the expression of
genes associated with immune response. Endocr Regul. 2019;53(2):71-82.
31. Haile LA, von Wasielewski R, Gamrekelashvili J, Kruger C, Bachmann O,
Westendorf AM, et al. Myeloid-derived suppressor cells in inflammatory bowel disease: a new immunoregulatory pathway. Gastroenterology. 2008;135(3):871-81, 81 e1-5.
32. Chen Y, Pan G, Tian D, Zhang Y, Li T. Functional analysis of
CD14(+)HLA-DR(-/low) myeloid-derived suppressor cells in patients with lung squamous cell carcinoma. Oncol Lett. 2017;14(1):349-54.
33. Fernandez-Ruiz JC, Galindo-De Avila JC, Martinez-Fierro ML, Garza-Veloz I, Cervantes-Villagrana AR, Valtierra-Alvarado MA, et al. Myeloid-Derived Suppressor Cells Show Different Frequencies in Diabetics and Subjects with Arterial
Hypertension. J Diabetes Res. 2019;2019:1568457.
34. Xiu F, Diao L, Qi P, Catapano M, Jeschke MG. Palmitate differentially regulates
the polarization of differentiating and differentiated macrophages. Immunology. 2016;147(1):82-96.
35. Lachmann G, von Haefen C, Kurth J, Yuerek F, Wernecke KD, Spies C. Smoking,
Gender, and Overweight Are Important Influencing Factors on Monocytic HLA-DR before and after Major Cancer Surgery. Biomed Res Int. 2017;2017:5216562.
36. Fumeaux T, Pugin J. Is the measurement of monocytes HLA-DR expression
useful in patients with sepsis? Intensive Care Med. 2006;32(8):1106-8.
37. Cheron A, Floccard B, Allaouchiche B, Guignant C, Poitevin F, Malcus C, et al.
Lack of recovery in monocyte human leukocyte antigen-DR expression is
independently associated with the development of sepsis after major trauma. Crit Care. 2010;14(6):R208.
38. Yao A, Liu F, Chen K, Tang L, Liu L, Zhang K, et al. Programmed death 1
deficiency induces the polarization of macrophages/microglia to the M1 phenotype after spinal cord injury in mice. Neurotherapeutics. 2014;11(3):636-50.
39. Sun P, Jin Q, Nie S, Jia S, Li Y, Li X, et al. Unlike PD-L1, PD-1 Is Downregulated on
Partial Immune Cells in Type 2 Diabetes. J Diabetes Res. 2019;2019:5035261.
40. Kawarabayashi R, Motoyama K, Nakamura M, Yamazaki Y, Morioka T, Mori K, et
TABLES AND FIGURES LEGENDS
Table 1. Clinical characteristics of participants
Characteristics Controls (No T2D) T2D patients p
Numbers of cases (n) 27 28 NA
Years with DM2 diagnosis NA 5.56 ± 5.75 NA
Age, years 42.93 ± 7.40 46.57 ± 7.61 0.077 BMI (kg/m2) 25.11 ± 2.37 26.97 ± 2.79 0.010* HbA1c (%) 5.24 ± 0.32 9.83 ± 2.39 <0.001*** FPG (mg/dl) 85.11 ± 7.21 212.5 ± 85.31 <0.001*** Total cholesterol (mg/dl) 165.4 ± 37.43 184.3 ± 57.54 0.156 HDL- cholesterol (mg/dl) 53.38 ± 10.25 42.63 ± 8.54 <0.001*** LDL- cholesterol (mg/dl) 105.80 ± 30.68 108.80 ± 43.60 0.780 VLDL- cholesterol (mg/dl) ζ 20.43 ± 5.93 45.29 ± 31.25 <0.001*** Triglycerides (mg/dl) ζ 98.84 ± 29.04 223.00 ± 154.00 <0.001*** Serum creatinine (mg/dl) ζ 0.78 ± 0.18 0.68 ± 0.11 0.064 Hypertension, n (%) 0 (0) 8 (28.57) NA Metformin, n (%) 0 (0) 25 (89.28) NA Glibenclamide, n (%) 0 (0) 16 (57.14) NA Metformin +Glibenclamide, n (%) 0 (0) 16 (57.14) NA
T tests were performed to identify differences between groups unless otherwise specified; ζ: Mann-Whitney U test were performed for these variables; mean (± standard deviation) are shown for all quantitative variables. BMI: body mass index; HbA1c: glycated hemoglobin %; HDL: high density lipoprotein; LDL: low density lipoprotein; VLDL: very low-density lipoprotein; NA: non-applicable; *P ˂ 0.05; ***P ˂ 0.001.
Table 2. Correlation analysis of monocyte and MDM with clinical characteristics
BMI HbA1c FPG HDL VLDL Triglycerides
Monocyte subsets %Classical r -0.371 -0.469 -0.394 0.265 -0.198 -0.209 p 0.009** 0.0008*** 0.005** 0.082 0.201 0.153 %Intermediate r 0.182 0.173 0.11 -0.056 0.034 0.12 p 0.209 0.233 0.449 0.711 0.822 0.41 %Non- classical r 0.390 0.325 0.36 -0.298 0.191 0.141 p 0.006** 0.025* 0.012* 0.051 0.225 0.336
Markers expression on monocytes
MFI HLA-DR r -0.044 -0.356 -0.288 0.305 -0.302 -0.311 p 0.757 0.010* 0.040* 0.036* 0.041* 0.026* MFI CD86 r 0.003 -0.094 -0.103 0.459 -0.182 -0.223 p 0.982 0.513 0.476 0.0013** 0.231 0.118 MFI PD-L1 r -0.048 -0.189 -0.118 0.390 0.223 -0.177 p 0.733 0.189 0.408 0.006** 0.130 0.212 MFI CD163 r -0.335 -0.173 -0.265 0.288 -0.321 -0.267 p 0.016* 0.222 0.060 0.049* 0.029* 0.058 Markers expression on MDM MFI HLA-DR r -0.283 -0.357 -0.303 0.494 -0.211 -0.170 p 0.129 0.052 0.103 0.007** 0.289 0.367 MFI CD86 r -0.166 -0.400 -0.328 0.110 -0.129 -0.112 p 0.387 0.031* 0.081 0.582 0.529 0.563 MFI CD163 r -0.247 -0.340 -0.446 0.025 -0.301 -0.278 p 0.195 0.070 0.015* 0.899 0.134 0.143 Correlation were calculated with Pearson or Spearman correlation coefficient. MFI: median fluorescence intensity; BMI: body mass index; HbA1c: glycated hemoglobin %; FPG: fasting plasma glucose; HDL: high density lipoprotein; VLDL: very low-density lipoprotein. *P ˂ 0.05; **P ˂ 0.01; ***P ˂ 0.001.
Figure 1. Distribution of monocyte subsets in patients with T2D. Mononuclear cells were magnetically isolated from subjects without diabetes (n=22) and T2D patients (n=27) to quantify monocytes subsets based on the expression of the cell-surface CD14 and CD16 markers. A) Representative dot plot of monocyte subsets for a control individual (left) and a T2D patient (right). B) Vertical scatter plot of the
percentage of classical (CD14++CD16-), intermediate (CD14++CD16+) and
non-classical (CD14+CD16+) monocytes. Statistical analysis was performed using the
unpaired t test, **P ˂ 0.01. Each circle/square within the scatter plot represents an individual.
Figure 2. Expression of M1, M2 and MMe cell-surface markers on monocytes from T2D patients. Mononuclear cells were magnetically isolated from subjects without diabetes (n=25) and T2D patients (n=27) to quantify monocytes phenotypic markers.
Gating on CD14+ monocytes the median fluorescence intensity (MFI) was
determined for each surface marker. M1 markers included HLA-DR and CD86; M2 markers, PD-L1, CD163, CD206 and MERTK; and MMe markers, CD36 and ABCA-1. Statistical analysis was performed using the Unpaired t or Mann-Whitney U test according to the normality of the data, *P ˂ 0.05. Each circle/square within the vertical scatter plot represents an individual.
Figure 3. Expression of M1, M2 and MMe cell-surface markers on monocyte-derived macrophages (MDM) from T2D patients. Mononuclear cells were isolated from subjects without diabetes (n=17) and T2D patients (n=13). A) Monocytes were differentiated into MDM for 6-7 days with 20 ng/ml of M-CSF and 10% autologous serum and stained with the indicated antibodies. Vertical scatted plots showing the
mean and standard deviation of the percentage of M-CSFR+ (center) and median
fluoresce intensity (MFI, right) on monocytes from healthy subjects (n=23) and T2D patients (n=18). Gating on live MDM (negative to LIVE/DEAD Fixable Violet), the MFI was determined on the positive cells for each surface marker. B) M1 markers included HLA-DR and CD86; M2 markers, PD-L1, CD163, CD206 and MERTK; and MMe markers, CD36 and ABCA-1. Statistical analysis was performed using the
Unpaired t or Mann-Whitney U test according to the normality of the data, *P ˂ 0.05, **P ˂ 0.01. Each circle/square within the scatter plot represents an individual. Figure S1. Flow cytometry gating strategy to identify the cell population studied and the expression markers M1, M2 and MMe on monocytes. A) Based on forward scatter height (FSC-H) and FSC-Area (FSC-A) singlets were selected, and then monocytes were later gated based on FCS-A and side scatter area (SSC-A). To determine monocytes subsets (classical, intermediate and non-classical) fluorescence minus one (FMO) controls for CD14 and CD16 were used to set the
quadrants. B) For the evaluation of cell-surface markers, CD14+ monocytes (using
a control unstained) were gated as shown in the representative histogram, and M1 (HLA-DR and CD86), M2 (PD-L1, CD163, CD206 and MERTK) and MMe (CD36 and ABCA-1) marker positivity were determined using the corresponding FMO control. A representative histogram is shown for each marker from one control subject.
Figure S2. M1, M2 and MMe cell-surface marker expression on circulating monocytes. Mononuclear cells were magnetically isolated from subjects without diabetes (n=25) and T2D patients (n=27) and stained with the indicated antibodies.
Vertical scatter plots show the percentages of CD14+ cells positive for M1 (HLA-DR
and CD86), M2 (PD-L1, CD163, CD206 and MERTK) and MMe (CD36 and ABCA-1) markers. Statistical analysis was performed using the Unpaired t or Mann-Whitney U test according to the normality of the data, *P ˂ 0.05. Each circle/square within the scatter plot represents an individual.
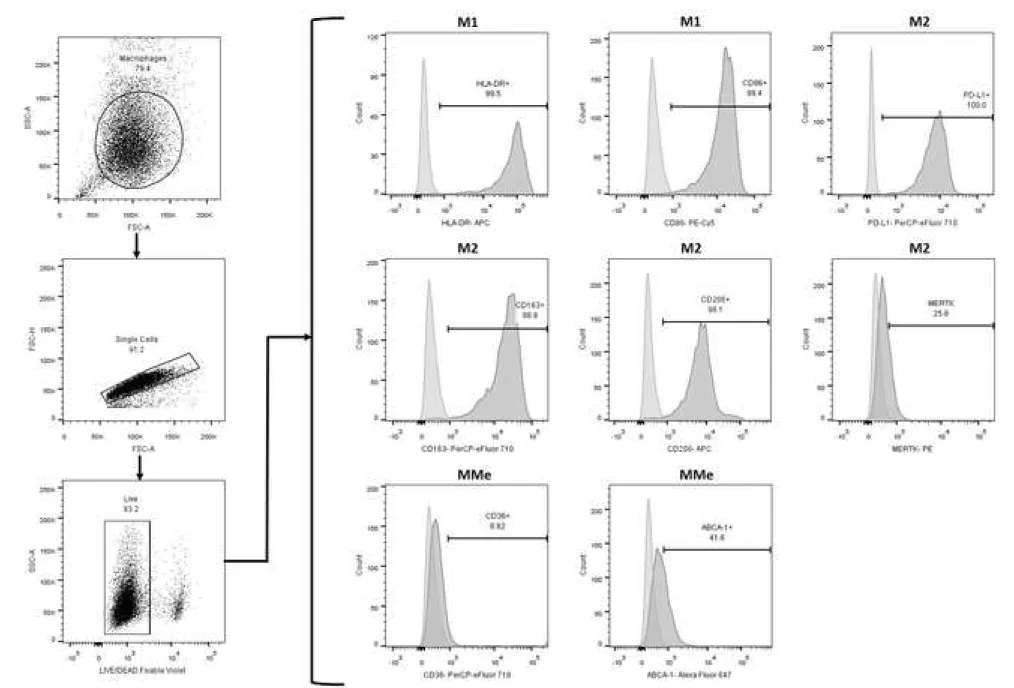
Figure S3. Flow cytometry gating strategy used to identify the expression of cell-surface markers for M1, M2 and MMe monocyte-derived macrophages (MDM). The identification of MDM was based on the parameters on forward scatter area (FSC-A) and side scatter area (SSC-(FSC-A), followed by the selection of singlets events based on FSC-height (FSC-H) and FSC-A. For expression of cell-surface marker evaluation, live MDM (negative to LIVE/DEAD Fixable Violet) were selected, and positivity for M1 (HLA-DR and CD86), M2 (PD-L1, CD163, CD206 and MERTK) and
MMe (CD36 and ABCA-1) markers were determined as shown for the indicated antibodies. A representative histogram is shown for each marker from one control subject.
Paseo de la Reforma No. 476, MN OTE, Col. Juárez, Alcaldía Cuauhtémoc, C. P. 06600, CDMX. Tel. (55) 5238 2700, Ext. XXXXX www.imss.gob.mx
DIRECCIÓN DE VINCULACIÓN INSTITUCIONAL Y EVALUACIÓN DE DELEGACIONES
Unidad de Comunicación Social Coordinación Técnica de Difusión
Vivian Fonseca, MD
Tulane University Health Sciences Center, 1415 Tulane Ave,
New Orleans, Louisiana, LA 70112, United States
Zacatecas, Zac., May 15th, 2020
Dear Editor
Regarding our manuscript entitled “Type 2 diabetes mellitus metabolic control correlates with the
phenotype of human monocytes and monocyte-derived macrophages” now being summited for
publication as a Research Article in the Journal of Diabetes and its Complications, in behalf of the authors, we declare
DO NOT HAVE ANY CONFLICT OF INTEREST Carmen Judith Serrano Ph. D. Corresponding author Principal Investigator Unidad de Investigación Biomédica Zacatecas Instituto Mexicano del Seguro Social México carmenyuyu2000@yahoo.com.mx Conflict of Interest
Paseo de la Reforma No. 476, MN OTE, Col. Juárez, Alcaldía Cuauhtémoc, C. P. 06600, CDMX. Tel. (55) 5238 2700, Ext. XXXXX www.imss.gob.mx
DIRECCIÓN DE VINCULACIÓN INSTITUCIONAL Y EVALUACIÓN DE DELEGACIONES
Unidad de Comunicación Social Coordinación Técnica de Difusión
AUTHOR CONSENT FORM
THIS DOCUMENT CERTIFIES THAT THE MANUSCRIPT ENTITLED “TYPE 2 DIABETES MELLITUS METABOLIC CONTROL CORRELATES WITH THE PHENOTYPE OF HUMAN MONOCYTES AND MONOCYTE-DERIVED MACROPHAGES” HAS BEEN APPROVED BY ALL NAMED AUTHORS AND THE ORDER OF THE AUTHORS LISTED IN THE MANUSCRIPT HAS BEEN APPROVED BY ALL AUTHORS