S1
Electronic Supplementary Information (ESI)
Evidencing Fast, Massive and Reversible H
+
-Insertion in Nanostructured TiO
2
Electrodes at
Neutral pH. Where Do Protons Come From?
Yee-Seul Kim, † Sébastien Kriegel, † Kenneth D. Harris, #,§ Cyrille Costentin, † Benoît Limoges†,* and Véronique Balland†,*
†
Laboratoire d’Electrochimie Moléculaire, UMR CNRS 7591, Université Paris Diderot, Sorbonne Paris Cité, 15 rue Jean-Antoine de Baïf, F-75205 Paris Cedex 13, France
#
NRC National Institute for Nanotechnology, Edmonton, Alberta, Canada T6G 2M9 and Department of Mechanical Engineering, University of Alberta, Edmonton, Alberta, Canada
T6G 2V4 .
§ Leibniz-Institute für Polymerforshung Dresden, 01069 Dresden, Germany
S2
Figure S1. (Left) CVs and (right) CVAs (λ = 780 nm) recorded at 7 different 1 µm-thick GLAD-TiO2 electrodes (arising from 2 different GLAD deposition batches) in 0.1 M HEPES
(pH 7.0) and 0.3 M KCl. Each color denotes a simultaneously recorded CV/CVA pair . Scan rate: 0.1 V∙s-1. T = 25°C.
S3
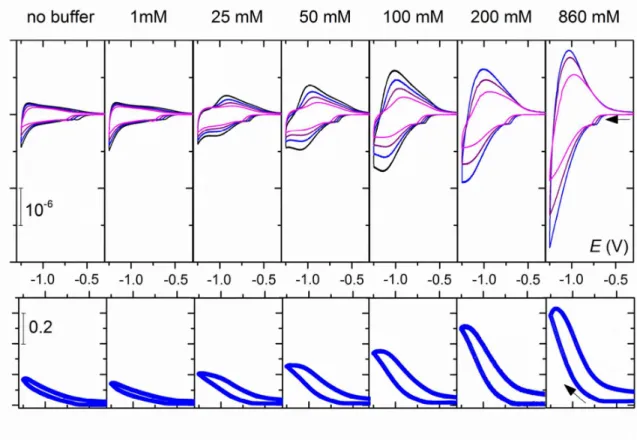
Figure S2. Top: CVs recorded at 1 µm-thick GLAD-TiO2 electrodes in aqueous solutions of
0.3 M KCl complemented with increasing concentration of HEPES buffer (pH 7.0). Buffer concentrations CB are reported on top of the graphs, and currents are converted to electron
flux density normalized to the scan rate. The ordinate is φ/v = i/FSv with units mol∙V-1∙cm-2. Scan rates: 0.05 V∙s-1 (black), 0.1∙V s-1 (blue), 0.2 V∙s-1 (purple) and 0.5 V∙s-1 (magenta). Bottom: CVAs (λ = 780 nm) recorded during the 0.1 V∙s-1 CV scans. The ordinate is in absorbance units. The abscissa for both the CVs and CVAs are potential (V) with respect to the Ag/AgCl (3 M KCl) reference electrode. T = 25°C.
S4
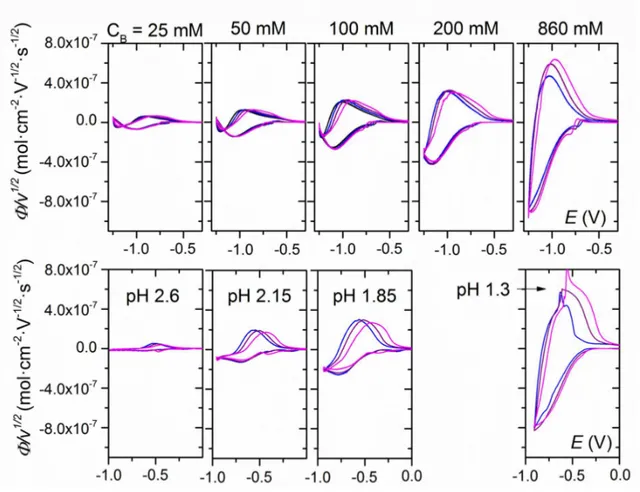
Figure S3. Top: CVs recorded at 1 µm-thick GLAD-TiO2 electrodes immersed in
increasingly acidic aqueous solutions (pHs are reported above the graphs). Currents are converted to electron flux density normalized to the scan rate. The ordinate is φ/v = i/FSv with units mol∙V-1∙cm-2. Scan rates: 0.05 V∙s-1 (black), 0.1 V∙s-1 (blue), 0.2 V∙s-1 (purple) and 0.5 V∙s-1 (magenta). Bottom: CVAs (λ = 780 nm) recorded simultaneously to the CVs (only experiments conducted at 0.1 V∙s-1 are shown). The ordinate is in absorbance units. The abscissa for both the CVs and CVAs are potential (V) with respect to the Ag/AgCl (3 M KCl) reference electrode. T = 25°C.
S5
Figure S4. Top: CVs previously presented in Figure S2 with correction to remove the
capacitive contribution to the total current (i.e., by subtracting the CVs recorded in 0.3 M KCl without buffer). Bottom: CVs previously presented in Figure S3 with correction to remove the capacitive contribution to the total current (i.e., by subtracting the CVs recorded in 0.3 M KCl). Currents were all converted to electron flux density normalized to the square root of scan rate. Scan rates: 0.05 V∙s-1 (black), 0.1 V∙s-1 (blue), 0.2 V∙s-1 (purple) and 0.5 V∙s-1 (magenta). The abscissa are potential (V) with respect to the Ag/AgCl (3 M KCl) reference electrode. T = 25°C.
S6
Figure S5. (A,B) CVs recorded at 1 µm-thick GLAD-TiO2 electrodes immersed in aqueous solutions containing 0.3 M KCl and (A) 76 mM acidic form of HEPES (i.e. 0.1 M HEPES buffer, pH 7.0) and (B) 76 mM LiCl. Scan rates: 0.05 V∙s-1 (black), 0.1 V∙s-1 (blue), 0.2 V∙s-1 (purple) and 0.5 V∙s-1 (magenta). (C) Same as (A,B) but with 0.3 M KCl and (red) 0.66 M acidic form of HEPES (0.66 M AH in 0.86 M HEPES, pH 7.0) or (dark blue) 1 M LiCl, both recorded at a scan rate of 0.1 V∙s-1. (D,E) CVAs (λ = 780 nm) recorded during the corresponding CV scans in (A,B). T = 25°C.
S7
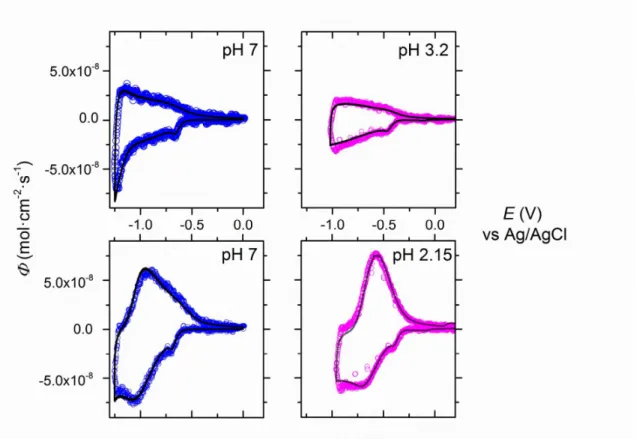
Figure S6. CVs (black line) and DCVAs (circles) expressed in flux density and recorded at
(left) neutral pH in the presence of (top) 1 mM or (bottom) 50 mM HEPES, or (right) acidic pHs. The optimized overlay of DCVAs and CVs was obtained by adjusting the ε780 value to
(blue) 800 M-1∙cm-1 and (magenta) 1200 M-1∙cm-1. All experiments were conducted in the presence of 0.3 M KCl at a scan rate of 0.1 V∙s-1. T = 25°C.
S8
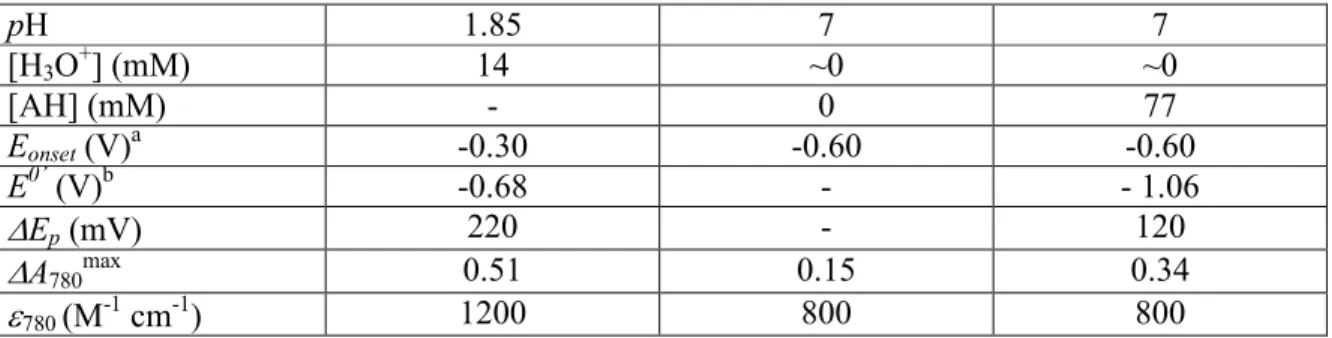
Table S1. Features of CVs and CVAs shown in Figure 2.
pH 1.85 7 7 [H3O+] (mM) 14 ~0 ~0 [AH] (mM) - 0 77 Eonset (V)a -0.30 -0.60 -0.60 E0’ (V)b -0.68 - - 1.06 ∆Ep (mV) 220 - 120 ∆A780max 0.51 0.15 0.34 ε780 (M-1 cm-1) 1200 800 800 a
Potential that characterize the onset increase of absorbance measured at 780 nm.
b