HAL Id: hal-01268529
https://hal.archives-ouvertes.fr/hal-01268529
Submitted on 29 Nov 2016
HAL is a multi-disciplinary open access
archive for the deposit and dissemination of
sci-entific research documents, whether they are
pub-lished or not. The documents may come from
teaching and research institutions in France or
abroad, or from public or private research centers.
L’archive ouverte pluridisciplinaire HAL, est
destinée au dépôt et à la diffusion de documents
scientifiques de niveau recherche, publiés ou non,
émanant des établissements d’enseignement et de
recherche français ou étrangers, des laboratoires
publics ou privés.
Tree Growth
Fabien Wagner, Vivien Rossi, Melaine Aubry-Kientz, Damien Bonal, Helmut
Dalitz, Robert Gliniars, Clement Stahl, Antonio Trabucco, Bruno Herault
To cite this version:
Fabien Wagner, Vivien Rossi, Melaine Aubry-Kientz, Damien Bonal, Helmut Dalitz, et al..
Pan-Tropical Analysis of Climate Effects on Seasonal Tree Growth. PLoS ONE, Public Library of Science,
2014, 9 (3), �10.1371/journal.pone.0092337�. �hal-01268529�
Growth
Fabien Wagner1,2*, Vivien Rossi3,4, Me´laine Aubry-Kientz5, Damien Bonal6, Helmut Dalitz7,
Robert Gliniars7, Cle´ment Stahl2,8, Antonio Trabucco9,10, Bruno He´rault2
1 Remote Sensing Division, National Institute for Space Research - INPE, Sao Jose dos Campos, SP, Brazil, 2 Cirad, UMR 93 ‘‘Ecologie des Foreˆts de Guyane,’’ Kourou, France, 3 Cirad, UR 105 ‘‘Biens et services des e´cosyste`mes forestiers tropicaux,’’ Montpellier, France, 4 Universite´ de Yaounde´ 1, UMI 209 ‘‘Mode´lisation Mathe´matique et Informatique de Syste`mes Complexes,’’ Yaounde´, Cameroun,5 Universite´ des Antilles et de la Guyane, UMR 93 ‘‘Ecologie des Foreˆts de Guyane,’’ Kourou, France, 6 INRA, UMR EEF 1137, Champenoux, France,7 Institute of Botany, University of Hohenheim, Stuttgart, Germany, 8 CIRAD, UMR ‘‘Syste`mes d’Elevage en Milieux Me´diterrane´ens et Tropicaux,’’ Kourou, France,9 Euro-Mediterranean Centre for Climate Change, Sassari, Italy, 10 Division of Forest, Nature, and Landscape, KU Leuven, Leuven, Belgium
Abstract
Climate models predict a range of changes in tropical forest regions, including increased average temperatures, decreased total precipitation, reduced soil moisture and alterations in seasonal climate variations. These changes are directly related to the increase in anthropogenic greenhouse gas concentrations, primarily CO2. Assessing seasonal forest growth responses to
climate is of utmost importance because woody tissues, produced by photosynthesis from atmospheric CO2, water and
light, constitute the main component of carbon sequestration in the forest ecosystem. In this paper, we combine intra-annual tree growth measurements from published tree growth data and the corresponding monthly climate data for 25 pan-tropical forest sites. This meta-analysis is designed to find the shared climate drivers of tree growth and their relative importance across pan-tropical forests in order to improve carbon uptake models in a global change context. Tree growth reveals significant intra-annual seasonality at seasonally dry sites or in wet tropical forests. Of the overall variation in tree growth, 28.7% was explained by the site effect, i.e. the tree growth average per site. The best predictive model included four climate variables: precipitation, solar radiation (estimated with extrasolar radiation reaching the atmosphere), temperature amplitude and relative soil water content. This model explained more than 50% of the tree growth variations across tropical forests. Precipitation and solar radiation are the main seasonal drivers of tree growth, causing 19.8% and 16.3% of the tree growth variations. Both have a significant positive association with tree growth. These findings suggest that forest productivity due to tropical tree growth will be reduced in the future if climate extremes, such as droughts, become more frequent.
Citation: Wagner F, Rossi V, Aubry-Kientz M, Bonal D, Dalitz H, et al. (2014) Pan-Tropical Analysis of Climate Effects on Seasonal Tree Growth. PLoS ONE 9(3): e92337. doi:10.1371/journal.pone.0092337
Editor: Morag Mcdonald, Bangor University, United Kingdom
Received November 1, 2013; Accepted February 21, 2014; Published March 26, 2014
Copyright: ß 2014 Wagner et al. This is an open-access article distributed under the terms of the Creative Commons Attribution License, which permits unrestricted use, distribution, and reproduction in any medium, provided the original author and source are credited.
Funding: Funding came from the project Climfor (Fondation pour la Recherche sur la Biodiversite, www.fondationbiodiversite.fr/), from the project Guyasim (European structural fundings, PO-Feder, http://www.europe-guyane.eu/index.php?option = com_content&task = view&id = 14&Itemid = 206), and from the Fapesp (Fundac¸a˜o de Amparo a` Pesquisa do Estado de Sa˜o Paulo, processo 13/14520-6, http://www.bv.fapesp.br/pt/bolsas/146751/quantificacao-e-modelagem-da-sazonalidade-da-producao-primaria-liquida-florestal-pantropical-usando-/). This work has also benefited from an ‘‘Investissement d’Avenir’’ grant managed by Agence Nationale de la Recherche (CEBA, ref. ANR-10-LABX-0025). The funders had no role in study design, data collection and analysis, decision to publish, or preparation of the manuscript.
Competing Interests: Co-author Bruno Herault is a PLOS ONE Editorial Board member. This does not alter the authors’ adherence to PLOS ONE Editorial policies and criteria.
* E-mail: wagner.h.fabien@gmail.com
Introduction
Tropical forests are being threatened on an unprecedented scale by global changes. Temperatures across tropical forest regions are currently increasing [1] and are expected to continue to increase with a concomitant decrease in precipitation over the next decades [2–4]. Climate models predict a range of changes in tropical forest regions, including increased frequency of extreme climatic events, increased average temperatures, increased atmospheric CO2and
changes in seasonal distribution and interannual variability of rainfall [5–9]. Tropical forests play an important role in the mitigation of anthropogenic atmospheric CO2 emissions by
constituting a major reservoir of terrestrial carbon and a large and persistent carbon sink [10–12]. Feedback between tropical forests and the local and regional climate has also been demonstrated [4,13].
Tree growth is linked with atmospheric CO2 through
photo-synthesis. The last 20 years have seen a substantial increase in the number of publications focusing on the effects of climate on tropical tree growth. A search performed on Web of Science in March 2013 using the keywords ’climate’, ’tropical forest’, ’growth’ and ’trees’ returned fewer than 15 articles per year before 2000 and more than 60 articles in 2012, for a total of 541 articles focusing on the effect of climate on tropical tree growth. Long-term variations in tree growth have been reported on long-term forest plots, but the delong-terminants of these variations are still being discussed [14–19]. Due to the annual or multi-annual census frequency of long-term forest plots, most studies focus on the annual or multi-annual variation in tree growth even though most tropical forests undergo an intrannual seasonality in climate [1,6,20–22]. In single-site-based studies, seasonal rhythms of tree ´
growth have been linked to seasonal variations in water availability, rainfall, temperature and solar radiation (Table 1).
Rain or lack of rain is often implicitly viewed as the main drivers of forest dynamics [23], as annual net primary production (NPP) positively correlates with the annual sum of precipitation at large scales [24] and rainfall seasonality plays a key role in the forest’s response to climate variability [25]. The relation between the amount of rainfall and water availability for trees is not straightforward and is determined by various soil and plant characteristics (i.e. permanent wilting point, field capacity, root distribution). Consequently, water stresses are increasingly esti-mated using soil water balance models [26,27], including some that are explicitly designed for tropical forests [28]. Irradiance is directly linked to plant photosynthetic capacity, which in turn
drives carbon uptake and plant growth [29]. The occurrence of dry periods linked to cloud-cover reduction was found to enhance canopy photosynthetic capacity by 25% throughout Amazonia [30]. The effects of rising temperatures on the physiology of tropical trees are currently debated within the scientific commu-nity [21,32]. Some studies suggest that reductions in photosyn-thetic rates at temperatures above 30uC are driven by reductions in stomatal conductance in response to higher leaf-to-air vapour pressure deficits [31] or by a direct down-regulation of biochem-ical processes during CO2 fixation [33,33]. Recent studies,
however, suggest that tropical tree mortality may increase significantly with increasing night-time temperatures, while tree growth appears surprisingly sensitive to variations in mean annual night-time temperatures of 1–2uC [35].
Table 1. Expected tropical tree growth response to climate variables.
variable predicted effecta references processb
REW + [28,62] photosynthesis, xylem tension, stomatal closure, leaf flush rainfall + [19, 23, 24, 35, 58, 59, 61, 97–90] photosynthesis, xylem tension, stomatal closure, leaf flush
2 [89,91]
T mean 2 [31–33,92,93] photosynthesis kinetic, stomatal closure T min 2 [14,17,35,66] photosynthesis kinetic, stomatal closure
no [94,95]
T max 2 [19,31,33] photosynthesis kinetic, stomatal closure
+ [96]
no [94,95]
VPD no [97,98] stomatal closure, transpiration irradiance + [17,21,29,30,64,70,74] photosynthesis, phenology
2 [21]
no [17,63,70]
U* + [99] photosynthesis, transpiration
a
: expected growth response to the climate variable: (+) trees are expected to grow faster with high values of the climate variable, (2) trees are expected to grow slower with high values of the climate variable.b
: biological processes involve in the tree growth response to a given climate variation. VPD is vapour pressure deficit, and Friction velocity (U*) is a climate variable provided by eddy flux data, which is correlated with wind speed. Relative extractable water (REW), is a daily value between 0 and 1; when REW ~1, the amount of extractable water by the tree is at its maximum and when REW ~0, no water is available for the trees [28].
doi:10.1371/journal.pone.0092337.t001
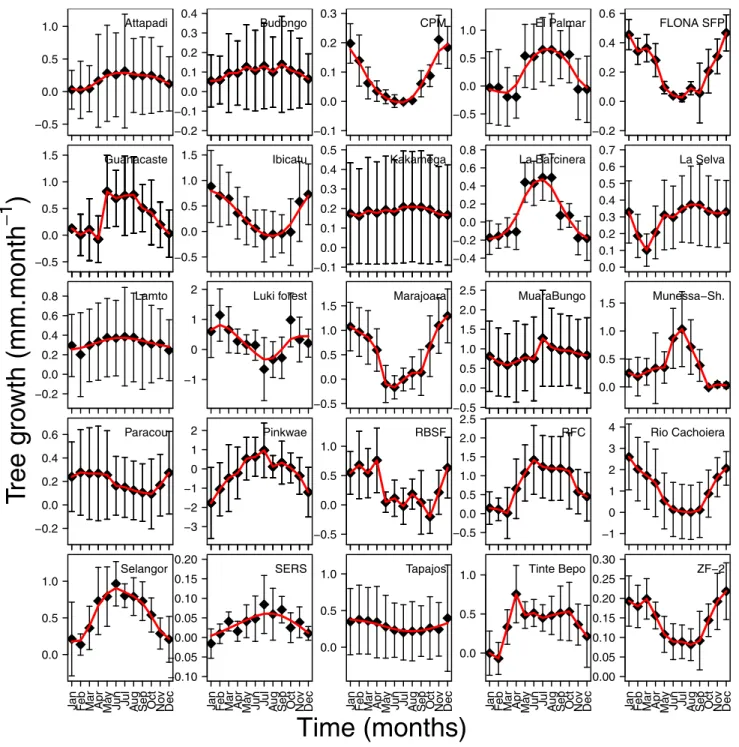
Table 2. Climate datasets used to model seasonal tropical tree growth at a pantropical scale.
climate variable full name unit origin
pre precipitation mm CRU-TS3.10.01
sola
Extraterrestrial solar radiation mm/month as equivalent of evaporation CGIAR-CSI
cld cloud cover % CRU-TS3.1
Pre Potential Evapotranspiration mm CRU-TS3.1 swc relative soil water content unit less CGIAR-CSI
tmp mean temperature uC CRU-TS3.1
tmn minimal temperature uC CRU-TS3.1
tmx maximal temperature uC CRU-TS3.1
vap vapour pressure hPa CRU-TS3.1
dtr temperature amplitude uC CRU-TS3.1
a
: sol per day (mm/day equivalent) is calculated using the methodology presented in [39] specifically for the 15thday of each month to describe averages per month. Total sol per month (mm/month equivalent) is calculated by multiplying the value of sol for the 15th day of the month by the number of days in the month, 1 mm.day21
equivalent of evaporation = 2.45 MJ.m22
.day21
. doi:10.1371/journal.pone.0092337.t002
Table 3. Description of the tree growth data. reference c ountry site Long. Lat. method time s cale No. of trees Type b duration (mm/yyyy) dbh growth mean ± SD (mm/ month) [78] Ghana Tinte Bepo 2 2.10 7.07 dendrometer band monthly 4 2 2 11/1997–3/199 9 0 .32 6 0.28 [43] Costa Rica Guanacaste 2 85.50 10.75 dendrometer band daily 19 3 2 /1978–1/1979 0 .27 6 0.33 [100] Ecuador RBSF 2 79.07 2 3.97 electronic point dendrometer daily 5 3 4/2006–2/2009 0 .27 6 0.38 [101] B razil Rio C achoiera 2 49.71 2 25.25 d endrometer band weekly 120 2 11/2007–9/200 8 1 .11 6 0.97 [35] Costa Rica La Selva 2 84.00 10.43 dendrometer band monthly 2 8 1 6/2006–11/200 8 0 .3 6 0.09 [44] DRC L uki forest 13.18 2 5.58 g raduated tape m onthly 30 2 5 /2006–7/2007 0 .19 6 0.59 [102] B razil ZF-2 2 60.12 2 2.59 d endrometer band Monthly 272 1 1/2000–12/200 0 0 .15 6 0.05 [103] Costa Rica Guanacaste 2 85.50 10.75 dendrometer band weekly 40 3 8 /1969–7/1970 0 .39 6 0.37 [104] French Guiana P aracou 2 52.91 5 .28 d endrometer band weekly 9 3 10/1979–6/198 2 0 .64 6 0.23 [105] Ivory Coast Lamto 2 5.03 6.22 dendrometer band daily 6 3 2/1973–7/1981 0 .28 6 0.2 [106] B razil Tapajos 2 54.97 2 2.85 d endrometer band monthly 7 34 3 1 2/2001–12/20 05 0.31 6 0.14 [107] Uganda Budongo 31.54 1 .73 d endrometer band monthly 3 18 3 7 /2003–12/200 9 0 .1 6 0.05 [19] Kenya K akamega 3 4.86 0.35 dendrometer band monthly 7 70 3 7 /2003–12/200 9 0 .19 6 0.03 [90] Brazil Marajoara 2 50.27 2 7.83 d endrometer band monthly 6 7 2 2/1997–11/200 1 0 .5 6 0.55 [90] Brazil Marajoara 2 50.27 2 7.83 d endrometer band monthly 4 0 3 1/1997–10/200 1 0 .51 6 0.55 [80] Ethiopia Munessa-Shashamene F orest 38.87 7 .43 electronic point dendrometer daily 4 3 4/2008–8/2009 0 .45 6 0.39 [108] Ghana Pinkwae 2 0.13 5.75 dendrometer band weekly 79 2 2 /1978–4/1979 2 0.2 6 0.78 [108] Ghana Pinkwae 2 0.13 5.75 dendrometer band weekly 2 3 3/1978–4/1979 2 0.24 6 0.79 [109] B razil Ibicatu 2 47.72 2 22.78 d endrometer band monthly 5 3 3 /1999–4/2006 0 .34 6 0.47 [110] M exico El Palmar 2 104.47 19.13 dendrometer band monthly 2 3 2 9/2002–8/2003 0 .24 6 0.36 [110] M exico La Barcinera 2 104.42 19.15 dendrometer band monthly 1 4 2 9/2002–8/2003 0 .09 6 0.29 [61] Brazil Tapajos 2 54.97 2 2.85 d endrometer band monthly 4 50 2 1 1/1999–5/200 1 0 .21 6 0.06 [111] M alaysia Selangor plantation 1 01.52 3 .51 d endrometer band weekly 6 3 1/1993–12/199 5 0 .55 6 0.32 [112] T hailand SERS 1 01.93 14.50 dendrometer band weekly 6 3 4/2004–2/2006 0 .04 6 0.04 [113] B razil CPM 2 50.50 2 29.00 tree ring a nalysis monthly 1 2 1 5/2005–5/2006 0 .08 6 0.08 [114] India Attapadi 7 6.45 11.08 dendrometer band monthly 1 01 3 3 /1980–10/198 3 0 .19 6 0.12 [79] French Guiana P aracou 2 52.91 5 .28 d endrometer bands weekly 161 3 6/2007–1/2009 0 .14 6 0.06 [115] Indonesia Muara Bungo 102.21 2 1.49 m eter monthly 4 0 3 4/2004–4/2006 0 .84 6 0.23 [116] Ecuador RBSF 2 79.07 2 3.97 electronic point dendrometer daily 1 3 4/2006–8/2009 0 .23 6 0.38 [117] V enezuela R FC 2 70.75 7 .50 d endrometer band monthly 6 3 4 /1978–4/1982 0 .75 6 0.52
A pantropical analysis of the effects of climate seasonality on tropical tree growth is still missing in the literature. Most of our knowledge comes from single-site-based studies that often suffer from collinearity problems between climate drivers. In this paper, we ran a meta-analysis of monthly tropical tree growth at the pan-tropical scale in which multiple gradients of climate variables allowed us to disentangle the effect of each climate driver on tropical tree growth. We focused on the seasonal effect of climate on tree growth in tropical forests by using data from papers reporting tree growth measurements with a high periodicity (from daily to monthly censuses) and global climate datasets. We gathered 30 datasets in which growth measurements have been recorded for 3412 individual trees from 25 pantropical forest sites. This paper has three specific objectives: (i) to find the climate drivers of tree growth across tropical forests; (ii) to quantify tree growth variations in response to climate among tropical forests; and (iii) to give a modeling framework to improve the model predictions of seasonal carbon uptake by tropical tree growth in a global change context.
Materials and Methods Climate datasets
We used climate datasets from two sources (Table 2): the Climate Research Unit (CRU) at the University of East Anglia [36] and the Consortium for Spatial Information website (CGIAR-CSI, http://www.cgiar-csi.org). From the CRU, we used variables from the CRU-TS3.1 and CRU-TS3.10.01 monthly climate global datasets available at 0.5u resolution from 1901– 2009: cloud cover (cld, unit:%); precipitation (pre, mm); daily mean, minimal and maximal temperatures (respectively tmp, tmn and tmx, uC); temperature amplitude (dtr, uC); vapour pressure (vap, hPa); and potential evapotranspiration (pet, mm). pet was calculated using the grass reference evapotranspiration equation [37,38], which is a variant of the Penman-Monteith method using the gridded tmp, tmn, tmx, vap and cld. pre was square-root transformed prior to data modeling to address heteroscedasticity. From the CGIAR-CSI, we used the monthly average of extraterrestrial solar radiation as well as the Global Soil-Water Balance [27]. The first dataset defines the solar radiation reaching the top of the Earth’s atmosphere (sol) and is a function of Earth-sun geometry and time of year. sol per day (mm/day equivalent) is calculated using the methodology presented in [39] specifically for the 15th day of each month to describe averages per month. Total sol per month (mm/month equivalent) is calculated by multiplying the value of sol for the 15th day of the month by the number of days in the month, 1 mm.day21 equivalent of evaporation = 2.45 MJ.m22.day21. The latter dataset provides hydrological raster data (ESRI Grid format) describing actual evapo-transpiration and soil water content for a monthly time-series from period 1901–2009 using CRU-TS3.1 as the primary climate data input. The monthly time-series of relative soil water content swc (unitless, 0–1) is calculated as the ratio of the soil water content from the soil water balance over the maximum available soil moisture (in mm water per 1 m soil depth, from the Digital Soil Map of the World and Derived Soil Properties [40,41]) along the ecosystem rooting depth [42].
Tree growth data
A search performed on Web of Science in March 2013 using the keywords ’climate’, ’tropical forest’, ’growth’ and ’trees’ returned 541 articles focusing on effect of climate on tropical tree growth. Among these publications, our analysis used only the publications with seasonal tree growth data (from daily to monthly censuses) available in the article graphics, available in an online repository
Table 3. Cont. reference c ountry site Long. Lat. method time s cale No. of trees Type b duration (mm/yyyy) dbh growth mean ± SD (mm/ month) [118] B razil FLONA SFP 2 50.42 2 29.42 d endrometer band monthly 2 3 9 /2003–7/2006 0 .23 6 0.19 Description o f the data used in this analysis, references, site location, site name, latitude and longitude in u, m ethod o f m easurement, number of trees, follow-up type ( b:T ype 1 :o nly mean and sd for the N trees of a site per month, Type 2 : m ean and sd by species for a site per month a nd Type 3 : one observation b y tree for a site per month.), follow-up duration and mean 6 standard deviation of monthly d iameter a t b reast height (dbh) growth. doi:10.1371/journal.pone. 0092337.t003
or provided by the authors. The tree growth data were extracted from the article graphics using WebPlotDigitizer 2.5 (http:// arohatgi.info/WebPlotDigitizer/, Table 3). Three types of data were found: (i) single observations by tree and time step at a given site (see [43]); (ii) mean and standard deviation (SD) by species at a given site for each time step (see [44]); and (iii) only the mean and SD of all trees at a site for each time step [35]. In addition, these data may come from measurements with dendrometer bands, electronic point surveys, tree ring analyses or graduated tapes. The minimum diameter at breast height (DBH) used in the articles is 10 cm. Among sites, Selangor and Muara Bungo are forest plantations. Finally, they have different time step between measurements: monthly, weekly or daily. We converted these primary datasets by making a linear approximation of the growing trajectory in order to obtain a mean and a standard deviation by month and dataset for each available calendar year. Datasets from the same site were assumed to be samples from the same population and were not analyzed separately. This could affect the value of the whole population mean growth, but here we are only interested in the monthly variations of tree growth (site effect is considered as a random effect). The final dataset is comprised of 30 datasets of 25 pantropical forest sites, for a total of 3412 individual trees (Figure 1, Table 3). The data, monthly tree growth mean and SD, are freely available upon request to the corresponding author. No specific permits were required for the described field studies and this study did not involve endangered or protected species.
Preliminary analysis
First, we investigated the association between climate variables on a monthly time scale through a principal component analysis (PCA) on the normalized climate dataset, i.e. climate variables were centred and scaled, to describe how the variance of the climate dataset was structured. Next, to measure spatial autocor-relation in tree growth observations between sites, we computed the Moran’s Index statistics of the mean monthly growth by sites [45]. This index range from -1, strong negative spatial autocor-relation, to +1, strong positive spatial autocorrelation. The significance of Moran’s I is evaluated by using a Z score and p-value generated by random permutation [46]. The null hypothesis states that there is no spatial autocorrelation for the variable within the geographic area. The interannual and intra-annual variability climate variable was described by computing the coefficient of variation (CV) for each variable (i.e. standard deviation 6 100 divided by the mean) of the annual mean and monthly values of the climate time series over the period of the CRU data (1901–
2009). To detect, estimate and test seasonal patterns in the tree growth time series, we used temporal regression models from the R package season [47]. The model was fitted using a sine and cosine term that together described the sinusoid. These parameters were added to a generalized linear model to explain tree growth data and test the existence of a seasonal pattern. The existence of a seasonal pattern was determined by the zero-test based on Snedecor’s F statistic. This method is known as the cosinor test.
Modeling seasonal tree growth
We modeled the link between tree growth, site and climate variables in a mixed linear model framework at a monthly time step. Here, we assumed that each growth measurement was independent and that our multiple-site design enabled us to deal with the collinearity of climate variable present in each site. We set the climate variables as fixed effects and the site as a random effect. We set the site effect as a random effect in order to avoid any statistical bias in our results. This site effect was not further analyzed as the main objective of the study was to understand seasonal variations of tree growth. In order to rank the climate effects, we considered various growth models:
N m0, the reference model:
Inci,j~b0zfizei,j ð1Þ
Nmvarclim, for each climate variable varclim, an univariate
model:
Inci,j~b0zfizbvarclim|varclimi,jzei,j ð2Þ
NmBIC, the model with the best combination of climate variables, CombBIC, according to the Bayesian Information
Criterion (BIC): Inci,j~
b0zfiz X
varclim[CombBIC
bvarclim|varclimi,jzei,j ð3Þ
Where Inci,jis the average tree diameter growth for the site i for
the month j, fi is the random site effect assumed to follow a
normal distributionN (0,s2
site) and ei,jis the residual error assumed
Figure 1. Locations of the 25 study sites and their countries (grey areas). 1: Attapadi; 2: Budongo; 3: CPM; 4: El Palmar; 5: FLONA SFP; 6: Guanacaste; 7: Ibicatu; 8: Kakamega; 9: La Barcinera; 10: La Selva; 11: Lamto; 12: Luki forest; 13: Marajoara; 14: Muara Bungo; 15: Munessa-Shashamene Forest; 16: Paracou; 17: Pinkwae; 18: RBSF; 19: RFC; 20: Rio Cachoiera; 21: Selangor plantation; 22: SERS; 23: Tapajos; 24: Tinte Bepo; 25: ZF-2. doi:10.1371/journal.pone.0092337.g001
Table 4. Descriptive statistics of climate variables. site GES a pre pet tmn tmp tmx d tr swc vap cld s ol Attapadi T Ar 2158 (18.1/100.5) 1 498.3 (1.9/19.9) 2 1.4 (2.1/5.8) 25.7 (1.8/5.2) 3 0.2 (1.7/6.2) 8.8 (3.8/19.6) 0.8 (3.4/30.6) 24.7 (2.5/9.3) 50.5 (2 .5/38.2) 5214.7 (0/7.7) Budongo TAr 1 322.1 (15.4/41.6) 1363.8 (2.8/10) 17.5 (4/3.1) 23.4 (2.9/3.5) 2 9.3 (2.4/4.4) 1 1.9 (3/9) 0.8 (8/20.2) 2 0.5 (4.2/5.5) 59.9 (3.5/9.3) 531 3.8 (0/3.3) CPM SCf 1741.4 (16.9/13) 935.1 (2.4/34.2) 1 2.1 (4/27.4) 16.5 (2.6/20.6) 21 (1.9/16.8) 9 (2.4/5.1) 1 (2.3/1.5) 15.3 (3.3/21.4) 65.8 (2.7/5.9) 4745 (0 /28.4) El Palmar TAwa 1076.3 (26.8/116.9) 1 414.3 (2.4/12.9) 1 7.7 (2.6/16.7) 24.6 (1.6/7.1) 3 1.6 (1.4/4) 13.9 (3.3/20.5) 0.6 (9.1/42.1) 21 (1.8/15) 55.5 (4 .7/22.9) 5028.8 (0/14.5) FLONA SFP SCf 1643.1 (16.2/13.6) 888.7 (2.6/32.7) 1 1.6 (4.1/28.2) 15.9 (2.7/20.7) 20.2 (1.9/16.4) 8.6 (2.3/3.4) 0.9 (4.1/4.7) 1 5 (3.4/21.5) 66.8 (2 .5/6.5) 4729.1 (0/28.8) Guanacaste TAwb 1749.7 (24/86.8) 1606.9 (2.8/19) 21.1 (2.7/3.3) 26.8 (2.1/3.4) 3 2.5 (1.7/4.1) 1 1.4 (0.6/9.8) 0.9 (5.1/20.2) 28.2 (2.7/6.5) 49.9 (2 /20.1) 5220.8 (0/7.4) Ibicatu TAwa 1518.2 (22/59.8) 1097.7 (2.5/18.9) 1 6.1 (5/17.3) 21.3 (3.4/11) 26.6 (2.6/7.4) 1 0.5 (3.8/8.8) 0.9 (10.1/14.3) 18.2 (3.9/18.1) 73.7 (0. 9/10.1) 4966.1 (0/22.3) Kakamega T M 1 770.9 (14.4/37) 1501.1 (2.7/13.3) 1 4 (4.3/3.9) 21.4 (2.7/3.2) 2 8.8 (2.2/4.1) 1 4.9 (2.8/8.1) 0.9 (7/15.7) 1 5.5 (3.5/6.5) 62.9 (3.6/6.3 ) 5 317.5 (0/3.8) La Barcinera TAwa 1076.3 (26.8/116.9) 1 414.3 (2.4/12.9) 1 7.7 (2.6/16.7) 24.6 (1.6/7.1) 3 1.6 (1.4/4) 13.9 (3.3/20.5) 0.6 (11.5/40.2) 21 (1.8/15) 55 .5 (4.7/22.9) 5028.8 (0/14.5) La Selva TAr 3 948.1 (19.4/44.7) 1358.2 (3.7/13.5) 1 7.9 (3.9/3.4) 23.1 (3/2.6) 28.3 (2.4/3.4) 1 0.4 (0.6/10.3) 1 (1.7/2.9) 23.5 (3.4/5) 52.9 (2.9/13. 1) 5225.8 (0/7.2) Lamto TAr 1 381.5 (21.3/60.9) 1122.5 (1.5/15.4) 2 1.8 (1.5/3.7) 26.5 (1.2/3.7) 3 1.2 (1.1/5.3) 9.4 (2.5/18.1) 0.9 (5.7/16.5) 27.3 (2/4.8) 77.2 (1.1/1 5.8) 5282.3 (0/4.3) Luki forest TAr 1 069.1 (18.4/83.7) 947.8 (1.3/12.8) 2 0.8 (1.3/8.9) 24.6 (1.1/8.5) 2 8.6 (1/8.2) 7.8 (0/7.8) 0.8 (6.3/17.1) 24.8 (1.7/11.6) 87.2 (0.8 /5.9) 5301.4 (0/7.6) Marajoara TAr 1 873.6 (12.8/74.2) 1068.4 (2.6/14.9) 1 9.5 (3.5/4.8) 25.6 (2.6/1.7) 3 1.8 (2.1/4.3) 1 2.3 (0/17.5) 0.8 (4.5/21.6) 28.5 (3/4.1) 77.2 (0. 2/20.6) 5281.7 (0/9.4) Muara Bungo TAr 2 686.8 (14.6/34.2) 1260.5 (2.9/4.7) 22.9 (2/1.6) 27.2 (1.7/1.3) 3 1.6 (1.6/1.8) 8.7 (3.5/7.3) 1 (4.8/3.5) 29.9 (2.4/1.9) 68.4 (3.1/7 ) 5 318.1 (0/4.8) Munessa-Shashamene Forest TM 1192 (15.3/56.6) 1203.5 (3.8/12.9) 1 0.1 (5.4/17.5) 17 (3.2/5.2) 23.8 (2.7/6.9) 1 3.7 (3.8/21.3) 0.8 (10/25.5) 13.1 (4.2/13.5) 42.9 (10.7/37.1) 5 268.6 (0/5) Paracou T Ar 3025.2 (17.3/64.6) 1246.2 (1.9/16.7) 2 2.5 (2.2/0.9) 26.3 (1.9/2.2) 3 0.1 (1.6/3.9) 7.6 (0/16.3) 0.9 (4.2/20.2) 29.5 (1.6/1.9) 58.7 (1.7 /24.3) 5291.3 (0/3.8) Pinkwae TAwb 998.1 (22.2/64.7) 1255 (2.1/11.7) 24.1 (2/2.2) 27.5 (1.7/3.7) 3 0.9 (1.4/5.2) 6.8 (2.9/18.7) 0.7 (12.3/26.3) 27.7 (2.2/3.2) 73.6 (1.9/ 14.5) 5287.1 (0/4) RBSF T M 9 73.9 (35.2/65.6) 1439.9 (4.8/12) 4.7 (10.8/19.4) 13.1 (3.8/3) 21.7 (2.3/2.6) 1 7 (0.8/7.8) 0.5 (17/50) 1 1.4 (5.3/6.1) 75 (1.9/10) 5 311 (0/6. 4) RFC T Awa 1696.7 (13.7/70.8) 1184.6 (7.4/15.4) 2 2.3 (3.3/2.5) 27.3 (1.6/2.8) 3 2.4 (1.9/4.8) 1 0.1 (10.2/17.7) 0.9 (4/19.6) 2 7.6 (3.1/6.9) 82 (7.8/10 ) 5 268 (0/5.1) Rio C achoiera SCf 1526.6 (18.4/27) 913.4 (3/24.7) 1 2.6 (5.8/26.9) 18.1 (3.6/16.1) 23.7 (2.5/10.5) 11.1 (3/7.8) 1 (3.6/1.7) 16.5 (4.2/18.1) 78.1 (2. 1/6.8) 4884.2 (0/24.7) Selangor plantation T Ar 2840.3 (16.7/29.7) 1065.9 (3/8.4) 20.3 (3/1.7) 24.7 (2.1/1.5) 2 9.1 (1.5/2.1) 8.7 (3.7/8) 1 (1.8/1.5) 27.4 (2.6/2.6) 72.7 (2 .6/10.6) 5304.8 (0/3.2) SERS T Awb 1558.7 (12.6/81) 1284.1 (2.7/14.7) 2 1.6 (2.5/10.9) 26.7 (1.7/6.5) 3 1.9 (1.4/5.5) 1 0.2 (4/21.7) 0.7 (5.7/37.8) 26.9 (2.1/14.8) 59.5 (4.4/ 34.2) 5147.3 (0/10.5) Tapajos T Ar 1958.8 (19.9/63.6) 1126.8 (1.4/18.1) 2 1.8 (1.6/2.1) 26.5 (1.4/2.3) 3 1.2 (1.2/3.4) 9.4 (1.4/11.4) 0.9 (6.4/17.8) 29.7 (2/1.4) 75.5 (0.3 /18.4) 5315.2 (0/5.7) Tinte Bepo TAr 1 246.7 (15.5/61) 1123 (1.6/15.9) 21.8 (1.8/5.8) 26.5 (1.4/5.4) 3 1.3 (1.4/6.7) 9.5 (2.9/20.4) 0.8 (5.3/20.4) 25.1 (2.6/10) 75.7 (1.6/ 16.4) 5273.1 (0/4.8) ZF-2 TAr 2 232 (12.5/46.6) 1161.1 (1.9/16) 23.2 (1.7/1.1) 27.4 (1.3/1.8) 3 1.6 (1.3/2.7) 8.4 (4.5/9.7) 0.9 (5.5/11.2) 30.3 (2/2.3) 82.2 (1/13.6) 5316 (0/5.5) Descriptive statistics of climate variables: Annual mean; coefficient o f variation o f a nnual m eans (CV i nter ) a nd coefficient o f variation o f monthly values (CV i ntra ) o f p recipitation (pre); potential e vapotranspiration (pet); minimal, mean and m aximal temperatures (respectively tmn, tmp a nd tmx); daily temperature amplitude (dtr); soil water content (swc); vapour pressure (vap); cloud cover (cld); and extraterrestrial solar radiation (sol). Coefficients of variations (standard deviation d ivided by the mean o f the variable) of monthly climate time series are computed over the p eriod o f the CRU data (1901–2 009). aGlobale Ecological Z one d efined by FAO [55]; T Ar: Tropical rainforest; TAwa: Tropical moist deciduous forest; TAwb: Tropical dry forest; TM: Tropical mountain system; and S Cf: S ubtropical humid forest. doi:10.1371/journal.pone. 0092337.t004
to follow a normal distribution N (0,Nobsi|s2) weighted by
1=Nobsi, which is the inverse of the number of observation periods
by site. The mixed model parameters were estimated with the algorithms of the R package lme4 [48]. To estimate the parameter confidence intervals with a probability of 95%, we generated 10000 parameter samples from the posterior distribution of the fitted model parameters using the Markov Chain Monte Carlo methods [48]. Then, the confidence intervals for the parameters (Highest Posterior Density [HPD] intervals) were constructed from the empirical posterior distribution of the 10000 samples as the intervals containing the parameters with the nominal probability [48]. Evaluation of the model performance was made by computing goodness-of-fit-measures with the R package lmmfit [49–52]. To find the best variable linear combination that contains the maximum of information to link growth and climate variables (the model mBIC), we ran an exhaustive screening of the candidate
models using a stepwise procedure based on the Bayesian information criterion, BIC [53]. We used BIC, instead of the classically used AIC, to avoid over-parameterization and multi-collinearity problems, as this criterion is consistent and parsimo-nious for model selection with respect to large datasets [54]. We made a residual analysis to verify if the error of the model mBIChad
a bias for any of the selected variables in this model. That is, we computed the Pearson’s product-moment correlation coeffiecient (r) between the residual of the model mBICand the variables of this
model and tested if this coefficient was statistically or different not from zero.
The predictive quality of the fitted models was assessed by computing the root mean square errors of predictions, RMSEP.
RMSEP~ X Nsite i~1 X Nmonth j~1
(Inci,j{IncIncdi,ji,j)2
Nsite|Nmonth
ð4Þ
where Inci,jis the observed values of tree growth for the site i
and for the month j, andInc
b
i,jare the model predictions of growth. All analyses were performed using the R-project software (http://www.r-project.org/).Results
Climate gradients
The 25 sites represent a large sample of tropical forests under different tropical climates corresponding to five global ecological tropical zones [55](Table 4). The gradient of the annual mean of precipitation ranges from 973.9 mm (RBSF, Ecuador) per year to 3948.1 mm (La Selva, Costa Rica). The coefficient of variation (CV) of interannual precipitation ranges from 12.5% (SERS, Thailand) to 35.2% (RBSF, Ecuador). Intra-annual CV of monthly precipitation distribution precipitation ranges from 13% (CPM,Brazil) to 116.9% (El Palmar and La Barcinera, Mexico). The sites undergo a large variability in the distribution of precipitations throughout the year, from zero months (La Selva)
Figure 2. Principal component analysis of the climate variables. cld: cloud cover; pre: precipitation; sol: extraterrestrial solar radiation; tmp, tmn and tmx are respectively the daily mean, minimal and maximal temperatures; dtr: temperature amplitude; vap: vapour pressure; pet: potential evapotranspiration; and swc: relative soil water content. (a) correlation circle of axis 1 and 2; (b) correlation circle of axis 1 and 3; (c) projection of the country classes on the pca axis, India (Indi), Uganda (Uga), Brazil (Bra), Mexico (Mex), Costa Rica (CR), Kenya (Ken), Ivory Coast (IC), DRC (DRC), Indonesia (Indo), Ethiopia (Eth), French Guiana
(FG), Ghana (Gha), Ecuador (Ec), Venezuela (Ven), Malaysia (Ma), Thailand (Th); (d) projection of the continental classes on the pca axis; and (e) projection of the global ecological zones on the pca axis (i.e. Tropical rainforest, Tropical moist deciduous forest, Tropical dry forest, Tropical mountain system and Subtropical humid forest). Note that axis 1 and 2 explain 41.70% and 28.12% of the total variation respectively, (a). The third axis explained 11.30% of the variance and was linked negatively to sol and pre, (b).
doi:10.1371/journal.pone.0092337.g002
v u u t
to 8–9 months with less than 100 mm of rain (Lamto, Tinte Bepo, Pinkwae, RBSF). The relative soil water content exhibits the same annual pattern, ranging from sites without seasonality, intra-annual CVswc , 3.5% (Cpm, La Selva, Muara Bungo, Rio
Cachoiera and Selangor), to sites with an intra-annual CVswc.
37.8% (El Palmar, la Barcinera, RBSF). The annual average of relative soil water content is above 60% for 24 of the 25 sites. The annual cloud cover mean ranges from 42.9% (Munessa-Shasha-mene, Ethiopia) to 87.2% (Luki Forest, DRC) and its intra-annual variation is similar to the intra-annual variation of precipitation.
Three major climate gradients are represented in the Principal component analysis (PCA)(Figure 2). The first axis (x-axis in Figure 2a) represents a gradient of increasing temperature, that is highly correlated with vapour pressure. Sites close to the equator that are located at high altitudes are on the left of this axis, with sites far from the equator experiencing a cold season (Figure 2e). The second axis (y-axis in Figure 2a) has a strong contribution from variables that reflect water availability. The third axis (y-axis in Figure 2b) appears to be related to solar radiation. Ordination of the continental location of the studied sites on the PCA axis (Figure 2d) revealed that sites in Asia were slightly warmer and had higher vapour pressures than those in America and Africa. Ordination of the studied countries on the PCA axis (Figure 2c) reveals that some countries are separated from others because of
climate: from cold (Ecuador) to warm (Indonesia) and from dry tropical (Mexico) to wet tropical (Malaysia)(Figure 2e). In the following analysis, we kept all the climate variables as we have a strong physiological assumption of their effect on tree growth (Table 1).
Tree growth descriptive analysis
We cannot reject the null hypothesis that there is no spatial autocorrelation present in mean tree growth observations between sites at alpha = 0.05 (Moran’s I observed = 0.0102, expected = 2 0.042, SD 0.123, p.value = 0.672). Tree diameter growth shows a significant intra-annual seasonality at all the studied sites, even sites with mean annual precipitation rates close to 4000 mm (La Selva, Costa Rica)(Table 5 and Figure 3).
Climate effects on tree growth
More than 28.69% of the observed seasonal variation in tree growth may be imputable to the site effect (reference model m0,
Table 6), while climate variables alone explain a maximum of 19.82% (squared root monthly precipitation). The variables sol, cld, vap, dtr, tmn and swc explained between 9.65 and 16.30% of the climate effect, while tmp, pet and tmx explained less than 2.13%. The selection procedure, which used the BIC criterion, kept four climatic variables (pffiffiffiffiffiffiffipre, sol, dtr, swc) in the final multivariate Table 5. Seasonality of mean monthly tree growth with cosinor analysis for the studied sites.
Site Amplitude Phase Low phase p value
Attapadi 0.129 Month = 7.6 Month = 1.6 ,0.05 Budongo 0.031 Month = 7.3 Month = 1.3 ,0.05
CPM 0.104 Month = 12.2 Month = 6.2 ,0.05
El Palmar 0.437 Month = 7.7 Month = 1.7 ,0.05 FLONA SFP 0.213 Month = 1.1 Month = 7.1 ,0.05 Guanacaste 0.396 Month = 7.3 Month = 1.3 ,0.05 Ibicatu 0.470 Month = 1.5 Month = 7.5 ,0.05 Kakamega 0.019 Month = 7.5 Month = 1.5 ,0.05 La Barcinera 0.361 Month = 6.8 Month = 12.8 ,0.05
La Selva 0.092 Month = 9 Month = 3 ,0.05
Lamto 0.067 Month = 6.9 Month = 12.9 ,0.05
Luki forest 0.535 Month = 1.4 Month = 7.4 ,0.05 Marajoara 0.684 Month = 12.6 Month = 6.6 ,0.05 Muara Bungo 0.211 Month = 8.6 Month = 2.6 ,0.05 Munessa-Shashamene Forest 0.380 Month = 6.4 Month = 12.4 ,0.05 Paracou 0.091 Month = 2.6 Month = 8.6 ,0.05
Pinkwae 1.033 Month = 7 Month = 13 ,0.05
RBSF 0.361 Month = 2.2 Month = 8.2 ,0.05
RFC 0.645 Month = 7.6 Month = 1.6 ,0.05
Rio Cachoiera 1.235 Month = 1.3 Month = 7.3 ,0.05 Selangor plantation 0.380 Month = 6.7 Month = 12.7 ,0.05
SERS 0.033 Month = 7.4 Month = 1.4 ,0.05
Tapajos 0.089 Month = 1.9 Month = 7.9 ,0.05 Tinte Bepo 0.223 Month = 6.9 Month = 12.9 ,0.05
ZF-2 0.066 Month = 1.1 Month = 7.1 ,0.05
Month = 1 corresponds to January. The amplitude is the difference between the higher and lower points in mm.month21
of the sinusoid fitted in the cosinor analysis. The phase and the low phase are, respectively, the month with the highest/lowest tree growth value according to the sinusoid fitted in the cosinor analysis. A P valuev0:05 indicates that the statistically significant existence of a seasonal pattern cannot be rejected.
model mBIC (Table 6). These four climate variables together
explained 29.79% of the total observed monthly tree growth variation. The parameter values for the fixed effect in the univariate analysis indicate the direction of the relation between the climate variables and tree growth (Table 6). Among the four selected variables, pre (0.03), swc (0.58) and sol (0.09) have a positive link with tree growth and dtr (20.08) has a negative link (Table 6). The obtained root mean squared error of prediction (RMSEP) was slightly below the mean value of observed monthly growth in diameter (mean growth = 0.325 mm.month21, RMSEP = 0.279 mm.month21). In general, the model
underesti-mated growth when it was above 1 mm.month21 (Figure 4). There was no significant correlation between the selected variable and the residuals of the model mBIC(r ffiffiffiffiffippre = 4.661026, pvalue .
0.99; rsol = 1.861025, pvalue . 0.99; rdtr= 1.961024, pvalue .
0.99; rswc = 6.161026, pvalue . 0.99). Tree growth values
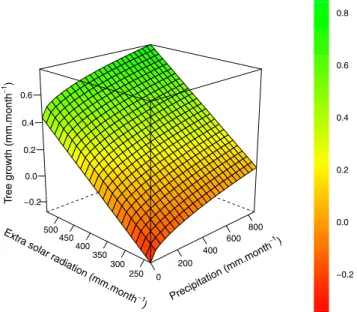
increase linearly with extrasolar radiations (Figure 5), and a strong increase in tree growth occurred between 0 and 200 mm month21of precipitation; above these values, the increase in tree growth was less pronounced and had a linear shape.
.
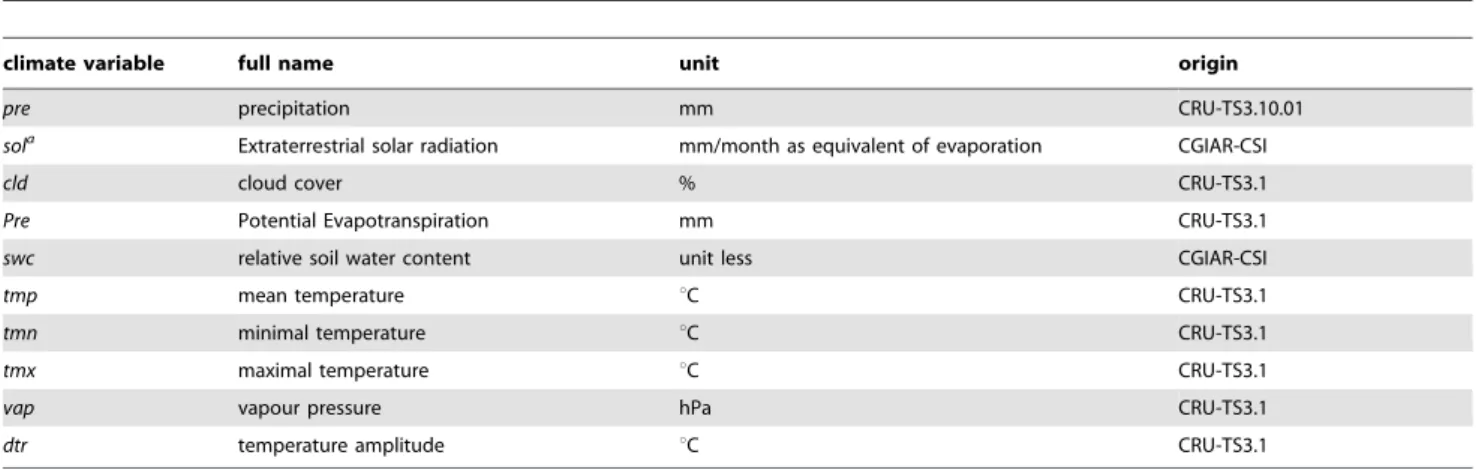
Figure 3. Evolution of mean monthly tree growth values and standard deviation for the studied forest sites. The red line represents a cubic smoothing spline.
Table 6. Model parameters, standard errors, t values and posterior densities of the univariate (m v arclim ) and complete (m BIC ) analyses. Model Parameter Effect Estimates Std. Error t value Variance Std. Dev. MCMC median MCMC mean HPD95 lower HPD95 upper pMCMC Pr( . |t|) RMSEP BIC R2 fixed R2 mBIC site.names random 0.0355 0.1885 0.1577 0.1596 0.1184 0.2038 0.2787 4 12.4698 29.79 50.25 Residual random 0.0800 0.2829 0.2845 0.2846 0.2713 0.2975 (Intercept) fixed 2 0.7247 0.1635 2 4.4336 2 0.7492 2 1.0585 2 0.4339 0 .0001 0.0000 I(pre ‘0.5) fixed 0 .0118 0.0027 4.4017 0 .0120 0.0067 0.0171 0 .0001 0.0000 sol_m fixed 0 .0024 0.0002 10.3592 0 .0024 0.0019 0.0028 0 .0001 0.0000 dtr fixed 2 0.0300 0.0078 2 3.8291 2 0.0283 2 0.0430 2 0.0139 0 .0002 0.0001 swc fixed 0 .2426 0.0674 3.5999 0 .2492 0.1196 0.3817 0 .0002 0.0003 m pre p site.names random 0.0346 0.1861 0.1588 0.1608 0.1192 0.2057 0.2983 5 15.5249 19.82 42.99 Residual random 0.0914 0.3023 0.3038 0.3040 0.2901 0.3184 (Intercept) fixed 2 0.0158 0.0394 2 0.4006 2 0.0157 2 0.0860 0.0562 0 .6666 0.6888 I(pre ‘0.5) fixed 0.0303 0.0020 15.1909 0.0303 0.0264 0.0343 0.0001 0.0000 msol site.names random 0.0414 0.2034 0.1695 0.1715 0.1296 0.2177 0.3043 5 56.2737 16.30 40.67 Residual random 0.0951 0.3084 0.3103 0.3104 0.2956 0.3245 (Intercept) fixed 2 1.0027 0.1042 2 9.6261 2 0.9997 2 1.1959 2 0.7884 0 .0001 0.0000 sol_m fixed 0 .0030 0.0002 13.4849 0 .0030 0.0026 0.0035 0 .0001 0.0000 mcld site.names random 0.0333 0.1825 0.1576 0.1594 0.1183 0.2040 0.3065 5 63.8953 15.56 39.81 Residual random 0.0965 0.3106 0.3120 0.3122 0.2975 0.3264 (Intercept) fixed 2 0.4837 0.0691 2 6.9952 2 0.4766 2 0.6100 2 0.3444 0 .0001 0.0000 cld fixed 0 .0115 0.0009 13.1090 0 .0114 0.0097 0.0132 0 .0001 0.0000 Mpre site.names random 0.0345 0.1856 0.1601 0.1621 0.1193 0.2073 0.3078 5 71.9796 14.82 39.34 Residual random 0.0972 0.3118 0.3133 0.3135 0.2992 0.3284 (Intercept) fixed 0 .1542 0.0352 4.3855 0 .1542 0.0933 0.2184 0 .0001 0.0000 pre fixed 0 .0011 0.0001 12.7430 0 .0011 0.0009 0.0013 0 .0001 0.0000 mdtr site.names random 0.0705 0.2655 0.1957 0.1982 0.1523 0.2514 0.3060 5 79.4892 14.60 40.01 Residual random 0.0962 0.3102 0.3134 0.3136 0.2998 0.3290 (Intercept) fixed 1 .2160 0.0842 14.4368 1 .1559 0.9919 1.3130 0 .0001 0.0000 dtr fixed 2 0.0840 0.0066 2 12.655 2 0.0783 2 0.0925 2 0.0650 0 .0001 0.0000 mvap site.names random 0.1335 0.3653 0.2128 0.2152 0.1607 0.2740 0.3063 5 96.8096 13.87 39.89 Residual random 0.0964 0.3105 0.3167 0.3169 0.3017 0.3314 (Intercept) fixed 2 1.1021 0.1306 2 8.4356 2 0.8118 2 1.0723 2 0.5445 0 .0001 0.0000 vap fixed 0 .0593 0.0048 12.3119 0 .0472 0.0368 0.0579 0 .0001 0.0000 mswc site.names random 0.0319 0.1785 0.1564 0.1582 0.1146 0.2039 0.3174 6 25.9566 9.77 3 5.49 Residual random 0.1034 0.3215 0.3229 0.3230 0.3082 0.3382 (Intercept) fixed 2 0.1696 0.0580 2 2.9216 2 0.1715 2 0.2826 2 0.0609 0 .0038 0.0036
Table 6. Cont. Model Parameter Effect Estimates Std. Error t value Variance Std. Dev. MCMC median MCMC mean HPD95 lower HPD95 upper pMCMC Pr( . |t|) RMSEP BIC R2 fixed R2 swc fixed 0 .5807 0.0578 10.0435 0 .5837 0.4723 0.7025 0 .0001 0.0000 mtmn site.names random 0.0944 0.3072 0.2038 0.2063 0.1523 0.2625 0.3143 6 35.0120 9.65 3 6.71 Residual random 0.1015 0.3186 0.3231 0.3233 0.3085 0.3387 (Intercept) fixed 2 0.8685 0.1291 2 6.7262 2 0.6662 2 0.9239 2 0.4010 0 .0001 0.0000 tmn fixed 0 .0623 0.0062 10.0385 0 .0517 0.0393 0.0656 0 .0001 0.0000 mtmp site.names random 0.0396 0.1989 0.1693 0.1716 0.1238 0.2187 0.3299 7 01.8122 2.13 3 0.27 Residual random 0.1117 0.3343 0.3359 0.3361 0.3210 0.3522 (Intercept) fixed 2 0.3704 0.1566 2 2.3648 2 0.3351 2 0.6345 2 0.0317 0 .0266 0.0182 tmp fixed 0 .0283 0.0063 4.5113 0 .0269 0.0146 0.0388 0 .0001 0.0000 mpe t site.names random 0.0329 0.1814 0.1600 0.1620 0.1178 0.2075 0.3320 7 09.0369 1.40 2 9.38 Residual random 0.1132 0.3364 0.3377 0.3379 0.3219 0.3532 (Intercept) fixed 0 .5525 0.0724 7.6338 0 .5589 0.4147 0.6951 0 .0001 0.0000 pet fixed 2 0.0023 0.0006 2 3.6135 2 0.0023 2 0.0036 2 0.0011 0 .0002 0.0003 mtmx site.names random 0.0400 0.2000 0.1717 0.1738 0.1278 0.2217 0.3334 7 21.5133 0.05 2 8.78 Residual random 0.1141 0.3378 0.3395 0.3396 0.3234 0.3550 (Intercept) fixed 0 .4356 0.1755 2.4825 0 .4047 0.0543 0.7394 0 .0190 0.0132 tmx fixed 2 0.0039 0.0058 2 0.6821 2 0.0029 2 0.0141 0.0086 0 .6180 0.4954 m0 site.names random 0.0385 0.1962 0.1696 0.1717 0.1270 0.2214 0.3337 7 15.0984 0.00 2 8.69 Residual random 0.1142 0.3379 0.3395 0.3396 0.3240 0.3551 (Intercept) fixed 0 .3184 0.0347 9.1815 0 .3187 0.2571 0.3784 0 .0001 0.0000 Model p arameters, standard errors and t-values. The p arameter values of posterior parameters densities (MCMC median and MCMC mean) and their 95% con fidence intervals (Highest posterior density at 95% [HPD95] lower and upper) and associated p-value are estimated from a distribution of 10000 p arameter samples computed with Monte C arlo Markov Chains from the model par ameters. Goodness-of-fit criterion o f the growth models are root mean square error of prediction (RMSEP), Bayesian Information C riterion (BIC), R 2of the fixed part of the model (R 2fixed )a n d R 2of the complete model (fixed plus random part). doi:10.1371/journal.pone. 0092337.t006
Discussion
Our meta-analysis provides the first overview of climate effects on tree growth variations at a seasonal time scale for tropical forest areas. Tree growth reveals a strong intra-annual seasonality at all sites (Table 5), including seasonally dry sites and wet tropical forests. We found a common climatic signal explaining 29.79% of the observed seasonality in forest growth (Table 6). Precipitation (19.82%) and extraterrestrial solar radiation (16.30%) were the major climate drivers. The tree growth average per site (i.e. the random site effect) explained 28.69% of overall growth variation, and a substantial fraction of variation (50%) in growth remained unexplained with our modeling framework. We have to acknowl-edge than our sample of 3412 trees could not be used to fully reproduce the complete behavior of all the tropical forests, however our analysis demonstrated that a common signal in the climate determinism of tree growth seasonality is observed at the pan-tropical scale.
Climate effect on tree growth
In this study, precipitation was found to be the major seasonal driver of tree growth. Precipitation strongly impacts tree growth, as directly observed in seasonal and unseasonal tropical climates [19,35,56–59] and as deduced from experimental forest droughts [60,61]. The prominence of precipitation as a predictor of forest growth is slightly different from previous studies [62]; in French Guiana, we found that soil water availability was the main determinant of diameter growth, i.e. better than rainfall. Of course, both variables are strongly correlated (Figure 2), but this difference could be explained by some sites where relative soil water availability swc was at its maximum throughout the year despite marked precipitation seasonality (e.g. La Selva, CPM, Muara Bungo, Rio Cachoiera and Selangor). At the same time, the importance of solar radiation, sol, in the complete model (mBIC)
reflects the obvious role of light in shaping tree growth (Figure 5).
Solar radiation is directly linked to PPFD (Photosynthetic Photon Flux Density), which in turn drives carbon uptake and plant growth [29]. Some authors support the hypothesis that increasing surface solar radiation contributes to the increasing forest growth rate over the Amazon [63,64]. It must be noted that the extraterrestrial solar radiation we used has a value above the real solar radiation value reaching the forest surface. Indeed, sol was computed as a monthly mean over 50 years and does not account for local cloud cover or aerosol radiation absorption.
Investigating the effects of temperature on the physiology of tropical forest trees [31,65] is of primary importance today given the temperature increases expected over the next century [5,7]. Some authors suggest that tropical trees are more sensitive to temperatures than other trees because (i) they live at or close to the highest annual average temperatures on Earth, and (ii) tropical species naturally encounter limited variation in temperatures (, 4uC over 20u of latitude) [32]. Our results suggest that temperature variations are of secondary importance in shaping tropical tree seasonal growth; nevertheless, they do play a role. Minimal temperature was slightly positively correlated with tree growth, whereas maximal temperature had no effect. This positive relation between tree growth and temperature is not consistent with previous observations in Costa Rica [35,66], where an increase in night-time temperatures had a negative effect on tree growth, and in East Africa [19], where maximum temperatures had a negative effect on tree growth. Such patterns were not found at our global working scale.
Tree growth variability in time and space
Our results suggest that most tropical trees experience seasonal cycling growth even in extremely wet environments, as already reported at la Selva [35]. On a pantropical scale, we showed that secondary growth was higher during the wet season; tree growth increased with precipitation and relative soil water content (Table 6). This result is not consistent with other studies that
Figure 4. Observed versus predicted diameter at breast height (dbh) growth under the model mBIC. The red line is the identity line
y = x. Note that the model underestimated the diameter growth above 1 mm.month21.
doi:10.1371/journal.pone.0092337.g004
Figure 5. Predicted diameter at breast height (dbh) growth under the modelmBICand relationship with precipitation and
extra solar radiation. Predictions were computed using pre, sol, mean dtr, mean swc and mean of the random effect. The extra solar radiation unit is equivalent of evaporation in mm.month21, 1 mm.month21equivalent of evaporation = 2.45 MJ.m22.month21.
have shown that tropical forests are able to maintain or even to increase their productivity during the dry season [67–70]. This suggests different uses of carbohydrates. Some studies have reported that evergreen species in seasonally dry environments accumulate carbohydrates during the dry season because photo-synthesis continues while wood production ceases [71] and that deciduous species accumulate carbohydrates at the onset of the dry season to support respiration costs when they are leafless [72,73]. Some studies relied on the Enhanced Vegetation Index (EVI, an index of canopy photosynthetic capacity [30]) to highlight changes in forest phenology driven by the solar cycle [74,75]. In the same way, a variation in the EVI has been observed for the entire Amazon region [30], and the link between phenology and the solar cycle has also been reported for Terra Firme forests [76]. The variability in tree growth at a seasonal scale is likely driven by climate seasonality and dependent on the seasonal allocation of carbohydrates to processes other than tree diameter growth, such as leaf and root production or respiration.
Stem shrinkage during dry periods may be an important limitation of this work [77–79], e.g. the negative value of mean annual tree growth at Pinkwae. Other negative monthly growth values exist at almost all the study sites. In a tropical forest in Ethiopia experiencing a strong seasonality, high-resolution elec-tronic dendrometers have been combined with wood anatomy investigation to describe cambial growth dynamics [80]. These authors concluded that water scarcity during the long dry season induced cambial dormancy. Furthermore, after the onset of the rainy season, (i) bark swelling started quite synchronously among trees; (ii) bark swelling was maximum after few rainy days; and (iii) evergreen trees were able to quickly initiate wood formation. Recently at the Paracou forest site, some authors have showed that biomass increments were highly correlated between the first and the last quantile of trunk bark thickness and between the first and the last quantile of trunk bark density, suggesting that secondary growth is driven by cambial activity [75].
In this study, we focused on seasonal variation of tree growth, but the inter-site variance must be studied to build a full predictive model. At our pantropical working scale, there was no evident spatial auto-correlation. The site effect, i.e. the average growth of trees at a given site, is likely shaped by several additional environmental variables, such as soil fertility, forest floristic composition and competition for light and nutrients [81–83].
These effects were included in the model through the random site effect fi, and we assumed that these effects were constant over the
study period. We also did not consider the different ontogenetic stages of trees and the ontogenetic growth trajectory that depends on complex environmental changes that may have occurred during the census period [84]. Recently, a study using LiDAR and a four-year diameter growth census demonstrated that variation in canopy metrics appeared to be essential to predict biomass growth [85]. Clearly, remote sensing methods, whether radar, LiDAR or optical [86], can help us to derive stand variables, especially canopy height, and therefore can be used as valuable additional predictors to monitor forest growth over large tropical areas.
Tropical tree growth under climate change
Globally, current IPCC scenarios predict an intensification of the dry season in tropical areas during the 21st century [7]. Amongst climate variables, our results highlighted the predomi-nant role of precipitation in shaping seasonal forest growth. If a global rainfall reduction is confirmed in the future, it can be expected that tree growth will be affected (Figure 5). Climate change is not the only possible cause for reductions in precipitation; deforestation could lead to reductions in precipita-tion as the air passages over forests increase tropical rainfall intensity [4]. Solar radiation appeared almost as important as rainfall. Cloud reduction due to drier dry seasons, may subsequently improve tree growth. Our results suggest that, with the global changes observed, forest productivity due to tropical tree growth will encounter modifications due to change in climate seasonality.
Acknowledgments
We thank James Grogan and Mark Schulze; the French Institute of Pondichry and Raphael Pelissier; and Vincent Grgoire for provided the tree growth data of Marajoara, Attapadi and Muara Bungo respectively. We thank Morag Mcdonald, Adrian Newton and two anonymous referees for useful comments on previous drafts of the manuscript.
Author Contributions
Conceived and designed the experiments: FW VR BH. Analyzed the data: FW. Contributed reagents/materials/analysis tools: FW VR BH MA DB HD RG CS AT. Wrote the paper: FW VR BH MA DB HD RG CS AT.
References
1. Malhi Y, Wright J (2004) Spatial patterns and recent trends in the climate of tropical rainforest regions. Philosophical Transactions of the Royal Society of London Series B-Biological Sciences 359: 311–329.
2. Solomon S, Plattner GK, Knutti R, Friedlingstein P (2009) Irreversible climate change due to carbon dioxide emissions. Proceedings of the National Academy of Sciences of the United States of America 106: 1704–1709.
3. Harris NL, Hall CAS, Lugo AE (2008) Estimates of species- and ecosystem-level respiration of woody stems along an elevational gradient in the Luquillo Mountains, Puerto Rico. Ecological Modelling 216: 253–264.
4. Spracklen D, Arnold S, Taylor C (2012) Observations of increased tropical rainfall preceded by air passage over forests. Nature 489: 282–285. 5. Malhi Y, Aragao LEOC, Galbraith D, Huntingford C, Fisher R, et al. (2009)
Exploring the likelihood and mechanism of a climate-change-induced dieback of the Amazon rainforest. Proceedings of the National Academy of Sciences of the United States of America 106: 20610–20615.
6. Feng X, Porporato A, Rodriguez-Iturbe I (2013) Changes in rainfall seasonality in the tropics. Nature Climate Change 3: 811–815.
7. Solomon S, Qin D, Manning M, Marquis M, Averyt K, et al, editors (2007) Climate Change 2007, the Fourth Assessment Report (AR4). Intergovernmen-tal Panel on Climate Change, 103 pp. 14
8. Orlowsky B, Seneviratne SI (2012) Global changes in extreme events: regional and seasonal dimension. Climatic Change 110: 669–696.
9. Field C, Barros V, Stocker T, Qin D, Dokken D, et al. (2012) IPCC, 2012: Managing the risks of extreme events and disasters to advance climate change adaptation. A special report of Working Groups I and II of the
Intergovernmental Panel on Climate Change. B M J Publishing Group. doi:10.1136/jech-2012-201045.
10. Pan Y, Birdsey RA, Fang J, Houghton R, Kauppi PE, et al. (2011) A large and persistent carbon sink in the world’s forests. Science 333: 988–993. 11. Houghton R (2005) Aboveground forest biomass and the global carbon
balance. Global Change Biology 11: 945–958.
12. Saatchi SS, Houghton RA, Alvala RCDS, Soares JV, Yu Y (2007) Distribution of aboveground live biomass in the Amazon basin. Global Change Biology 13: 816–837.
13. Bonan GB (2008) Forests and climate change: forcings, feedbacks, and the climate benefits of forests. Science 320: 1444–1449.
14. Clark DA, Piper SC, Keeling CD, Clark DB (2003) Tropical rain forest tree growth and atmospheric carbon dynamics linked to interannual temperature variation during 1984–2000. Proceedings of the National Academy of Sciences of the United States of America 100: 5852–5857.
15. Chave J, Condit R, Lao S, Caspersen JP, Foster RB, et al. (2003) Spatial and temporal variation of biomass in a tropical forest: results from a large census plot in Panama. Journal of Ecology 91: 240–252.
16. Lewis SL, Lloyd J, Sitch S, Mitchard ETA, Laurance WF (2009) Changing ecology of tropical forests: evidence and drivers. Annual Review of Ecology Evolution and Systematics 40: 529–549.
17. Feeley KJ, Davies SJ, Ashton PS, Bunyavejchewin S, Supardi MNN, et al. (2007) The role of gap phase processes in the biomass dynamics of tropical forests. Proceedings of the Royal Society B-Biological Sciences 274: 2857– 2864.
18. Metcalf CJE, Clark JS, Clark DA (2009) Tree growth inference and prediction when the point of measurement changes: modelling around buttresses in tropical forests. Journal of Tropical Ecology 25: 1–12.
19. Gliniars R, Becker GS, Braun D, Dalitz H (2013) Monthly stem increment in relation to climatic variables during 7 years in an east african rainforest. Trees 27: 1129–1138.
20. Sombroek W (2001) Spatial and temporal patterns of Amazon rainfall -Consequences for the planning of agricultural occupation and the protection of primary forests. Ambio 30: 388–396.
21. Xiao X, Hagen S, Zhang Q, Keller M, Moore B III (2006) Detecting leaf phenology of seasonally moist tropical forests in South America with multi-temporal MODIS images. Remote Sensing of Environment 103: 465–473. 22. Marengo J (1992) Interannual variability of surface climate in the Amazon
basin. International Journal of Climatology 12: 853–863.
23. Phillips OL, Aragao LEOC, Lewis SL, Fisher JB, Lloyd J, et al. (2009) Drought sensitivity of the Amazon rainforest. Science 323: 1344–1347.
24. Tian HQ, Melillo JM, Kicklighter DW, McGuire AD, Helfrich JVK, et al. (1998) Effect of interannual climate variability on carbon storage in Amazonian ecosystems. Nature 396: 664–667.
25. Borchert R (1998) Responses of tropical trees to rainfall seasonality and its long-term changes. Climatic Change 39: 381–393.
26. Granier A, Breda N, Biron P, Villette S (1999) A lumped water balance model to evaluate duration and intensity of drought constraints in forest stands. Ecological Modelling 116: 269–283.
27. Zomer RJ, Trabucco A, Bossio DA, Verchot LV (2008) Climate change mitigation: A spatial analysis of global land suitability for clean development mechanism afforestation and reforestation. Agriculture Ecosystems and Environment 126: 67–80.
28. Wagner F, Herault B, Stahl C, Bonal D, Rossi V (2011) Modeling water availability for trees in tropical forests. Agricultural and Forest Meteorology 151: 1202–1213.
29. Graham EA, Mulkey SS, Kitajima K, Phillips NG, Wright SJ (2003) Cloud cover limits net CO2 uptake and growth of a rainforest tree during tropical rainy seasons. Proceedings of the National Academy of Sciences of the United States of America 100: 572–576.
30. Huete AR, Didan K, Shimabukuro YE, Ratana P, Saleska SR, et al. (2006) Amazon rainforests green-up with sunlight in dry season. Geophysical Research Letters 33.
31. Lloyd J, Farquhar GD (2008) Effects of rising temperatures and [CO2] on the physiology of tropical forest trees. Philosophical Transactions of the Royal Society B-Biological Sciences 363: 1811–1817.
32. Wright SJ (2010) The future of tropical forests. Year in Ecology and Conservation Biology 2010 1195: 1–27.
33. Doughty CE, Goulden ML (2008) Are tropical forests near a high temperature threshold? Journal of Geophysical Research-Biogeosciences 113.
34. Doughty CE (2011) An in situ leaf and branch warming experiment in the Amazon. Biotropica 43: 658–665.
35. Clark DB, Clark DA, Oberbauer SF (2010) Annual wood production in a tropical rain forest in NE Costa Rica linked to climatic variation but not to increasing CO(2). Global Change Biology 16: 747–759.
36. Mitchell T, Jones P (2005) An improved method of constructing a database of monthly climate observations and associated high-resolution grids. Interna-tional Journal of Climatology 25: 693–712.
37. Ekstrom M, Jones PD, Fowler HJ, Lenderink G, Buishand TA, et al. (2007) Regional climate model data used within the SWURVE project 1: projected changes in seasonal patterns and estimation of PET. Hydrology and Earth System Sciences 11: 1069–1083.
38. Allen R, Smith M, Pereira LS, Perrier A (1994) An update for the calculation of reference evapotranspiration. Journal of the ICID 43: 35–92.
39. Allen R, Pereira L, Raes D, Smith M (1998) Crop evapotranspiration: Guidelines for computing crop requirements. irrigation and drainage paper no. 56. Rome, ItalyTechnical report, FAO
40. Batjes N (1997) A world dataset of derived soil properties by FAO-UNESCO soil unit for global modelling. Soil Use and Management 13: 9–16. 41. Batjes NH (2012) Isric-wise derived soil properties on a 5 by 5 arc-minutes
global grid (version 1.2). Technical report, ISRIC - World Soil Information. 42. Schenk H, Jackson R (2009) Islscp ii ecosystem rooting depths. In: Hall, Forrest
G., G. Collatz, B. Meeson, S. Los, E. Brown de Colstoun, and D. Landis (eds.). ISLSCP Initiative II Collection. Data set. Available: http://daac.ornl.gov/, from Oak Ridge National Laboratory Distributed Active Archive Center, Oak Ridge, Tennessee, U.S.A. doi:10.3334/ORNLDAAC/929.
43. Borchert R (1999) Climatic periodicity, phenology, and cambium activity in tropical dry forest trees. Iawa Journal 20: 239–247.
44. Couralet C, Sterck FJ, Sass-Klaassen U, Van Acker J, Beeckman H (2010) Species-specific growth responses to climate variations in understory trees of a central african rain forest. Biotropica 42: 503–511.
45. Moran PAP (1950) Notes on continuous stochastic phenomena. Biometrika 37: 17–23.
46. Paradis E, Claude J, Strimme K (2004) APE: analyses of phylogenetics and evolution in R language. Bioinformatics 20: 289–290.
47. Barnett A, Dobson A (2010) Analysing seasonal health data. Springer. 48. Bates D, Maechler M, Bolker B (2013) lme4: Linear mixed-effects models using
S4 classes. Available: http://CRAN.R-project.org/package = lme4. R package version 0.999999-2.
49. Gurka M (2006) Selecting the best linear mixed model under REML. American Statistician 60: 19–26.
50. Magee L (1990) R2 Measures based on Wald and likelihood ratio joint significance tests. American Statistician 44: 250–253.
51. Vonesh E, Chinchilli V, Pu K (1996) Goodness-of-fit in generalized nonlinear mixed-effects models. Biometrics 52: 572–587.
52. Orelien JG, Edwards LJ (2008) Fixed-effect variable selection in linear mixed models using statistics. Computational Statistics & Data Analysis 52: 1896– 1907.
53. Schwarz G (1978) Estimating the dimension of a model. Annals of Statistics 6 (2): 461–464.
54. Burnham K, Anderson D (2004) Multimodel inference - understanding AIC and BIC in model selection. Sociological Methods & Research 33: 261–304. 55. FAO (2012) Forest resources assessment working paper 179, global ecological
zones for forest reporting: 2010 update. Technical report, Food and Agriculture Organization of the United Nations.
56. Nath CD, Dattaraja HS, Suresh HS, Joshi NV, Sukumar R (2006) Patterns of tree growth in relation to environmental variability in the tropical dry deciduous forest at mudumalai, southern india. Journal of Biosciences 31: 651– 669.
57. Baker TR, Swaine MD, Burslem DFRP (2003) Variation in tropical forest growth rates: combined effects of functional group composition and resource availability. Perspectives in Plant Ecology Evolution and Systematics 6: 21–36. 58. Toledo M, Poorter L, Pena-Claros M, Alarcon A, Balcazar J, et al. (2011) Climate is a stronger driver of tree and forest growth rates than soil and disturbance. Journal of Ecology 99: 254–264.
59. Vieira S, de Camargo PB, Selhorst D, da Silva R, Hutyra L, et al. (2004) Forest structure and carbon dynamics in Amazonian tropical rain forests. Oecologia 140: 468–479.
60. Lola da Costa AC, Galbraith D, Almeida S, Tanaka Portela BT, da Costa M, et al. (2010) Effect of 7 yr of experimental drought on vegetation dynamics and biomass storage of an eastern Amazonian rainforest. New Phytologist 187: 579–591.
61. Nepstad DC, Moutinho P, Dias MB, Davidson E, Cardinot G, et al. (2002) The effects of partial throughfall exclusion on canopy processes, aboveground production, and biogeochemistry of an amazon forest. Journal of Geophysical Research-Atmospheres 107.
62. Wagner F, Rossi V, Stahl C, Bonal D, Herault B (2012) Water availability is the main climate driver of neotropical tree growth. Plos One 7.
63. Nemani R, Keeling C, Hashimoto H, Jolly W, Piper S, et al. (2003) Climate-driven increases in global terrestrial net primary production from 1982 to 1999. Science 300: 1560–1563.
64. Arias PA, Fu R, Hoyos CD, Li W, Zhou L (2011) Changes in cloudiness over the Amazon rainforests during the last two decades: diagnostic and potential causes. Climate Dynamics 37: 1151–1164.
65. Chambers JQ, Higuchi N, Teixeira LM, dos Santos J, Laurance SG, et al. (2004) Response of tree biomass and wood litter to disturbance in a Central Amazon forest. Oecologia 141: 596–611.
66. Clark DA, Clark DB, Oberbauer SF (2013) Field-quantified responses of tropical rainforest aboveground productivity to increasing co2 and climatic stress, 1997–2009. Journal of Geophysical Research: Biogeosciences 118 (2): 783–794.
67. Saleska SR, Miller SD, Matross DM, Goulden ML, Wofsy SC, et al. (2003) Carbon in Amazon forests: Unexpected seasonal fluxes and disturbance-induced losses. Science 302: 1554–1557.
68. Hutyra LR, Munger JW, Saleska SR, Gottlieb E, Daube BC, et al. (2007) Seasonal controls on the exchange of carbon and water in an Amazonian rain forest. Journal of Geophysical Research-Biogeosciences 112.
69. Baker PJ, Palmer JG, D’Arrigo R (2008) The dendrochronology of Callitris intratropica in northern Australia: annual ring structure, chronology development and climate correlations. Australian Journal of Botany 56: 311– 320.
70. Bonal D, Bosc A, Ponton S, Goret JY, Burban B, et al. (2008) Impact of severe dry season on net ecosystem exchange in the Neotropical rainforest of French Guiana. Global Change Biology 14: 1917–1933.
71. Wurth MKR, Pelaez-Riedl S, Wright SJ, Korner C (2005) Non-structural carbohydrate pools in a tropical forest. Oecologia 143: 11–24.
72. Poorter L, Kitajima K (2007) Carbohydrate storage and light requirements of tropical moist and dry forest tree species. Ecology 88: 1000–1011. 73. Janzen D, Wilson D (1974) The cost of being dormant in the tropics. Biotropica
6: 260–262.
74. Pennec A, Gond V, Sabatier D (2011) Tropical forest phenology in French Guiana from MODIS time series. Remote Sensing Letters 2:4: 337–345. 75. Wagner F, Rossi V, Stahl C, Bonal D, He´rault B (2013) Asynchronism in leaf
and wood production in tropical forests: a study combining satellite and ground–based measurements. Biogeosciences Discussion 10: 8247–8281. 76. Bradley AV, Gerard FF, Barbier N, Weedon GP, Anderson LO, et al. (2011)
Relationships between phenology, radiation and precipitation in the Amazon region. Global Change Biology 17: 2245–2260.
77. Sheil D (2003) Growth assessment in tropical trees: large daily diameter fluctuations and their concealment by dendrometer bands. Canadian Journal of Forest Research-Revue Canadienne De Recherche Forestiere 33: 2027–2035. 78. Baker T, Affum-Baffoe K, Burslem D, Swaine M (2002) Phenological differences in tree water use and the timing of tropical forest inventories: