Publisher’s version / Version de l'éditeur:
Vous avez des questions? Nous pouvons vous aider. Pour communiquer directement avec un auteur, consultez la première page de la revue dans laquelle son article a été publié afin de trouver ses coordonnées. Si vous n’arrivez pas à les repérer, communiquez avec nous à PublicationsArchive-ArchivesPublications@nrc-cnrc.gc.ca.
Questions? Contact the NRC Publications Archive team at
PublicationsArchive-ArchivesPublications@nrc-cnrc.gc.ca. If you wish to email the authors directly, please see the first page of the publication for their contact information.
https://publications-cnrc.canada.ca/fra/droits
L’accès à ce site Web et l’utilisation de son contenu sont assujettis aux conditions présentées dans le site LISEZ CES CONDITIONS ATTENTIVEMENT AVANT D’UTILISER CE SITE WEB.
[Proceedings of the Conference], 2018-05-02
READ THESE TERMS AND CONDITIONS CAREFULLY BEFORE USING THIS WEBSITE. https://nrc-publications.canada.ca/eng/copyright
NRC Publications Archive Record / Notice des Archives des publications du CNRC :
https://nrc-publications.canada.ca/eng/view/object/?id=36429717-087c-43ba-b1d2-a1017c8f6dd5
https://publications-cnrc.canada.ca/fra/voir/objet/?id=36429717-087c-43ba-b1d2-a1017c8f6dd5
NRC Publications Archive
Archives des publications du CNRC
This publication could be one of several versions: author’s original, accepted manuscript or the publisher’s version. / La version de cette publication peut être l’une des suivantes : la version prépublication de l’auteur, la version acceptée du manuscrit ou la version de l’éditeur.
Access and use of this website and the material on it are subject to the Terms and Conditions set forth at
Web-based geospatial decision support system to facilitate marine
renewable energy site selection in British Columbia, Canada
WEB-BASED GEOSPATIAL DECISION SUPPORT SYSTEM TO FACILITATE MARINE
RENEWABLE ENERGY SITE SELECTION IN BRITISH COLUMBIA, CANADA
Sean Ferguson1 and Julien Cousineau
National Research Council Canada Ottawa, ON, Canada
1Corresponding author: Sean.Ferguson@nrc.ca
ABSTRACT
The authors present the British Columbia Marine Energy Resource Atlas (hereafter referred to as the Atlas ), a web-based geospatial decision support system (DSS) to facilitate preliminary marine renewable energy (MRE) site selection and feasibility investigations within the rivers and coastal waters of Canada’s westernmost province. The Atlas was developed such that users are able to interact with the underlying datasets that drive the hotspot delineation. As such, the Atlas is an effective tool to quickly investigate multiple case-scenarios with different resource, socio-economic, and environmental criteria. Furthermore, the Atlas is the first MRE DSS to offer support for tidal, wave, and river hydrokinetic resources under a common system and interface.
INTRODUCTION
Growing concern regarding climate change and sustainable decision making has sparked an interest in renewable energy, with great attention and focus being directed toward energy harnessed from tidal, wave, and river hydrokinetic resources. Despite a growing body of research and technological advances, deployment of MRE devices within Canada remains relatively low, with the exception of a few exploratory technology demonstrations [1,2]. Previous research has shown that Canada’s coastal regions are abundant in MRE resources [3,4]. However, well-informed site selection cannot be based on resource availability alone. The deployment suitability of a site depends upon a variety of considerations including, but not limited to, socio-economic criteria, environmental criteria, installation feasibility, and power grid integration.
BACKGROUND Resource Assessment
Considerable effort has been directed towards gaining a better understanding of the tidal, wave, and river hydrokinetic energy resources across Canada [3] and in the province of British Columbia [5–7]. However, much of this information is not accessible to Canadians and industry stakeholders in a manner that supports their needs. The results of these studies, and the data behind them, have not been collected in a single database nor made widely available to Canadians and stakeholders through a user-friendly access portal. Moreover, virtually all previous resource assessments stop short of estimating the practical resource that could realistically be exploited with consideration of external criteria such as socio-economic and environmental considerations, as defined by the International Electrotechnical Commission (IEC). Important stakeholders throughout the province of British Columbia (such as B.C. Hydro, Water Wall Turbines, and Mavi Innovations) have expressed a keen desire for better information and access to technical marine energy resources throughout the province.
Multi-Criteria Decision Analysis
Previous studies have employed multi-criteria decision analysis (MCDA) methods with GIS to identify MRE development hotspots [8–11]. In the initial stages, this methodology involves gathering relevant datasets and compiling the data into independent geospatial layers. The independent datasets and respective layers are typically categorized as development constraints or factors. Constraint layers geospatially delineate areas where development is prohibited, whereas factor
layers indicate suitability at a given location based on a pre-defined scale. Prior to data integration, factor layer values must be resampled to a common scale. Weights must also be assigned to each factor layer indicating the relative importance in comparison to other factor layers. Ultimately, constraint and factor layers are integrated using geospatial algebraic methods to produce a summary layer indicating site suitability throughout the study domain [12,13].
Data integration processes are typically performed using a raster-based approach where the study domain is discretized as a uniform grid [8,9,11]. Raster-based discretization is an effective means to facilitate MCDA, but specifying a uniform grid resolution throughout the study domain introduces a trade-off between nearshore accuracy and computation time.
Data Visualization
Geospatial data layers and MCDA results are commonly communicated though figures in print [8–10] or static-layers in online map services [14,15]. This approach is based on the principles of visual presentation and is an effective strategy to communicate preconceived key points to the user [16,17]. However, this approach does not permit the user to formulate custom data interrogations. Users are constrained to making decisions based on pre-processed visuals and do not have the freedom to explore different scenarios. In the context of MRE development feasibility, interested stakeholders may wish to emphasize or diminish the influence of certain constraints or factors. These capabilities require a visual exploration approach [16,17].
OBJECTIVE
The main goal of the Atlas [18] is to support preliminary site selection and feasibility investigations in British Columbia, Canada for tidal, wave, and river hydrokinetic energy developments. The Atlas was developed with the intention of producing a flexible and interactive DSS based on the principals of visual exploration [16,17].
METHODS AND DEVELOPMENT Relevant Datasets
The DSS leverages three previous resource assessments and a suite of socio-economic and environmental datasets to support MRE hotspot delineation and assessment of the practical resource. The tidal resource dataset was developed in a previous phase of the subject study, the river hydrokinetic resource dataset was obtained from National Research Council Canada [4], and the wave resource dataset was provided by the University of Victoria West Coast Wave Initiative
[6]. The socio-economic and environmental datasets encompass a variety of geospatial data pertinent to MRE development feasibility including, but not limited to, depth, port locations, protected areas, and the power grid.
Domain Discretization
In raster data models, geospatial data are represented as an array of equally sized cells arranged in rows and columns [19]. Conversely, in vector data models, geospatial data are represented as points, lines, and/or polygon features which need not conform to a structured arrangement pattern [19]. Unlike most studies, which employ a raster-based discretization to perform MCDA with a fixed cell resolution, the study domain was discretized using a novel vector-based approach. Geospatial data layers pertaining to tidal and wave energy were discretized based on a collection of nodes coinciding with the node locations of the unstructured triangular meshes used to support the respective resource assessments. Geospatial layers pertaining to river hydrokinetic energy were discretized based on a series of nodes evenly spaced streamwise along river segments throughout the study domain. For tidal and wave applications, this vector-based approach permits MCDA to be performed with dynamic resolution throughout the study domain, thus alleviating the trade-off between producing detailed results and maintaining acceptable computation time.
Layer Preparation
Geospatial layer preparation was conducted using Python programming. A number of scripts were developed to assign relevant values to node locations.
For the tidal, wave, and river hydrokinetic resource data layers, values derived from the respective resource assessments could be assigned directly to node locations. Similarly, for depth layers, values could be assigned directly to node locations based on bathymetry data.
Most socio-economic geospatial layers represent proximity to key features (e.g. proximity to port locations). For these layers, additional computation was required in order to compute proximity between node locations and key features supplied as point, line, or polygon shapefiles. For tidal and wave applications, these computations were supported by shortest-path algorithms included in the open-source Python library, NetworkX, restricting travel to the edges outlined by the computational meshes. This technique adequately handled shortest-path computations around obstructions such as islands and peninsulas. For river hydrokinetic applications
(and some tidal and wave applications), proximity computations were conducted using the straight Euclidean distance between nodes and key features.
Application Development
The Atlas is a web-based application and is comprised of two components, a GIS data catalogue and an interactive user interface. The data catalogue handles the management of geospatial datasets and data layers. The user interface handles MCDA computations and data visualization. The user interface also offers interactive features permitting the user to customize the MCDA to fit their needs.
GIS Data Catalogue
The GIS data catalogue was primarily supported by GeoNode (http://geonode.org/), a web-based application for developing GIS and deploying spatial data infrastructures. GeoNode provides a platform for uploading, managing, sharing, searching, and viewing geospatial data. GeoNode also offers some utility for creating basic maps from uploaded data.
Some modifications were made to the base GeoNode application to implement additional data processing capabilities. These modifications permit users to process uploaded data sets using the aforementioned Python scripts to produce meaningful data layers.
Subscribed users of the Atlas are able to access the GeoNode-based data catalogue, wherein they are able to upload and process their own geospatial data for inclusion in the Atlas or select from a suite of pre-processed data layers.
Interactive User Interface
The web-based user interface was developed using JavaScript programming and associated open-source libraries. Mapping features and functionality were supported primarily through the Mapbox JavaScript libraries. This approach eliminated reliance on traditional GIS software, thus improving accessibility. Furthermore, this approach enabled a high degree of flexibility and customization.
The user interface was developed with the intention of producing a clean and focussed visual environment to foster intuitive interaction with the underlying data. Buttons, scroll-bars, and mouse-action features are integrated into the user interface in such a way that the functionality is obvious to the user. These interactivity features were incorporated into the web application using a suite of JavaScript libraries including jQuery, jQuery UI, and Bootstrap.
MCDA computations are handled by the web browser via JavaScript programming. Users are able to select and deselect constraint and factor layers as
desired. For constraint layers, users are presented with a slider bar on which they can specify minimum and maximum constraint values (i.e. an acceptable range of values). For example, users may wish to specify minimum and maximum allowable depths [9]. For factor layers, users are presented with an interactive graph on which they can specify minimum and maximum constraint values, and adjust the data resampling method as specified by a value function [20]; the value function resamples factor layer values to a scale from 0 to 1, with 1 indicating the most desirable value. Additionally, users are able to adjust the relative weight of each selected factor layer using a slider bar. MCDA computations are conducted using the user-specified constraint and factor layer criteria. Any locations that do not satisfy constraint specifications are considered not suitable for development and are filtered out of the display. The suitability of the remaining locations is computed using a weighted linear combination of the weighted and resampled factor layers. Ultimately, the MCDA produces a geospatial representation of MRE development suitability throughout the study domain. Locations with high suitability can be interpreted as MRE hotspots. The results of the MCDA are visualized in the user interface over top of a base map. The visualization is updated in real-time as users adjust constraint and factor criteria.
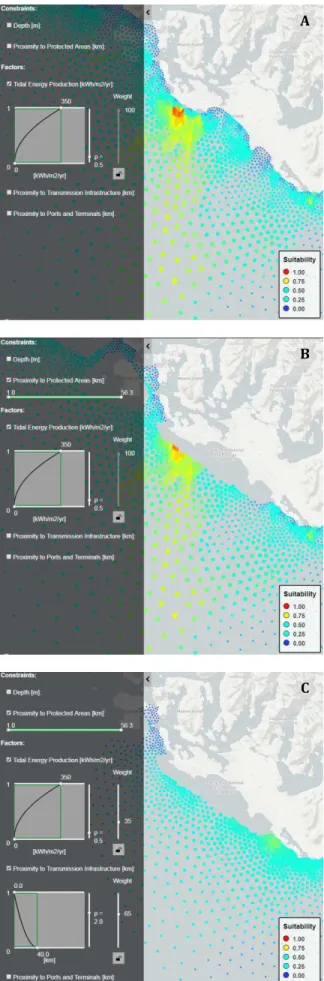
Figure 1 illustrates a hypothetical scenario in which site suitability is assumed to be dependent upon tidal energy production, proximity to protected areas, and proximity to transmission infrastructure. The figure demonstrates how the resulting hotspot delineation evolves as factors and constraints are introduced into the web tool and manipulated by the user. Furthermore, the figure demonstrates the utility of the tool as a means to evaluate competing interests and quickly assess numerous scenarios.
FIGURE 1. THE BRITISH COLUMBIA MARINE ENERGY RESOURCE ATLAS USER INTERFACE. (A) THE USER HAS INTRODUCED TIDAL ENERGY PRODUCTION AS A FACTOR AND HAS SPECIFED THAT GREATER TIDAL ENERGY PRODUCITON IS DESRIEABLE. (B) THE USER HAS INTRODUCED PROXIMITY TO PROTECTED AREAS AS A CONSTRAINT AND HAS SPECIFIED THAT AREAS WITHIN 1 KM OF A PROTECTED AREA ARE RESTIRCTED. (C) THE USER HAS INTRODUCED PROXIMITY TO TRANMISSION INFRASTRUCTURE AS A FACTOR AND HAS SPECIFIED THAT PROXIMITY IS DESIREABLE; A WEIGHT OF 65/100 HAS BEEN ASSIGNED TO THE FACTOR.
CONCLUSIONS
The Atlas represents the first MRE DSS to support such extensive interaction with the underlying data. Furthermore, the Atlas is the first MRE DSS to offer support for tidal, wave, and river hydrokinetic resources under a common system and interface. The flexibility offered by the Atlas permits users to customize preliminary resource investigations to fit their specific project criteria. The Atlas includes a suite of pre-processed data layers pertinent to MRE development feasibility, but also offers users the ability to include their own datasets in the MCDA and resulting hotspot delineation. Accordingly, the Atlas is an effective tool to quickly investigate multiple case-scenarios with different MCDA criteria. The Atlas will assist stakeholders in identifying locations that may warrant further attention and detailed investigation. Additionally, unlike typical raster-based MCDA approaches, the presented vector-based approach permits dynamic resolution throughout the study domain. These methods may offer valuable guidance to stakeholders tasked with assessing MRE resources, especially in large regions with intricate coastal geography.
The Atlas is still in development and a beta version is currently being tested by a small community of key stakeholders. The official launch is planned for later in 2018.
ACKNOWLEDGEMENTS
The authors gratefully acknowledge funding for this work from Natural Resources Canada, the National Research Council of Canada, and BC Hydro.
A
B
REFERENCES
[1] Fletcher, Garry. Tidal Current Energy Demonstration Project: Renewable Energy for Race Rocks [Online]. Available: http://www.racerocks.ca/tidal-current- energy-demonstration-project-renewable-energy-for-race-rocks/. [Accessed: 04-Jan-2018]. 2007.
[2] Natural Resources Canada. Tidal Energy Project in the Bay of Fundy [Online]. Available:
http://www.nrcan.gc.ca/energy/funding/cu rrent-funding-programs/cef/4955.
[Accessed: 04-Jan-2018]. 2017.
[3] Cornett, Andrew. "Inventory of Canada’s Marine Renewable Energy Resources." National Research Council Canada. Ottawa, Canada. 2006.
[4] Jenkinson, Wayne and Bomhof, James. "Assessment of Canada’s Hydrokinetic Power Potential." National Research Council Canada. 2014.
[5] Robertson, Bryson R.D., Hiles, Clayton E., and Buckham, Bradley J. Characterizing the near Shore Wave Energy Resource on the West Coast of Vancouver Island, Canada,
Renewable energy Vol. 71 (2014): pp. 665–
678.
[6] Robertson, Bryson, Hiles, Clayton, Luczko, Ewelina, and Buckham, Bradley. Quantifying the Wave Energy Resource and Farm Siting Opportunities for Western Canada.
International Conference on Ocean Energy.
Halifax, Canada, 2014.
[7] Sutherland, G., Foreman, M., and Garrett, C. Tidal Current Energy Assessment for Johnstone Strait, Vancouver Island.
Proceedings of the Institution of Mechanical Engineers, Part A: Journal of Power and Energy Vol. 221 (2007): pp. 147–157.
[8] Defne, Zafer, Haas, Kevin A., and Fritz, Hermann M. GIS Based Multi-Criteria Assessment of Tidal Stream Power Potential: A Case Study for Georgia, USA. Renewable
and Sustainable Energy Reviews Vol. 15 No. 5
(2011): pp. 2310–2321.
[9] Nobre, Ana, Pacheco, Miguel, Jorge, Raquel, Lopes, M. F. P., and Gato, L. M. C. Geo-Spatial Multi-Criteria Analysis for Wave Energy Conversion System Deployment. Renewable
Energy Vol. 34 No. 1 (2009): pp. 97–111.
[10] Prest, Robert, Daniell, Trevor, and Ostendorf, Bertram. Using GIS to Evaluate the Impact of Exclusion Zones on the Connection Cost of Wave Energy to the Electricity Grid. Energy
Policy Vol. 35 No. 9 (2007): pp. 4516–4528.
[11] Pulido, B., Alonso-Gonzalez, C., Gonzalez, E., Barredo, C., Lopez, M., Corzo, J., and Calvo, J. A. GIS-Based DSS for Optimal Placement for Oceanic Power Generation: OCEANLIDER Project, Spanish Coastline Study.
International Conference on Renewable Energy Research and Applications. pp.
137-142. Madrid, Spain, 2013.
[12] Pohekar, S. D., and Ramachandran, M. Application of Multi-Criteria Decision Making to Sustainable Energy planning—A Review. Renewable and Sustainable Energy
Reviews Vol. 8 No. 4 (2004): pp. 365–381.
[13] Wang, Jiang-Jiang, Jing, You-Yin, Zhang, Chun-Fa, and Zhao, Jun-Hong. Review on Multi-Criteria Decision Analysis Aid in Sustainable Energy Decision-Making.
Renewable and Sustainable Energy Reviews
Vol. 13 No. 9 (2009): pp. 2263–2278. [14] British Columbia Marine Conservation
Analysis. "A Series of Marxan Scenarios for Pacific Canada: A Report from the British Columbia Marine Conservation Analysis." British Columbia Marine Conservation Analysis, Vancouver, Canada. 2012.
[15] World Wildlife Fund Canada. "Renewables for Nature - Methodology." World Wildlife Fund Canada. 2016.
[16] Fisher, Danyel, , Animation for Visualization: Opportunities and Drawbacks. Beautiful Visualization: Looking
at Data Through the Eyes of Experts. O’Reilly
Media Inc., Sebastopol (2010): pp. 329-352. [17] Tominski, Christian. Event Based
Visualization for User Centered Visual Analysis. PhD Thesis. University of Rostock, Rostock, Germany. 2006.
[18] Ferguson, Sean and Cousineau, Julien. Development of the B.C. Marine Energy Resource Atlas. Proceedings of the 12th
European Wave and Tidal Energy Conference.
Cork, Ireland, 2017.
[19] Esri, 7, GIS Dictionary [Online]. Available:
https://support.esri.com/en/other-resources/gis-dictionary. [Accessed: 16-Mar-2018].
[20] Malczewski, Jacek, and Rinner, Claus. Introduction to GIS-MCDA. Multicriteria
Decision Analysis in Geographic Information Science. Springer, New York (2015): pp. 23–