U11
Massachusetts Institute of Technology
Sloan School of Management
Working Paper
Analysis of Decentralized Production-Inventory System Ren6 Caldentey
Lawrence M. Wein
November 22, 1999 Working Paper Number 4099
Contact Address:
Prof. Lawrence M.Wein Sloan School of Management
Massachusetts Institute of Technology Cambridge, MA 02142-1343
November 22, 1999
Abstract
We model an isolated portion of a competitive supply chain as a M/M/1 make-to-stock queue. The retailer carries finished goods inventory to service a Poisson demand process, and specifies a policy for replenishing his inventory from an upstream supplier. The supplier chooses the service rate, i.e., capacity, of his manufacturing facility, which
behaves as a single-server queue with exponential service times. Demand is backlogged and both agents share the backorder cost. In addition, a linear inventory holding cost is charged to the retailer, and a linear cost for building production capacity is incurred by the supplier. The inventory level, demand rate and cost parameters are common knowledge to both agents. Under the continuous state approximation that the
M/M/1 queue has an exponential rather than geometric steady-state distribution, we
characterize the optimal centralized and Nash solutions, and show that a contract with linear transfer payments based on backorder, inventory and capacity levels coordinates the system in the absence of participation constraints. We also derive explicit formulas to assess the inefficiency of the Nash equilibrium, compare the agents' decision variables and the customer service level of the centralized versus Nash solutions, and identify conditions under which a coordinating contract is desirable for both agents.
*Department of Industrial Engineering, University of Chile, Repdblica 701, Santiago, and Sloan School of Management, MIT, Cambridge, MA 02139, (617) 253-8094 Fax: (617) 258-7579, [email protected]
tSloan School of Management, MIT, Cambridge, MA 02139, (617) 253-6697 Fax: (617) 258-7579, [email protected]
1
Introduction
Within many supply chains, a devoted upstream agent, referred to here as the supplier, produces goods for a downstream agent, called the retailer, in a make-to-stock manner. Broadly speaking, the performance (e.g., service levels, cost to produce and hold items) of this isolated portion of the supply chain is dictated by three factors: (i) Retailer demand, which is largely exogeneous but can in some cases be manipulated via pricing and advertising, (ii) the effectiveness of the supplier's production process and the subsequent transportation of goods, and (iii) the inventory replenishment policy, by which retailer demand is mapped into orders placed with the supplier. If the supplier and retailer are under different ownership or are independent entities within the same firm, then their competing objectives can lead to severe coordination problems: The supplier typically wants to build as little capacity as possible and receive excellent demand forecasts and/or a steady stream of orders, while the retailer prefers to hold very little inventory and desires rapid response from the supplier. These tensions may deteriorate overall system performance.
The recent explosion in the academic supply chain management literature is aimed at this type of multi-agent problem. Almost without exception, the papers that incorporate stochas-tic demand employ variants of one of two prototypical operations management models: The newsvendor model or the Clark-Scarf (1960) multi-echelon inventory model. One-period and two-period versions of newsvendor supply chain models have been studied intensively to ad-dress the three factors above; see Agrawal et al. (1999), Cachon (1999) and Lariviere (1999) for recent reviews. Although many valuable insights have been generated by this work, these models are primarily useful for style goods and products with very short life cycles. More complex (multi-period, and possibly multi-echelon and positive lead time) supply chain models have been used to analyze the case where a product experiences ongoing production and demand. Of the three factors in the last paragraph, these multi-period supply chain models successfully capture the replenishment policy and have addressed some aspects of retailer demand, e.g., information lead times in the Clark-Scarf model (Chen 1999), pricing
in multi-echelon models with deterministic demand and ordering costs (Chen et al. 1999), and forecast updates (Anupindi and Bassok 1999 in a multi-period newsvendor model and Tsay and Lovejoy 1999 in a multi-stage model). However, the Clark-Scarf model, and indeed all of traditional inventory theory, takes a crude approach towards the supplier's production process, by assuming that lead times are independent of the ordering process, or equivalently, that the production process is an infinite-server queue.
In this paper, we use an alternative prototypical model, an RI/M/1 make-to-stock queue, to analyze a supply chain. Here, the supplier is modeled as a single-server queue, rather than an infinite-server queue, and the retailer's optimal inventory replenishment strategy is a base stock policy. Because the production system is explicitly incorporated, these make-to-stock queues are also referred to as production-inventory systems. The M/M/1 make-to-stock queue was introduced by Morse (1958), but lay mysteriouly dormant for the next three decades, perhaps because the multi-echelon version of it lacked the attractive decomposition property of the Clark-Scarf model and traditional (i.e., make-to-order) queueing networks, except under some restrictive inventory policies (Rubio and Wein 1996). Make-to-stock queueing systems have experienced a revival in the 1990s, including multi-product queues with (e.g., Federgruen and Katalan 1996, Markowitz et al. 1999) and without (e.g., Zheng and Zipkin 1990, Wein 1992) setups, and single-product, multi-stage systems in continuous time (e.g., Buzacott et al. 1992, Lee and Zipkin 1992) and discrete time (e.g., Glasserman and Tayur 1995 and Gavirneni et al. 1996, building on earlier work by Federgruen and Zipkin 1986). Although these papers either undertake a performance analysis or consider a centralized decision maker (Gaverneni et al. analyze their system under various informational structures, but not in a game-theoretic setting), the make-to-stock queue is amenable to a competitive analysis because it explicitly captures the trade-off between the supplier's capacity choice and the retailer's choice of base stock level. However, the model treats the third key factor in a naive way, by assuming that retailer demand is an exogenous Poisson process. Moreover, we assume that the system state, the demand rate and the cost parameters are known by each agent. While this assumption is admittedly crude, we
believe it is an appropriate starting point for exploring competitive make-to-stock queues. In the only other multi-agent production-inventory study that we are aware of, Plambeck and Zenios (1999), contemporaneously to us, analyze a more complex dynamic system with information asymmetry.
In an attempt to isolate - and hence understand - the impact of incorporating capacity into a supply chain model, we intentionally mimic Cachon and Zipkin (1999). Their two-stage Clark-Scarf model is quite similar to our 11///l make-to-stock queue: Both models have two players, assume linear backorder and holding costs for retailer inventory (where the backorder costs are shared by both agents), employ steady-state analyses, and ignore fixed ordering costs. The key distinction between the two models is that the production stage is an infinite-server queue and the supplier controls his (local or echelon) inventory level in Cachon and Zipkin, whereas in our paper the production stage is modeled as a single-server queue and the supplier controls the capacity level, which in turn dictates a steady-state lead time distribution. While Cachon and Zipkin's supplier incurs a linear inventory holding cost, our supplier is subjected to a linear capacity cost. Another deviation in the formulations is that Cachon and Zipkin's agents minimize cost, while our agents maximize profit; this allows us to explicitly incorporate participation (i.e., nonnegative profits) constraints. A minor difference is that our queueing model is in continuous time, while Cachon and Zipkin's inventory model is in discrete time. In fact, to make our results more transparent and to maintain a closer match of the two models, we use a continuous state approximation, essentially replacing the geometric steady-state distribution of the //lM/1 queue by an exponential distribution with the same mean.
After defining the model in §2, we derive the centralized solution in §3, where a single decision maker optimizes system performance, and the Nash equilibrium in §4, where the supplier and retailer maximize their own profit. The two solutions are compared in §5. In §6, we describe the contract that coordinates the system; i.e., allows the decentralized system to achieve the same profit as the centralized system. In §7, we analyze the Stackelberg games, where one agent has all the bargaining power. Concluding remarks are presented in §8.
carries inventory to service this demand, and unsatisfied demand is backordered. The retailer uses a (s - 1, s) base stock policy to replenish his inventory. That is, the inventory initially contains s units, and the retailer places an order for one unit with the supplier at each epoch of the Poisson demand process. Because we assume that there are no fixed ordering costs, the retailer's optimal replenishment policy is indeed characterized by the base stock level s. The supplier's production facility is modeled as a single-server queue with service times that are exponentially distributed with rate M. The supplier is responsible for choosing the parameter , which will also be referred to as the capacity. The server is only busy when retailer orders are present in the queue. The supplier's facility behaves as a M/M/11 queue because the demand process is Poisson and a base stock policy is used.
The selling price r that the retailer charges to the end customers and the wholesale price
w that the retailer pays to the supplier are fixed. These conditions implicitly assume that
the retailer and supplier operate in competitive markets. Each backordered unit generates a cost b per unit of time for the production-inventory system. As in Cachon and Zipkin, this backorder cost is split between the two agents, with a fraction a E [0, 1] incurred by the retailer. The parameter c, which we refer to as the backorder allocation fraction, is exogenously specified in our model. In addition, the retailer incurs a holding cost h per unit of inventory per unit of time. The supplier is responsible for building production capacity and the capacity cost c is per unit of product, so that c,/ is cost per unit time. We assume r > w > c, so that positive profits are not unattainable. To make our results more transparent, we normalize the expected profit per unit time by dividing it by the holding cost rate h. Towards this end, we normalize the cost parameters as follows:
h b - Ac Ar Aw
h= = , b=-, c= -, r= w = (1)
h h' h h' h
To ease the notation, we hereafter omit the tildes from these cost parameters. 5
Let N be the steady-state number of orders at the supplier's manufacturing facility. If we assume for now that ,u > A (this point is revisited later), then N is geometrically distributed with mean v-1, where
/-v=
lu
. (2)This parameter, which represents the normalized excess capacity, is the supplier's decision variable in our analysis, and we often refer to it simply as capacity. To simplify our analysis, we assume that N is a continuous random variable, and replace the geometric distribution by an exponential distribution with parameter v. This continuous state approximation can be justified by a heavy traffic approximation (e.g., §10 of Harrison 1988), and leads to slightly different quantitative results (the approximation tends to underestimate the optimal discrete base stock level). However, it has no effect on the qualitative system behavior, which is the object of our study.
Because the revenues for each agent are fixed, profit maximization and cost minimiza-tion lead to the same soluminimiza-tion. We employ profit maximizaminimiza-tion to explicitly incorporate the agents' participation constraints, which take the form of nonnegative expected profits. How-ever, we introduce some variable cost notation (CR and Cs) in equations (3)-(4) for future reference when discussing the inefficiency of the Nash solution (§5) and contracts that coor-dinate the system (§6). In these equations, the quantities r - w and w - c are independent of the supply chain decisions (c is the normalized capacity cost if no excess capacity is built) and represent fixed profits for the respective agents. The steady-state expected normalized profit per unit time for the risk-neutral retailer (R) and supplier (Ils) in terms of the two decision variables are given by
HR(S, V) = r - w - CR(s, )' (3) r- - E[(s- N)+ ]- bE[(N-s)+] 1 - e- VS es r-w-s+ -oab and Is(s, v) = w-c-Cs(s, ) (4) 6
= w-c-(1 - a)bE[(V - s)] - cv = - c(1 + v) - (1-)b
-3
The Centralized Solution
As a reference point for the efficiency of the two-agent system, we start by finding the optimal solution to the centralized version of the problem, where there is a single decision maker that simultaneously optimizes the base stock level s and the normalized excess capacity v. The steady-state expected normalized profit per unit time 1I (defined in terms of the total variable cost C = CR + CS) for this decision maker is
I(s, v) = ITR(, ) + TS(S, ) (5)
= r-c-C(s,v)
1 - (b + 1)e--s
r - c(l +-) -s+ v
The centralized solution is given in Proposition 1; see the Appendix or the proof.
Proposition 1 If r - c > 2cln(1 + b), then the optimal centralized solution is the unique
solution to the first-order conditions
I(s,)s =0 ys=ln(l+b),
(6)
Os On(s, u) -eVs 1av
=0 = =o -(b + 1)(vs + 1) + +2 = 0, (7) and is given by v*= ln(1b) and s*= cln(1 + b). (8) CThe resulting profit is
I(s*, v*) - r-c- 2cln(1 + b). (9)
If r-c < 2/cln(1 + b), then the system generates negative profits and the optimal centralized solution is to not operate the supply chain.
By relation (6), the ratio of the base stock level, s, to the supplier's mean queue length, y-l, satisfies s = ln(1 + b) at optimality, which corresponds to a Pareto frontier for the selection of s and v. (The corresponding first-order conditions for the discrete inventory problem is ln(v + 1)s = ln(1 + b), and so our continuous approximation can be viewed as using the Taylor series approximation ln(v + 1) . v.) Although this ratio is independent of the capacity cost c, the optimal point on this Pareto frontier depends on c via s = vc according to (8).
As expected, the optimal capacity level decreases with the capacity cost and increases with the backorder-to-holding cost ratio b. Similarly, because capacity and safety stock provide alternative means to avoid backorders, the optimal base stock level increases with the capacity cost and with the normalized backorder cost b. Finally, as expected, neither
w nor a, play any role in this single-agent optimization, because transfer payments between
the retailer and the supplier do no affect the centralized profit.
4
The Nash Solution
Under the Nash equilibrium concept, the retailer chooses s to maximize IR(S, v), assum-ing that the supplier chooses v to maximize 1-Is(s, v); likewise, the supplier simultaneously chooses v to maximize ns(s; v) assuming the retailer chooses s to maximize rIR(S, v). Be-cause each agent's strategy is a best response to the other's, neither agent is motivated to depart from this equilibrium.
Our results are most easily presented by deriving the Nash equilibrium in the absence of participation constraints, which is done in the next proposition, and then incorporating the participation constraints, nR > 0 and Is > 0. In anticipation of subsequent analysis, we express the Nash equilibrium in terms of the backorder allocation fraction c. Let us also
define the auxilliary function
f(b) (1- )b(ln(l + ab) + 1)
(1 + ab)ln(1 + b)
8
--ll_-·IIIIXIll_---____---which plays a prominent role in our analysis.
Proposition 2 In the absence of participation constraints, the unique Nash equilibrium is
~ = f(b)v*, (11)
( In(l + b) )* (12)
The resulting profits, FlM(a) and T1;(a), are
n(a) = nIR(S, ) =
r-
w -s, (13)(ln(l+acb)+2 cv
Proof: Let s*(v) be the retailer's reaction curve, i.e., the optimal base stock level given a capacity v installed by the supplier. Because (3) is concave in s, s*(v) is characterized by the first-order condition
vs*(v) = ln(1 + oab). (15)
Using a similar argument, we find that the supplier's reaction curve v*(s) satisfies
e* (s)s (V*s)s I ) (-)bS2' (16)
The unique solution to (15)-(16) is (11)-(12), and substituting this solution into (3)-(4) yields (13)-(14).
*
Because f,(b) is decreasing in a and ln(1 + ab) is increasing in a for b > 0, it follows that as a increases, the retailer becomes more concerned with backorders and increases his base stock level, while the supplier cares less about backorders and builds less excess capacity.
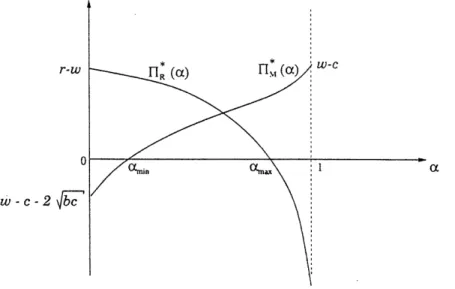
As mentioned previously, we assume that the two agents do not participate in the game unless their expected normalized profits in (13)-(14) are nonnegative. Hence, if either of these profits are negative, the Nash equilibrium (in the presence of participation constraints) is an inoperative supply chain. The remainder of this section is devoted to an analysis of these profits as a function of a. The supplier's profit II(a) is an increasing function of a that satisfies
and rI(a) is a decreasing function of a that satisfies
rI(O0) = r - w, lim Ik(ca) - -oc, (17)
as shown in Figure 1. (Many of the limits taken in this paper, e.g., a - 1, are implicitly taken to be one-sided.)
r-w
0
w-c-2 b
Figure 1: The retailer's (IIR) and supplier's (Ils) profits in the Nash equilibrium as a function of the backorder allocation fraction a.
To understand the unbounded retailer losses in (17), note that for the extreme case a = 1, the supplier does not face any backorder cost and consequently has no incentive to build excess capacity, i.e, v* = 0. This corresponds to the null recurrent case of a queueing system with an arrival rate equal to its service rate, and s = co; There is no base stock level that allows the retailer to maintain finite inventory (backorder plus holding) costs. Hence, this production-inventory system is unstable when a = 1 and the Nash equilibrium is that the retailer does not participate, and the supply chain does not operate.
More generally, there exist Camin and cmax such that FIl(a) > 0 and rI(ca) > 0 if and
only if ca E [min, Cmax] That is, the Nash equilibrium is an inoperative supply chain when
a < min or a > max,,. The threshold tma E (0, 1), and solves
-
w=ln(+
b)(b) ) (18)10
If w - c > 2bc, then camin = 0. Otherwise, amin solves
(ln(l +ab) +
2)
f (b) s (19) We have been unable to explicitly solve for amax and cOmin in (18)-(19). However, toincrease our understanding of these two equations, we investigate the solution in two extreme cases: When backorders are much less costly than holding inventory (b << 1), we have
O -max- --F W)4 ( +-r(r--w) (- )2m a2bc ( - (20)
2bc ' 4bc
When backorder costs are very large,
(r - w)2 ln(1 + b)c
amax ln(1 + b)c + (r - W)2 Lmin ln(1 + b)c + ( - )2' (21)
Even under the assumption r > w > c, it is possible that aVmin > amax in (20)-(21). In this
situation, even though each agent is willing to participate for some values of ac, it is not possible for the retailer and supplier to simultaneously earn nonnegative profits.
5
Comparison of Solutions
In this section, we compare the centralized solution and the Nash equilibrium with respect to the total system profit, the agents' decisions, and the consumers of the product.
The Nash equilibrium is inefficient. As in §4, it is convenient to first quantify the inefficiency of the Nash equilibrium in the absence of participation constraints, and then to incorporate them later. In the absence of participation constraints, the centralized solution is not achievable as a Nash equilibrium. By equations (6) and (15), the first-order conditions are vs* = ln(1 + b) in the centralized solution and s* = ln(1 + ab) in the Nash solution. Hence, the two solutions are not equal when a < 1, and the Nash equilibrium in the a = 1 case is an unstable system, as discussed earlier.
The magnitude of the inefficiency of a Nash equilibrium is typically quantified by com-paring the profits under the centralized and Nash solutions. Because the profits r - w and
w - c are fixed in (3)-(4), it is more natural to restrict ourselves to the variable costs. This assumption also allows us to follow Cachon and Zipkin and compute the competition penalty, which is defined as the percentage' increase in variable cost of the Nash equilibrium over the centralized solution. By (5) and (8), the variable cost for the centralized solution is
C(s*, I)= (v) - 1)+ + be- cv* = 2cln(1 + b),
and the variable cost C, associated with the Nash equilibrium in the absence of participation constraints is, by (3)-(4) and Proposition 2,
C; = CR(S, ) =
LC(b)I(l
+ b) + ln(1 + ab) (b)f, [ In(l + ab)
+
1In(
+ b)f,(b)Hence, the competition penalty in the absence of participation constraints is C-C(s',V*) C(s*,v*) X
100%, where
C -C(S*,v*) 1 (b l In(1 + ab) +2\ ln(1 + b)
C(s*, v*) - 2 fj kjn(1 + cfb) 1 In(ln(1 + b)f(b) (22)
Surprisingly, the competition penalty in (22) is independent of the supplier's cost of excess capacity. However, this penalty is a function of a and b, and we can simplify equation (22) for the limiting values of these two parameters. The function f,(b) is decreasing in oa and
fl(b) = 0. Hence, the competition penalty goes to oo as a - 1. At the other extreme,
f,(b) i as or - 0, and the competition penalty in this case is given by
b
n(+b) -1 for b> 0. (23)
This function is increasing and concave in b, approaches zero as b -+ 0 and grows to ooc as
b - oo.
Turning to the backorder cost asymptotics, f (b) - A as b -+ oo, and the competition
penalty approaches
1
-_ 1. (24)
2 (1-or)
This quantity vanishes at ac = 0.5, is symmetric about o '= 0.5, is convex for a E (0, 1), and approaches oo as a - 0 and a - 1. Finally, for the case b -+ 0, the competition penalty is
penalty function vanishes as a - 0 and approaches co as a - 1.
In summary, there are two regimes, (a = 0.5, b -+ oo) and (a - 0, b - 0), where the Nash equilibrium is asymptotically efficient, and two regimes, a - 1 and (a - 0, b -+ oo), where the inefficiency of the Nash solution is arbitrarily large. However, because equation (22) does not consider the agents' participation constraints, some of the large inefficiencies in the latter regimes are not attainable by the supply chain.
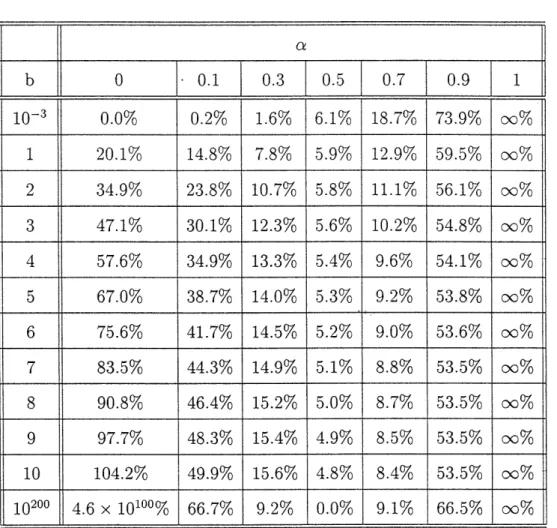
To complement these asymptotic results, we compute in Table 1 the competition penalty in (22) for various values of a and b. Our asymptotic results agree with the numbers around the four edges of this table. Two new insights emerge from Table 1. First, the competition penalty is minimized by a near 0.5 when b > 1. Second, the competition penalty appears to be an increasing function of b for a < 0.5, and a U-shaped function of b for a > 0.5.
Comparison of decision variables. Figure 2 plots the optimal Nash production ca-pacity v and the optimal Nash base stock level s as a function of a, and allows us to compare these functions to the centralized solutions, v* and s*. Excess capacity and the base stock level are alternative ways for the supplier and retailer, respectively, to buffer against demand uncertainty, and Figure 2 shows that the inefficiency of the Nash solution does not necessarly imply that these agents have less buffer resources in the Nash solution than in the centralized solution. For both decision variables, there exist thresholds on the value of a, denoted by a, and a, in Figure 2, that divide the regions where the agents have
more or less buffer resources than the optimal centralized solution. However, as shown in the next proposition, at least one agent in the Nash equilibrium possesses less of his buffer resource than the central planner.
Proposition 3 For ac and c, defined in Figure 2, we have a, > c,.
Table 1: The competition penalty in (22) in the absence of participation constraints for different values of the backorder-to-holding cost ratio b and the backorder allocation fraction a.
Proof: By Figure 2, if as < a, then there exists & E [, a'] such that v&s! > v*s*. However, this inequality together with (6) and (15) implies that f(b) = ln(1 + b), i.e., & = 1. But for a = 1 the supply chain is unstable and does not operate. Hence, vs, < v*s* for c E[0, 1), and consequently a, > a,.
*
We cannot solve for a, and oa, in closed form, except when b takes on a limiting value.
By (12),
as
satisfiesln(1 + ab) -1 (9r
ln(1 + b)fa(b) -
-As b -+ 0, we have fob(b) -+ 1 -a and ln(l+ab) -+ a. ' Therefore, as b -+ 0, ac satisfies
- 1, or acs = -1 0.618, which is the inverse of the golden-section number that 14 I .aI I I I .
b
0
0.1
0.3
0.5
0.7
0.9
1
10-3 0.0% 0.2% 1.6% 6.1% 18.7% 73.9% oo% 1 20.1% 14.8% 7.8% 5.9% 12.9% 59.5% oo% 2 34.9% 23.8% 10.7% 5.8% 11.1% 56.1% oo% 3 47.1% 30.1% 12.3% 5.6% 10.2% 54.8% oo% 4 57.6% 34.9% 13.3% 5.4% 9.6% 54.1% oo% 5 67.0% 38.7% 14.0% 5.3% 9.2% 53.8% oo% 6 75.6% 41.7% 14.5% 5.2% 9.0% 53.6% oc% 7 83.5% 44.3% 14.9% 5.1% 8.8% 53.5% oo% 8 90.8% 46.4% 15.2% 5.0% 8.7% 53.5% oo% 9 97.7% 48.3% 15.4% 4.9% 8.5% 53.5% oo% 10 104.2% 49.9% 15.6% 4.8% 8.4% 53.5% oo% 10200 4.6 x 10100% 66.7% 9.2% 0.0% 9.1% 66.5% oo% 111arises in a variety of disciplines (e.g., Vajda 1989). As b -+ oc, we have f(b) - , and n(1+ab) In this case, a, satisfies = , or a, = 0.5. Numerical computations reveal
in(l+b) t
1-that a, is unimodal in b, achieving a maximum of 0.627 at b = 1.48, and is rather insensitive to moderate values of b (e.g., a, > 0.61 for b E [1, 10]).
By (11), c, solves fa(b) = 1. As b --+ 0, this condition becomes /1 - a = 1, which gives
a, = 0. As b -+ oc, the condition becomes 1 = 1, which is solved by c, = 0.5. Note that
a,= -a, = 0.5 as b -+ oo is consistent with our previous claim that the Nash equilibrium is
asymptotically efficient in the regime ( = 0.5, b -+ oc). A numerical study reveals that c, is more sensitive than a, to the value of b. As b varies from 1 to 10, a, ranges from 0.28 to
0.49.
Customer service level. The exponential distribution of the queue length implies that the steady-state probability that a customer is forced to wait because of retailer shortages is equal to Pr(N > s) = e-"s; hence, we refer to e- s x 100% as the service level. By
equations (6) and (15), this quantity equals (1 +b)- in the centralized solution and (l+ ab)-l in the Nash solution. Hence, customers receive better service in the centralized solution than in the Nash equilibrium. Even though the system is not stable for a = 1, customers generally
desire a larger value of a; i.e., they prefer that the penalty for shortages be absorbed primarily by the agent in direct contact with them.
6
Contracts
WVe showed in §5 that the Nash equilibrium is always inefficient when the supply chain operates. In this section, we construct a coordinating contract that specifies linear tranfer payments based on retailer inventory and backorder levels, the capacity level and the cost parameters. As in our earlier analysis, this information is assumed to be common knowledge. Cachon and Zipkin also use a linear transfer payment based on inventory levels to coordinate their supply chain, and readers are referred to §1.5 of Cachon for a survey of alternative types of contracts in the multi-echelon inventory setting. We do not impose an explicit constraint that forces either agent to build a predefined level of its buffer resource. Using Cachon and Lariviere's (1997) terminology, we assume a voluntary compliance regime, where both the retailer and the supplier choose their buffer resource levels to maximize their own profits.
Although we have used profit maximization thus far, because the revenues are fixed our presentation of the contract analysis is simpler - and perhaps more natural - in the setting of variable cost minimization. Consequently, we first present the contract in the absence of participation constraints, and at the end of this section we incorporate the revenues via the agents' participation constraints. Because the model contains three cost components, the most general linear transfer payment (without loss of generality, the payment is from the supplier to the retailer) contains cost coefficients for the holding cost, backorder cost and capacity cost, which are denoted by 'Yh, Yb and yc, respectively. The steady-state expected normalized (recall from (1) that h = 1) transfer payment per unit time is given by
T(s, v) = y, (E[(s - N)+]) + thb (bE[(N - s)+]) + tccv. (27)
This transfer payment modifies the profit functions in (3)-(4) for the retailer and supplier,
16
CS(S,
Cs(S, v)
C(yh, ) + T(,
T(s,
) =
) =
-
+ b( -
+
b)-
+ ( + c)cv. (29)
The following proposition provides a general result for the coordination of static games with additive utility structures, and may be applicable to other supply chain problems.
Proposition 4 Consider a static game with n players, where player i has action space Xi
for i = 1,..., n. For any action x E X 1 x X 2 X ... X X,, the utility of player i is given
by ui(x). The utility function for the centralized planner problem is EnI= ui(x), and let
x* E argmaxx EnLI ui(x) be an optimal centralized solution. For i =A j, let Tij(x) be a linear
transfer payment that player i pays to player j if the action is x. If Tij(x) = yjui(x), where
Ej- yj = 1, then x* is a Nash equilibrium of the modified static game in which player i's
utility function is given by
Ui( ) =
ui()
-E
Ti(x) + E Tji(x).jfi j~i
Proof: By our assumptions on Tij(x), the modified utility function for player i can be written as
iii(Z)
= (1 - EYj)Ui(Z) +
-tYi
uj(x)
(30)
ji ii
N
= i E j(x). (31)
j=1
Hence, i(x) = " 5i=l i_1 ui(x), and x* is a Nash equilibrium of the modified game. I
Applying Proposition 4 to equations (28)-(29) shows that coordination in the absence of participation constraints can be achieved if
-YC = - Yb = 1 - h (32)
A comparison of equations (3)-(4) and (28)-(29) implies that the modified cost functions are given by
CR(s, v) = (1 -Yh)C(, ), CS(S, v) = YhC(s, V). (33)
This is a consequence of the more general result in (31), which shows that any split of the total profit is possible by selecting appropiate values of the {yi} parameters. Note that 7h
need not be in the interval [0, 1].
Although we appear to have a degree of freedom in splitting the profits via Yh, two conditions must be met by ah to guarantee that both agents will enter into the contract. First, both agents must be better off under the Nash equilibrium with the transfer payments than under the Nash equilibrium without the transfer payments, i.e.,
CR(S,, V') > (1 - h)C(S, V),
Cs(s> ) > AC(S ,) .
This condition can be rewritten as a/h E [(b), 7a(b)], where
ln(1 + b)
%(b) = 1 2 ln(1 + b)f,(b)'
a(b) - f,(b) (ln(1 + ab) + 2
2 In(l +ab)+l
The second condition on ah requires that both agents achieve a nonnegative profit. The resulting inequalities can be calculated using equations (3)-(4), (9) and (28)-(29). Combin-ing these two conditions, we can characterize the range of coordinatCombin-ing contracts that are attractive to both agents as
max -cln(+b) (b) h < min 2cln( +b)(b) (34)
If condition (34) is satisfied, we say that the system can be coordinated (by the contract), and the remainder of this section is devoted to an analysis of this condition. First we note that it is always possible to coordinate the system if both agents are willing to participate in the Nash equilibrium in §4. This conclusion stems from the fact that if both players are willing to participate in the Nash equilibrium, then the additional profits from the centralized solution can be split so that each agent is still willing to participate and is at least as well off as in the Nash solution. Hence, the nontrivial cases to analyze are a E [0, cOmin) and
18
_y(b) -+1 and 7a(b) - ln(1 + ) (35) Thus, because a -+ 0 implies that a < , equation (34) reduces to
Yh min 2/cln(l+b) ln(lb)(36)
If w - c > 2b, then the second term in the brackets in (36) achieves the minimum, and the interval in (36) is nonempty because b > ln(1 + b) for b > 0. Because f(b) /ln(b)
as a - 0, the inequality w - c 2 can be recognized as the supplier's participation constraint in (19) in the a - 0 case. If, on the other hand, w - c < 2v/, then (36) reduces
to
27cln( + b)
2 <Zn lC~b (37)
By (9), the interval in (37) is nonempty if and only if rI(s*, *) > r - w.
To summarize, when the supplier absorbs almost all of the backorder cost (i.e., a - O0), a coordinating contract is always possible if the supplier is willing to participate in the absence of the contract (i.e., w - c > 2). If the centralized system profit Il(s*, v*) is less than the retailer's fixed profit, r - w, then the supplier will not enter into the contract. Most interesting is the intermediate case, w - c E (2 cln(1 + b), 2/-), where the system profit is bigger than the retailer's fixed profit, but the supplier is unwilling to participate in the absence of a contract. Here, the excess system profit enables the contract to entice the supplier to participate in the supply chain.
Turning to the a - 1 case, we have f(b) -+ 0 and therefore 7To(b) - -oo and ,y(b) - 0. Thus, condition (34) reduces to
r -- W
1- - r <
Yh < 0, (38)
III
Equation (9) shows that the interval in (38) is nonempty if and only if HI(s*, v*) > w - c. Hence, when the retailer incurs almost all of the backorder cost, the contract is attractive to both parties if and only if the centralized system profit exceeds the supplier's fixed profit,
w - c. In this case, the contract coefficient ah < 0, and (33) implies that Cs(S, v) < 0; i.e.,
the retailer subsidizes the supplier's entire operation.
The analysis is more difficult in the general case, E (0, amin) U (max, 1). Here, we consider the extreme values of b. As b -+ oo, (b) - 1 -1 and '%(b) - 2-Even though (b) < Ca(b) for ao E [0, 1] in this case (this can be derived with the change of variable x = x/-), neither of these quantities are binding in (34), and coordination becomes
impossible because the lower bound in (34) is at least 1 and the upper bound in (34) goes to 0. In contrast, as b -- 0, _(b) and 5Y(b) are binding in (34), and _ (b) -+ 1 - and
%(b) - /- c- . Because 1 - < 1- c for a E [0, 1], coordination is always possible
as b - 0.
In conclusion, system coordination is most difficult when c takes on an extreme value. We can show (the proof is omitted, but the result follows from our analyses of the o - 0 and a -+ 1 cases) that a sufficient (but not necessary) condition for coordination is that the optimal centralized profit exceeds the fixed profits of both agents, I (s*, v*) > max {r - w, w - c}. Moreover, if we consider w as endogenous, then the likelihood of coordination is maximized by minimizing the right side of this inequality. This is achieved by w = (r + c)/2, which splits the fixed profits evenly. By (9), coordination is always possible in this case if r - c >
4 /cln(1 + b).
7
The Stackelberg Games
We conclude our study of this two-stage supply chain by considering the case where one agent dominates.
Supplier's Stackelberg game. When the supplier is the Stackelberg leader, he chooses
v to optimize IIs(s, v) in (4), given the retailer's best response, s*(v) in (15). This
5s5- 1 + n ( +1 + ln(1 + b)39)
The agents' profits are
(1- )bc
Is(s,, ~) = w - c - 2 (-)b ' YR(sa, ip) = r -w-S. (40)
'IS W - 2 1 + c4b ' '
Equation (39) implies that vas = v s, and hence the customer service level is the same under the Stackelberg and Nash equilibria. Because the first-order conditions of the centralized problem dictate the service level, it also follows that the Stackelberg equilibrium is inefficient relative to the centralized solution. Not surprisingly, the supplier builds less capacity and the retailer holds more safety stock in (39) than in the Nash equilibrium. The discrepancy between the Stackelberg and Nash solutions increases as a and b increase.
Now we compare the profit of each agent and the entire system under the Nash and Stackelberg equilibria. By (14), the supplier's profit in the Nash equilibrium can be written
as
_s(s, (1 - c)bc ln(1+ b)+ 2
1 + b 2 n(1 + b)+ 1
The function 2 is strictly increasing in [0, c), and is equal to 1 when x = 0. Thus, it is always the case that nS(9, vP) > s(s*, v); this is to be expected, because the sup-plier incorporates the retailer's best response when selecting his level of capacity. However, Is(Oa, Pa) = FIs(s, v,,) when a = 0, a = 1 or b = 0, and so the supplier does not benefit from being the leader in these extreme cases.
By (13) and (39), the difference in the retailer's profit between the Nash equilibrium and the Stackelberg equilibrium is
1R(s, zV) - R(9, Pa) s (1+ -
ln(1
+ +ab)
-1)
. (41)As expected, the retailer is worse off in the supplier's Stackelberg equilibrium than in the Nash equilibrium. By (8), (10), (12) and (41), the reduction in the retailer's profit from being the follower vanishes as a -4 0 and b - 0, and increases with ac and b.
A comparison of the total system profit shows that HIR(S., ve)+IIs(sf, vo) > R(a, va)+
Is (s, i,) if and only if
(1 + b) In( + b)
(1 ab)ln( - i b)- 1 + ln(1 + cab) + 1 > O. (42)
(1-a)b
Condition (42) holds for large values of ac, but is not true in general. Because the left side of (42) equals zero when a = O0, is increasing in a > a if it is increasing in a at ao, and has a derivative with respect to ca equal to 1 - when a = 0, we conclude that for b 2 the Nash solution achieves a higher system profit than the Stackelberg equilibrium for any value of a. If b > 2, the Nash solution is more efficient if and only if a > o, where is the unique positive value of a that solves (42) with equality.
Now we turn to the participation constraints. We start with the follower (i.e., the retailer) because he performs the inner maximization in this game. By (8), (10), (12) and (39), we can express the optimal Stackelberg base stock level as
s, = ln(l + b) (1 + ab) (1 - a)b'
Hence, it follows from (40) that the retailer's participation constraint, rIR(, Ma) > 0, is equivalent to
(r-w) - > ln(1 + ab) 1-. (43)
c-
The right side of (43) is increasing in a > 0, and so there exists a threshold, call it ,,max, such that the participation constraint is satisfied if and only if a < dmax (i.e., max solves (43)
with equality). For future reference, let us also define the threshold
4bc - (w - c)2
aemin = 4bc + b(w - c)2' (44)
The supplier's profit -i(S, Ma) in (40) is nonnegative if and only if a > dmin.
selecting a capacity level that raises the retailer's expected profit to zero. That is, by (15) the supplier chooses v, = tn(1+b), and the retailer subsequently selects s. = r - w. If the supplier's resulting profit (see (4)) is nonnegative, i.e.,
w-c- (r-w)(1-a)b ln( + b)c > 0, (45)
(1 + ab) ln(1 + ab) r-w
then this is the supplier's Stackelberg equilibrium for the a > emax. If (45) is violated, then the equilibrium is an inoperative supply chain.
In the second case, a E [min7, max], both participation constraints are satisfied and the Stackelberg equilibrium is given by (39). In the last case, a < amin, the supplier is unable
to earn a nonnegative expected profit, and decides not to participate. Finally; as in §4, it is possible that kmin > kmax; in this case, there is no value of a that simultaneously provides
nonnegative profits for both agents. For brevity's sake, we do not pursue asymptotics for
amin and
dmax-Retailer's Stackelberg game. The Stackelberg problem is less tractable when the retailer is the leader. However, the following proposition (see the Appendix for a proof) characterizes the solution.
Proposition 6 Let (ii, s) be the equilibirum when the retailer is the Stackelberg leader in
the absence of participation constraints. Define p > 0 to be the unique nonnegative solution
of
/32 + (3 + 2) (- -e ( - s = 0)) O. (46)
Then the Stackelberg solution is
(1 - a)b(P + 1)e-P (47)
Although we do not have a closed-form solution to the retailer's Stackelberg game, the next proposition (see the Appendix for a proof) provides a comparison between this equilib-rium and the Nash equilibequilib-rium.
Proposition 7 The following five inequalities hold:
v < ~*V so, (48)
v, _ v>, (49)
s < s3t, (50)
nR(So, Va) > UR(Sa V), (51)
Is(Oa, i1') <
Rs(,,
vo). (52)While inequalities (49)-(52) mirror our results for the supplier Stackelberg game, in-equality (48) states that the customer service level, e x 100%, is lower in the retailer's Stackelberg equilibrium than in the supplier's Stackelberg equilibrium (and the Nash equi-librium). Inequality (48) also implies that the retailer Stackelberg equilibrium is inefficient relative to the centralized solution. Analytical approximations (using e-x - I - x in (46))
and numerical computations reveal that when the service level is close to 0 or 100%, both Stackelberg games have asymptotically the same service level. The maximum difference is approximately 9.5%, and is achieved when the service level is 76.0% for the supplier's Stack-elberg game and 66.5% for the retailer's StackStack-elberg game. In a more practical example, if the supplier's Stackelberg service level is 90.0% then the retailer's Stackelberg service level is approximately 82%. Hence, the deterioration in customer service is not trivial.
Finally, numerical experiments under a wide range of values for a and b suggest that the retailer's Stackelberg game achieves a higher total profit than the supplier's Stackelberg game. However, we have been unable to provide a proof.
a resource at his disposal (the supplier chooses the capacity level and the retailer chooses the base stock level) that buffers against expensive backorders of the retailer's inventory. When the inventory backorder cost is incurred entirely by the retailer (i.e., the backorder allocation fraction a = 1), the supplier has no incentive to build any excess capacity, which leads to system instability. When the supplier incurs some backorder cost ( E [0, 1)), there is a unique Nash equilibrium in the absence of participation constraints. The Nash equilibrium is always inefficient: The agents' selfish behavior degrades overall system performance. The Nash equilibrium is asymptotically efficient in two cases: (i) The backorder cost goes to zero and the retailer is not charged for backorders, and (ii) the backorder cost goes to infinity and is split evenly between the two agents. In the absence of participation constraints, the Nash equilibrium has an arbitrarily high inefficiency in two cases: (i) The backorder cost goes to infinity and the supplier incurs all of the backorder cost, and (ii) the retailer incurs all of the backorder cost. Relative to the centralized solution, the agents in the Nash equilibrium have more buffer resources when they care sufficiently about backorders: The supplier builds more capacity than optimal when c < a, (and c, > 0.28 if backorders are more expensive than holding inventory) and the retailer has a larger than optimal base stock level when c > 0.63 (and in some cases, an even smaller threshold). However, at least one of the agents in the Nash equilibrium holds a lower-than-optimal level of his buffer resource. Finally, customers receive better service in the centralized solution than in the Nash equilibrium, and customer service improves in the Nash setting when the retailer incurs most - but not all - of the backorder cost.
We assume that the agents only participate if their expected profits are nonnegative. In the Nash equilibrium, the retailer refuses to participate when a gets sufficiently large (the inventory costs become arbitrarily large when c = 1), and the supplier may also (depending
on the cost and revenue parameters) refuse to participate when a gets too small. A simple linear transfer payment, which is based on actual inventory and backorder levels, the ca-pacity level and the cost parameters, coordinates the system in the absence of participation constraints. We derive bounds on oa for when the coordinating contract is attractive to both parties, in that each agent achieves a nonnegative profit that is no smaller than his Nash equilibrium profit. There are values of ct for which the contract will lead to the operation of an otherwise inoperative supply chain; i.e., the extra system profit generated by the contract is sufficient to entice the nonparticipating agent into playing. Overall, we find that a contract is more likely to be entered into by both agents when the system is reasonably profitable (i.e., the optimal profit of the centralized system is large) and relatively well-balanced (i.e., a is near 0.5 and the wholesale price w is intermediate between the retailer's selling price r and the supplier's manufacturing cost c). Finally, when one of the agents is the Stackelberg leader, he builds less of his buffer resource and receives a higher profit than in the Nash equilibrium, and the other agent builds more of his buffer resource and receives a smaller profit. Customer service is the same in the Nash equilibrium as when the supplier is the Stackelberg leader, but customers fare worse when the retailer is the leader.
Recall that our model is quite similar to the two-stage inventory model of Cachon and Zipkin: The two main differences are the single-server vs. infinite-server model for the manufacturing process, and our inclusion of revenue, and hence participation constraints. A key difference in the results of the two models occurs in the a = 1 case. When the supplier does not care about retailer backorders, he builds no excess capacity in our queueing model, whereas he holds no inventory in Cachon and Zipkin's inventory model. The effect of the former is an unstable system, while the effect of the latter is to turn the supply chain into a stable - albeit ineffective - make-to-order system. In Cachon and Zipkin's echelon inventory game, the Nash solution is indeed highly inefficient when a = 1, but in the local inventory game the median inefficiency in their computational study is only 1%. When a = 1 in the local inventory game, the supplier's base stock level offers him little control over the system's cost, whereas the capacity level in our model affects the entire system in a more
26
the centralized solution, whereas our agents build/hold a higher-than-optimal level of their buffer resource when their share of the backorder cost is large. Again, this may be due to the larger nonlinear effect that capacity has in a make-to-stock queue relative to the upstream inventory in a two-stage inventory model.
In our view, the make-to-stock queue is an attractive operations management model to embed into a game-theoretic framework. The model is in most ways richer than the newsvendor model and is about as complex as - but considerably more tractable than - a two-stage Clark-Scarf model. It also allows us to capture the nonlinear effect of capacity and the impact of the retailer's order process on the supplier's lead times. Of course, none of these models attempt to mimic the complexities of an actual supply chain. Nevertheless, to the extent that queueing effects are present in manufacturers' production facilities, the make-to-stock queue is a parsimonious and tractable model for deriving new insights into multi-agent models for supply chain management.
Acknowledgment.
We are grateful to Gerard Cachon for helpful discussions.Appendix
Proof of Proposition 1. The function rI(s, ) defined in (5) is continuously differen-tiable and bounded above by Ar in X = (s, v) I s > 0, v > 0}. Thus, a global maximum is either a local interior maximum that satisfies the first-order conditions or an element of the boundary of X; alternatively, there could be no global maximum if the function increases as
s -+ oo or v -+ co.
However, we have checked that limo,,, I(s, u) - -oo for > 0, and lim -oo I(s, v) --oo for s > 0, which implies that a global maximum exists. From the first-order condi-tions (6) and (7), the only interior point that is a candidate for the global maximum is
(s*, v*). In addition, the Hessian of YI(s, v) at (s*, v*) is given by
H(s*, v*) =-(
v* S*S* c(ln(l+b)+2)
V
Because ln(1 + b) > 0 for b > 0, the Hessian is negative definite and (s*, v*) is the unique local maximum in the interior of X. The resulting profit is FI(s*, v*) = r-c- 2 cln(1 + b). Finally, lim,,o H(s, v) -+ -oo for s > 0, and
n(0,
v) = r - - - + cv < r - - 247b < (s*, *)I/
Thus, (s*, v*) is the unique global maximum for Il(s, v).
Proof of Proposition 6.
for v > 0, b > 0. I
To derive the Stackelberg equilibrium, we find it convenient to define
/
= vs, (53)and rewrite the supplier's reaction curve (16) as
e =
C
-P P2 -(1- a)bs2' (54)
The one-to-one correspondence between the base stock level s and the service level parameter
/3 (recall that the service level is e- : x 100%) allows the retailer in this Stackelberg game to choose p rather than s. By (3) and (53), the retailer's profit is
nR(, ) =r-w-
(
/ - 1 + (1 + ab)e-)vy (55) Solving (54) for s and using (53) gives(56)
vP(/) = (I - )b( + )e-3
¢
Substituting (56) into (55) yields the retailer's profit as the following concave function of
P > 0: R() = r-w - 1-)b
(/3-
- + (1 + b)e-U (/3+ I)e- } 28 (57) IIis sufficient for optimality. Because 1 + arb = es a; and the denominator of (58) is always positive, condition (58) is equivalent to (46). Hence, by (46), (53) and (56), the Stackelberg equilibrium is given by (46)-(47).
*
Proof of Proposition 7. To prove (48), note that the left side of (46) is positive if > vs*. Thus, the root p of (46) must satisfy < vs*,- i.e., Id< < v*s.
To show that > v and s9 < s, we first observe that v(s) = argmax>o {fIIR(s, v)}
and a2 IR(SV) = (1a )bse-v5 < 0. Thus (e.g., Chapter 2 of Topkis 1998), 1IR(S, v) satisfies
the decreasing difference property,
d(s)< . (59)
ds
-In addition, the function e-(P3 + 1)/2 is decreasing in > 0. Hence, from (54) and inequality (48), we conclude that , _ s< . Finally, (59) and so < s implies that v,> > v,.
The retailer's profit in (57) is a decreasing function of for , > 3 /. Hence, inequality (51) follows from (48). To prove (52), i.e., Ils(P*, v) > Iis(/, i<), we first use (4) to rewrite the supplier's profit as
Is(, v)= w-c( + 1)-(1 - a)be-).
The function 1Is(/, v) is increasing in for v > 0, and so inequality (48) implies that fIs(P3*, Pa) > s(/, Pa). Hence the proof of (52) will follow if we can show that Is(/*, v,) > FIs(/*, va). For any fixed nonnegative 3, the function Is(, v) is concave in v, achieves its
only maximum at v(/) = (L-a)be and is decreasing for v E [v(3), oo). In particular, we
have v(/*) = (- < X/1 + ln(1+ ab)= This inequality and (49) imply that
) c(l+) whic(+h completes the proof of (52). b)
References
1. Agrawal, N., S. Nahmias, A. Tsay. 1999. Modeling supply chain contracts: A review. Chapter 10 in Tayur S., M. Magazine, R. Ganeshan (Eds.), Quantitative models for
supply chain management. Kluwer Academic Publishers.
2. Anupindi, R., Y. Bassok. 1999. Supply contracts with quantity commitments and stochastic demand. Chapter 7 in Tayur S., M. Magazine, R. Ganeshan (Eds.),
Quan-titative models for supply chain management. Kluwer Academic Publishers.
3. Buzacott, J. A., S. Price, J. G. Shanthikumar. 1992. Service levels in multistage MRP and base stock controlled production systems. In Fandel, G., T. Gulledge, A. Jones (Eds.), New directions for operations research in manufacturing. Springer, Berlin, 445-463.
4. Cachon, G. 1999. Competitive supply chain inventory management. Chapter 5 in Tayur S., M. Magazine, R. Ganeshan (Eds.), Quantitative models for supply chain
management. Kluwer Academic Publishers.
5. Cachon, G., M. Lariviere. 1997. Contracting to assure supply or what did the supplier know and when did he know it? Working paper, Fuqua School of Business, Duke University.
6. Cachon, G., P. Zipkin. 1999. Competitive and cooperative inventory policies in a two-stage supply chain. Management Science 45, 936-953.
7. Chen, F. 1999. Decentralized supply chains subject to information delays. To appear in Management Science.
8. Chen, F., A. Federgruen, Y. Zheng. 1999. Coordination mechanisms for a distribution system with one supplier and multiple retailers. Graduate School of Business, Columbia University, New York, NY.
30
Cyclical base stock policies with idle times. Management Science 42, 783-796.
11. Federgruen, A., P. Zipkin. 1986. An inventory model with limited production capacity and uncertain demands I: The average-cost criterion. Math. Operations Research 11, 193-207.
12. Gavirneni, S., R. Kapuscinski, S. Tayur. 1996. Value of information in capacitated supply chains. Working paper, GSIA, Carnegie Mellon University, Pittsburgh, PA. 13. Glasserman P., S. Tayur. 1995. Sensitivity analysis for base stock levels in
multi-echelon production-inventory systems. Management Science 41, 263-281.
14. Harrison, J. M. 1988. Brownian models of queueing networks with heterogeneous customer populations. In Stochastic differential systems, stochastic control theory and
applications, W. Fleming, P. L. Lions (eds.). IMA Volume 10, Springer-Verlag, New
York, 147-186.
15. Lariviere, M. 1999. Supply chain contracting and coordination with stochastic demand. Chapter 8 in Tayur S., M. Magazine, R. Ganeshan (Eds.), Quantitative models for
supply chain management. Kluwer Academic Publishers.
16. Lee, Y. J., P. Zipkin. 1992. Tandem queues with planned inventories. Operations
Research 40, 936-947.
17. Markowitz, D. M., M. I. Reiman, L. M. Wein. 1999. The stochastic economic lot scheduling problem: Heavy traffic analysis of dynamic cyclic policies. To appear in
Operations Research.
18. Morse, P. 1958. Queues, inventories and maintenance. Wiley, New York.
19. Plambeck, E. L., S. A. Zenios. 1999. Incentive efficient control of a make-to-stock production system. Working Paper, Graduate School of Business, Stanford University. 20. Rubio, R., L. M. Wein. 1996. Setting base stock levels using product-form queueing
networks. Management Science 42, 259-268.
21. Topkis, D. M. 1998. Supermodularity and complementarity. Princeton University
Press, Princeton, New Jersey.
22. Tsay, A. A., W. S. Lovejoy. 1999. Quantity flexibility contracts and supply chain performance. To appear in Manufacturing & Service Operations Management.
23. Vajda, S. 1989. Fibonacci & Lucas numbers, and the golden section: Theory and
applications. Ellis Horwood Limited, England.
24. Wein, L. M. 1992. Dynamic scheduling of a multiclass make-to-stock queue. Operations
Research 40, 724-735.
25. Zheng, Y., P. Zipkin. 1990. A queueing model to analyze the value of centralized inventory information. Operations Research 38, 296-307.
32