HAL Id: tel-00967318
https://tel.archives-ouvertes.fr/tel-00967318
Submitted on 28 Mar 2014
HAL is a multi-disciplinary open access archive for the deposit and dissemination of sci-entific research documents, whether they are pub-lished or not. The documents may come from teaching and research institutions in France or abroad, or from public or private research centers.
L’archive ouverte pluridisciplinaire HAL, est destinée au dépôt et à la diffusion de documents scientifiques de niveau recherche, publiés ou non, émanant des établissements d’enseignement et de recherche français ou étrangers, des laboratoires publics ou privés.
Diversity and Evolution in tropical rainforest trees:
example of Eperua falcata in French Guiana
Louise Brousseau
To cite this version:
Louise Brousseau. Diversity and Evolution in tropical rainforest trees: example of Eperua fal-cata in French Guiana. Biodiversity and Ecology. Université de Lorraine, 2013. English. �NNT : 2013LORR0188�. �tel-00967318�
0 Collegium Sciences & Technologies
Ecole Doctorale RP2E
Thèse
présentée pour l'obtention du titre de
Docteur de l'Université de Lorraine
en Biologie Végétale et Forestière
par Louise BROUSSEAU
Diversité et Evolution des Arbres de Forêt Tropicale Humide:
Exemple d’Eperua falcata en Guyane française.
Soutenance publique le 10 Décembre de l’an 2013
Membres du jury :
Rapporteurs : Sophie KARRENBERG Professeur associé, Université d’Uppsala, Suède Santiago GONZALEZ-MARTINEZ Directeur de recherche, INIA Madrid, Spain Examinateurs : François LEFEVRE Directeur de recherche, INRA Avignon, France
Benoît PUJOL Chargé de recherche, CNRS Toulouse, France Sylvain DELZON Chargé de recherche, INRA Bordeaux, France Ivan SCOTTI (directeur de thèse) Directeur de recherche, INRA Kourou, Guyane Erwin DREYER (directeur de thèse) Directeur de recherche, INRA Nancy, France
---
INRA, UMR EEF (« Ecologie et Ecophysiologie Forestières », Champenoux, France) & INRA, UMR EcoFoG (« Ecologie des Forêts de Guyane », Kourou, Guyane française)
2
Foreword ... 4
Acknowledgements ... 6
SYNTHESIS ... 10
INTRODUCTION - Evolution in Amazonia ... 12
1. Short overview of the Amazonian rainforest ... 12
2. The building of biodiversity in Amazonia ... 15
3. The maintenance of diversity in Amazonia: a subtle combination of chance and determinism ... 22
4. Spatial heterogeneity in the Amazonian rainforest ... 24
5. Tree species model, research questions and study sites ... 32
PART 1 - Molecular evolution: population genetics and genomics ... 38
1. Population evolution ... 38
2. Population differentiation: the complex interplay between gene flow, selection, and drift. ... 50
3. Neutral differentiation ... 52
4. Adaptive differentiation ... 60
5. Next generation sequencing / genotyping and new opportunities ... 74
PART II - Phenotypic evolution and quantitative genetics ... 81
1. Causes of phenotypic variation ... 81
2. Phenotypic evolution in populations ... 91
3. Phenotypic differentiation ... 94
DISCUSSION ... 105
1. Neutralism and adaptation in Eperua falcata ... 105
2. Open questions and perspectives ... 111
3. Importance of assessing genetic diversity in a changing world ... 113
PhD RESULTS & DEVELOPMENT OF BIOINFORMATIC TOOLS... 117
Article n°1 - Molecular divergence in tropical tree populations occupying environmental mosaics ... 119
3
Article n° 2 - Genome scan reveals fine-scale genetic structure and suggests highly local
adaptation in a Neotropical tree species (Eperua falcata, Fabaceae) ... 147
Bioinformatic tools ‘Rngs’: A suite of R functions to easily deal with next-generation (454-)sequencing data and post-process assembly and annotation results. ... 171
1. Introduction to bioinformatics ... 171
2. Short description of ‘Rngs’ ... 172
3. Short overview of the functions ... 173
4. Detailed description of the functions ... 173
Article n°3 - High-throughput transcriptome sequencing and polymorphism discovery in four Neotropical tree species. ... 179
Article n°4 - Highly local environmental variability promotes intra-population divergence of quantitative traits: an example from tropical rainforest trees ... 197
Article n°5 - Local adaptation in tropical rainforest trees: response of E. falcata (Fabaceae) seedling populations from contrasted habitats to drought and to water-logging ... 227
Preliminary results - Reciprocal transplants ... 244
4
Foreword
This PhD was supported by a CJS INRA leading to a two years post-doctoral contract. My research work was carried out in two INRA mixt unit research “EcoFog” (Ecology of Forests of French Guiana) and “EEF” (Forest Ecology and Ecophysiology) and supported by MEDD ECOFOR ‘Ecosystèmes tropicaux’, PO-FEDER ‘ENERGIRAVI’ and ‘CEBA’ (Labex) research programs.
This manuscript was written as a global synthesis containing the state of the art, the main results and a general discussion. I tried to link ecology and population evolution in a global ‘ecological genetics’ approach. Particular theoretical notion and methods were included into ‘green’ and ‘purple’ boxes respectively. A synthetic summary of each main result was integrated in the synthesis through a topic sentence, a short description of the experiment and the main figures.
Complete methods and results are described in research articles, and given a part from the global synthesis. For more readability, figures and tables were included in the main text of research articles rather than giving them a part.
For more simplicity and to avoid redundancies, I merged the bibliographies of synthesis and research papers into a single bibliography.
6
Acknowledgements
Je remercie chaleureusement toutes les personnes qui m’ont aidée, accompagnée, soutenue et participé à l’aboutissement de cette thèse.
Je tiens cependant à addresser des remerciements tout particuliers …
A mes directeurs de thèse, Ivan Scotti et Erwin Dreyer,
Qui ont su guider ma réflexion pendant ces trois années, apprivoiser mon énergie et apaiser mes craintes. Ivan, je te remercie de m’avoir transmis tes savoirs avec passion, et de m’avoir offert un enseignement d’une grande qualité scientifique. Je te remercie aussi
de l’habileté avec laquelle tu as su m’octroyer une immense liberté, tout en sachant canaliser mes ambitions. Je te remercie Erwin de ton soutien pendant ces trois années de
thèse, et de tes précieux conseils en écophysiologie. Je te remercie aussi d’avoir pris le temps de te rendre en Guyane chaque année pour suivre ma thèse et de m’avoir
accompagnée chaque fois sur le terrain ! ∞
A Damien Bonal,
Pour m’avoir gentiment confié ses données issues des expérimentations de « common garden » et « traitements hydriques » qui auront occupé une part importante de ma thèse
et m’ont permis de croiser les approches moléculaires avec des approches
écophysiologiques. Je te remercie de tout le soin apporté à répondre à mes questions, suivre avec attention les analyses de données et participer à la rédaction des deux articles associés. Je te remercie aussi de m’avoir accueillie dans ton bureau à Nancy et d’avoir
activement participé au nettoyage des données de l’expérimentation de traitements hydriques, analyses et interprétations.
∞
A Caroline Scotti-Saintagne,
7
AFLPs. Je te remercie aussi des excellents moments bio-info passés ensembles ! Merci aussi de ta douceur, et de ton calme : tu as été d’un grand soutien tout au long de ma thèse,
car ta présence au labo suffit à calmer les esprits, à nous calmer tous et ça nous fait du bien !
∞
A Pauline Garnier-Géré,
Sans qui je n’aurais jamais osé ouvrir la boite noire de la génétique à haut débit ! Je te remercie d’avoir guidé l’analyse du transciptome de l’Eperua falcata et de m’avoir fait partager tes scripts et ta passion pour la génétique des pops et la génomique. Je te remercie
fortement de l’esprit critique avec lequel tu as travaillé à l’article de 454, et de m’avoir enseigné la rigueur scientifique.
∞
A Marie-Pierre Etienne et Jean-Jacques Boreux,
Qui m’ont aidé à apprivoiser les bases de la modélisation bayésienne, à utiliser « OpenBUGS » et « JAGS ». Je vous remercie du précieux temps que vous avez accordé à
répondre à mes nombreuses de questions et à vérifier mes scripts. ∞
A l’équipe d’Ecologie des populations d’EcoFoG,
Pour m’avoir accueillie dans leur labo pendant deux stages d’abord, puis pendant mes trois années de thèse, et avec qui j’ai passé d’excellents moments ! Je vous prie d’excuser avec
un peu de retard le bazar que j’ai pu mettre au labo, mes oublis, mes maladresses qui ont coûté la vie à quelques verreries… Je remercie tout particulièrement Eliane Louisana et Valérie Troispoux, « colonne vertebrale » du laboratoire, qui assurent pour que l’on puisse travailler dans de bonnes conditions. Leurs minutieuses petites mains inspectent, rangent,
réparent, remplacent pour nous permettre à tous de travailler dans la bonne humeur ! Merci aussi Eliane de tes précieux conseils de laboratoire (merci à ta double dé-protéinisation), et merci d’avoir toujours répondu présente dans les moments délicats, quand la centri nous lâche, ou quand les UV vacillent… Merci Saint-Omer de m’avoir accompagné sur le terrain, d’avoir sué avec moi à la mise en place des transplantations réciproques, et d’avoir encadré les étudiants FTH lors des campagnes de mesures. Merci de
m’avoir fait partager ta passion de la nature et tes récits forestiers, malgré tous mes efforts pour me perdre, Maskilili ne m’a pas eue ! Merci Alexandra et François pour les bons moments que l’on a passé ensemble en bioinfo, de l’installation de notre poste linux à
8
l’annotation de nos transcriptomes, on s’est bien éclatés dans le bureau des thésards ! Je remercie aussi Stéphanie Barthe, et repense avec joie à notre séjour à Ottawa, au dix-huitième étage du « Westin » où nous avons passé une excellente semaine scientifique ! A tous les membres du laboratoire, j’ai adoré nettoyer le labo et dégivrer les congélos en votre
compagnie ! Je remercie aussi Stéphane Traissac pour son eternelle bonne humeur, ses éclats de rires et coups de poing sur la table ! Merci aussi de m’avoir confié tes étudiants sur le terrain dans le cadre des 3 modules FTH auxquel j’ai eu l’honneur de participer. Je remercie aussi Bruno Ferry (pas vraiment EcoFoG mais néanmoins pillier fondateur et surtout mascotte presque officielle du module FTH) pour m’avoir aidée à l’analyse pédo de mes sites de transplantations ! Je remercie enfin Céline Leroy pour m’avoir prêtée son
appareil photo, et avoir pris le temps de participer à l’analyse des photographies hémisphériques
∞
A l’UMR EcoFoG dans son ensemble,
Je vous remercie d’avoir accueilli avec autant de bienveillance mon travail de thèse. Je remercie la direction de l’UMR, Eric Marcon et Marc Gibernau, ainsi que le service
d’appui (Josie, Catherine, Sylvie, Carole et Amycelda) pour leur dévouement. ∞
A mes amis et tous ceux qui m’ont bien fait marrer depuis mon arrivée en Guyane, il y a 5 ans déjà…
Je remercie tout d’abord Julien Engel pour son soutien quotidien et son eternel calme. Merci de nous avoir supportés, ma thèse et moi, d’avoir accepté mon côté geek, de m’avoir
nourrie tous les jours de bons petits plats préparés avec soin, d’avoir été là ! Je remercie Marion Chartier pour avoir été ma plus fidèle amie Guyanaise : merci pour tes pas de danse (« chtouc, chtouc »), nos sorties endiablées, ton parapluie, et ta robe de touloulou (elle a certes un peu déteint, mais c’est une preuve que j’en ai fait le meilleur des usages :
danser… et forcément transpirer !).
Je remercie Seb’ pour tous ces bons moments passés depuis mon arrivée en Guyane, les tournées des grands ducs, de l’Yguana au Beau Bourg, du vieux monmartre au Clibberton,
les soirées carnaval à n’en plus finir... Je remercie Damien et Isa de nous avoir accueillis à Cayenne les week-ends de désoevrement, et d’avoir animé Noëls et Nouvel ans ! Je remercie aussi les collègues du campus agronomique avec qui je n’ai pas travaillé mais avec qui je me suis bien amusée : merci Benjamin (Leudet) et Olivier, Fabien (Wagner) et
9
Julia, et merci Guillaume (Odonne) ! Je remercie aussi le staff « dentistes », à commencer par Jaouad et Jenna, Abdel et Dounia, Saïd, Mathieu, et tous les autres ! Merci aussi Gersende et Vincent pour les excellents moments passés ensembles ! Je remercie enfin le
quartier du Vieux Bourg, l’Yguana, Roukmout et Gégé !
Mon départ de Guyane approchant, je voudrais vous dire à quel point vous allez me manquer, mais comme dirait Spartacus…
10
SYNTHESIS
In this section, I explore the process of evolution in tropical
rainforests. I perform a survey of the literature and review the
building of diversity in Amazonia, as well as the structuring of
genetic diversity in neotropical trees. I also present important
notions of population and quantitative genetics and introduce
the main methods to study population evolution. This section is
composed of two parts, molecular and phenotypic evolution
respectively. The main PhD results are summarized into orange
12
INTRODUCTION - Evolution in Amazonia
1. Short overview of the Amazonian rainforest
Climate:
The Amazon’s climate is influenced by its tropical location: the temperatures are globally stable (27°C in average), precipitations are abundant (2000-4000mm/year), and relative air humidity is high (80 to 90% of saturation). The seasonality is influenced by the latitudinal movements of the inter-tropical convergence zone (the belt of low pressures where the northeast and southeast winds come together causing cumulonimbus) with two main seasons: the dry season (July to
November in Guiana), and the rainy season (November to July interspersed by a short dry season during March in Guiana). The intensity of the dry season in Amazonia varies across years, and cyclic intense drought events (due to ‘El nino events’) occurred every 4 to 8 years (Figure 1).
Carbon storage and biodiversity:
The tropical rainforest of Amazonia is one of the most important wilderness areas of the world (Cincotta et al. 2000, Anhuf et al. 2006, Figure 2). Spread over 7.3 million km², Amazonia is home for a luxurious tropical rainforest that covers 9 countries (Brazil, Peru, Bolivia, Colombia, Ecuador, Venezuela, Guyana, Suriname, and French Guiana plus parts
Figure 1 : Annual global temperature anomalies and El nino events (1950-2012). From http://www.ncdc.noaa.gov.
13
of Venezuela, Brazil and Columbia), figure 3. The Amazonian Basin is composed of 43 ecoregions (figure 3), in which the Guiana shield (French Guiana, Suriname and Guyana) corresponds to the ‘Guianan moist forest’ ecoregion.
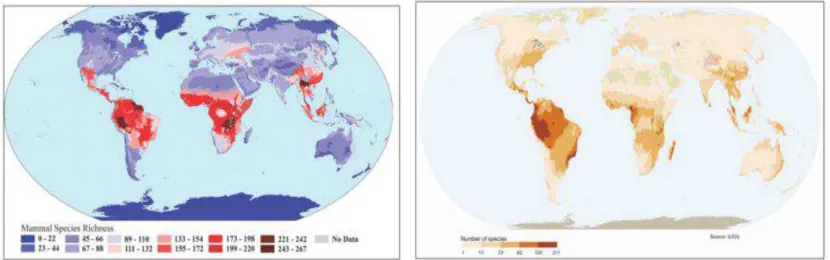
Tropical rainforests constitute an important store of carbon (about 40% of the total carbon store in the terrestrial biomass, Anhuf et al. 2006, ter Seege et al. 2006). The total carbon stored by tropical rainforests is estimated to 247 PgC (with an annual net primary production of 17.8 PgC, Field et al. 1998, Figure 4). Moreover, the tropical rainforest of Amazonia is one of the world’s greatest stores of biodiversity (ter Seege et al. 2006, Hoorn et al. 2010), including insects, mammals, amphibians, and plants (Figure 5). In particular, the tropical rainforest of Amazonia is home for ~50000 vascular plant species, among which ~12500 tree species (Hubbell et al. 2008). Moreover, in undisturbed forests, tree species diversity may easily reach 100 tree species /ha, as currently observed in French Guiana (Figure 6).
Figure 2 : Major Biodiversity hotspots (red) and wilderness areas (green). From Cincotta et al. 2000 Figure 3 : Tree cover map (per cent) and ecoregions across the Amazon basin. From Mayle & Power 2008.
14
Figure 4: Net primary production (in grams of C per square meter per year). Form Field et al. 1998.
Figure 5: Global diversity of mammal (left) and amphibian (right) species (in number of species). From Olson et al. 2001 and the IUCN Red List 2009. 221 119 203 243 230 234 54.72 58.08 48.96 50.72 0 50 100 150 200 250 300
E20 E21 E22 F21 G20 H22 P1 P6 P11 P13
N t re e sp ec ies / h a NOURRAGUES PARACOU
Figure 6: Tree species diversity (number of tree species/ha) in several plots of two experimental devices of French Guiana (Nouragues and Paracou). Data from Paracou and
15
2. The building of biodiversity in Amazonia
The building of biodiversity in Amazonia through geological ages has been studied for a long time, and both geological and climatic histories of the Amazonian region allow understanding the present diversity. In particular, tectonic events (Andean Uplift during the Tertiary) and climatic changes (quaternary glaciations) had a crucial role in species diversification in Amazonia.
Tertiary - Andean Uplift: (Hoorn et al. 2010)
Andes formations began when continents broke-up (from -135 to -100 My before present, figure 7). From -65 to -23 My (paleogene), tectonic events in the ‘pan-Amazonian’ region (the region corresponding to modern Amazonia) formed a sub-andean river system. North and Nort-West of pan-amazonia were submitted to the alternance of fluvial and marine conditions (due to marine introgressions), figure 8.
Figure 7: Continental drift. (from http://www.geopedia.fr/derive-continents.htm)
16
During this period, South America was colonized by xenarthrans, reptilians, and plant groups through the gondwana connection with Australia and Antartica (figure 9A), and floral diversity varied with temperatures (with decreases in plant diversity during cool periods).
The first peak of the Andean mountain appeared around -23 My, and coincides with the diversification of modern montane plant and birds genera (figure 9B and figure 10). During Neogene, the coupling of tectonic and climatic processes strongly affected the biodiversity in Amazonia. As mountain raised, rainfall increased along the eastern flank. In parallel, a large wetland of lakes and swamps developed in Western Amazonia (figure 11C).
Lake formation was accompanied by mollusk and reptilian diversification (figure 9). The Amazonia was thus composed by a wetland and a diverse forest comparable with the modern forest.
Figure 9: Biotic changes in Amazonia through time (from Hoorn et al. 2010).
17
Pollen recorded revealed a peak of plant diversity at -13My at the end of the middle Miocene climatic optimum (-20 to -10 My). From 10 My, Andean uplift phases accelerated and Andean sediments reached the Atlantic (figure 11D). Western Amazonia changed from a lacustrine to a fluvial system that corresponds to modern Amazonia river. Accelerations in Andean building induced spectacular radiations of highland plants, and flood-plains became covered by grasses. Moreover, the Andes became a barrier for tropical rainforest trees, because many lowland organisms were unable to disperse across the mountain (Cavers & Dick 2013). The transition from lake to fluvial conditions also affected the diversity of endemic marine animals (mollusks) unable to adapt to new conditions (figure 9).
From -7 to -2.5 My, Andean sediment supply created terrestrial conditions in west
Amazonia (figure 12). Until the Pliocene, bats and plants (Malpighiaceae, Fabaceae, Annonaceae, Rubiaceae …) migrated from boreotropical regions. 3.5 My ago, the closure of the Panama isthmus allowed migration and diversification of taxa from North America.
Figure 11: Geologic history of Amazonia from -23My to -7My (from Hoorn et al. 2010)
18 Quaternary ice ages:
The Pleistocene was characterized by repeated glacial periods, in which the last glacial maximum occurred (LGM) at -20 000 years (figure 13). Glacial periods were associated with a decrease in temperature in Amazonia, ranging from 2 to 6°C during the LGM (Broccoli 2000, Anhuf et al. 2006), figure 14. Cooler periods were also associated with a decrease in precipitations (between 20 and 30% during the LGM, Stute et al. 1995, Cowling et al. 2001, Anhuf et al. 2006), leading to a drier climate in Amazonia.
Species evolution in Amazonia through ice ages has been strongly debated. Two main hypotheses have emerged: the ‘refuge hypothesis’ and the ‘species re-association hypothesis’.
Figure 13: Glacial and interglacial cycles of Pleistocene (from Wikipedia).
Figure 14: Map of annual mean surface air temperature difference between LGM and modern integrations, in Kelvin (from Broccoli 2000).
19
The ‘refuge hypothesis’ suggests that the tropical rainforest was fragmented into refuge islands during dry periods: the Amazonian basin changed into savanna punctuated with isolated patches of tropical rainforest (i.e. movements of the whole plant communities). LAI was probably lower in a large area of the Amazon Basin than today (Cowling 2001). Anhuf et al. (2006) used pollen records to map South America and Africa vegetation during the LGM (figure 15). They suggest that Amazon evergreen forest was located 200km further south and 300 km further north than the modern forest. More recently, Mayle & Power (2008) described sites that show signs of transition from forest to Savannas during the mid-Holocene. Isolation between these islands would have led to high rates of allopatric speciation and is supposed to be responsible for spatial patterns of species diversity and endemism (Haffer 1969).
The ‘species re-association’ hypothesis suggests that cooling induced changes in species compositions but not in biomes: because species respond individually to physiological constraints (Collinvaux et al. 2000), climate change would have impacted the abundance of species (and species distributions), leading to species re-associations (Bush & De Oliveira 2006). For example, the abundance of mountain taxa would have decreased, while lowland pollen taxa have increased in Peruvian Andes during the LMG (Bush et al. 2004). However, this hypothesis suggests that tree cover remained stable. In particular, pollen records show a continuum of forest pollen through the LGM (figure 16; Colinvaux et al. 2000, Da Silveira Lobo Sternberg 2001), even with an increasing abundance of grass in
Figure 15: Vegetation map during the LGM (from Anhuf et al. 2006): evergreen forests (black), semideciduous forests (dark grey), dry forest or savannah (grey).
20
many areas that not necessarily traduces a drier climate (Colinvaux et al. 2000).
Both hypotheses agree that the forest was different from today, because it experienced transformations in floristic composition during the glaciations.
Much of Neotropical diversity was primarily influenced by Tertiary (Andean Uplift) and Quaternary (climatic changes) events. However, the actual triggers of speciation are probably more complex, involving factors such as adaptation to habitat heterogeneity and biotic interactions.
22
3. The maintenance of diversity in Amazonia: a subtle combination of chance and determinism
Two main theories are evoked to explain community assembly and the maintenance of high diversity across tropical rainforest landscapes: Neutralism and Determinism. The contrast between the neutralist and the determinist theories of community assembly is quite comparable to the contrast between neutral and adaptive (molecular) evolution of populations.
Under the unified neutral theory of biodiversity (Hubbell 2001), meta-community dynamics is governed by the speciation-extinction equilibrium in which the size of populations changes randomly (‘ecological drift’), eventually leading to extinction, and populations exchange individuals according with dispersal distance between them (Ricklefs, 2006). Thus, species assemblages are random subsets of the available pool of species able to spread in a given area (Tuomisto & Ruokolainen 1997). Even if this model is often unrealistic (Ricklefs, 2006), it accounts for most of the observed patterns of species abundance in tropical communities, suggesting that neutral process play a crucial role in community assembly (Chaves et al., 2003). From an evolutionary point of view, populations may evolve neutrally (under the combination of random mutation, migration, genetic drift and demographic events). In theory, populations may diverge into separate species if gene flow is restricted, either by a biogeographic barrier, or by the geographic distance between populations (also called isolation-by-distance). In such cases of allopatric speciation, the probability to observe a given species in a given area is thus a function of the dispersal abilities of the neighborhood populations of this species (Latimer et al. 2005). The great diversity observed in Amazonia, by comparison with temperate forests, is commonly explained by differences in speciation-extinction rates that are themselves dependent on the size of the climatically similar area. The main hypothesis is that there is a positive relationship between an ecoclimatic zone and the geographic range size of a species. Subsequently, two main hypotheses could explain the great diversity of the tropics: ‘museum’ and ‘cradle’ (Chown & Gaston 2000, Mittelbach et al. 2007, Arita & Vazquez-Domingez 2008). The ‘museum’ hypothesis postulates that there is a negative relationship between the geographic range size of a species and its likelihood of extinction. This is because large ranges should buffer species against extinction by reducing the probability of range wide catastrophes and because large population sizes would minimize the chance of extinction due to stochastic reasons. Because large species range sizes are typical of the
23
tropics, tropics should act as a museum of diversity with low extinction rates with older taxa by comparison with temperate zones. The ‘cradles’ hypothesis postulates that there is a positive relationship between the geographic range size of a species and the likelihood of its speciation. This is because species with larger ranges are more likely to undergo allopatric speciation resulting from isolations-by-distance or isolations by biogeographic barriers. Tropic may thus be viewed as cradles of diversity, with high speciation rates.
In the ‘environmental filtering’ theory, species assemblages are controlled by determinist factors involving abiotic and biotic interactions (Wright 2002). In particular, habitat heterogeneity (Terborgh et al. 2002) and local interactions (mainly competition and predation) are commonly evoked as important drivers of diversity in tropical landscapes. Environmental filtering exerted by both abiotic and biotic factors would have led to niche partitioning and habitat specialization in tropical rainforest trees. From an evolutionary point of view, the evolution of populations and the divergence between species may have been driven by selective pressures exerted by environmental heterogeneity (sympatric speciation). Moreover, habitat heterogeneity is associated to disturbance gradients (particularly logging, and tree-fall gaps). Under the disturbance hypothesis, species diversity is enhanced by intermediate levels of disturbance, as observed in French Guiana (Molino et al. 2001). Another determinist hypothesis evokes density-dependant mortality around mother trees. This hypothesis was formulated by Janzen (1970) who observed a decrease in seedlings mortality with the distance to the mother trees, probably due to allelopathic chemical compounds or to density-dependent predation. This process leads to ‘gaps of regeneration’ around mother trees, allowing the installation of other tree species and preventing mono-specific assembly. However, this process remains poorly understood and documented.
Neutrality and determinism probably act in pair in governing species evolution and assembly structuring (Gravel et al. 2006, Jabot et al. 2008), and their relative effects probably vary across geographical scales and study areas (Gravel et al. 2006, Jabot et al. 2008). In the following section, I will focus on spatial heterogeneity in tropical landscapes (and particularly that observed at local scales) without, however, excluding the existence of neutral processes.
24
4. Spatial heterogeneity in the Amazonian rainforest
Environmental heterogeneity across forests landscapes
At continental and regional scales, both precipitations and the intensity of the dry season are the main causes of climatic variations across the Amazonian forest landscape: while temperatures are quite homogeneous, precipitations show large variations among regions (ranging from 1000 to 3000 mm per year, figure 17) with a precipitation gradient that increases from Southeast to Northwest Amazonia (Mayle & Power 2008). Moreover, the intensity of the dry season is more pronounced at the extreme of the gradients, where precipitations are the most abundant. French Guiana also exhibits a large gradient of precipitations that increases from west to east, figure 18 (Wagner 2011).
Figure 17: Annual precipitations and precipitations during the driest three months in the Amazonian basin, in mm. From Mayle & Power 2008.
Figure 18: Annual precipitations in French Guiana in mm/yr. From Wagner 2011.
25
At local scale, large environmental variations are caused by soil factors related to topography (figure 19). Despite its apparent homogeneity, the tropical landscape of Amazonia displays complex habitat patchiness due to the alternation of water-logged bottomlands and terra-firma. Local topography causes strong differences in environmental factors (including water, light, and nutrient availability) among local micro-habitats.
In bottomlands, plant communities are established on hygromorphic soils submitted to seasonal or permanent water-logging and frequent flooding events. As in temperate ecosystems, water-logging is a major constraint for tree regeneration and growth. Water-logging decreases the solubility and transfer of o2 in the soils. Due to root and soil microbial respiration, oxygen quickly decreases in soils; leading to hypoxia and accumulation of CO2 (Ponnamperuma 1972, Kozlowski 1997) that in turn affects root and microbial respiration (Epron et al. 2006). Moreover, water-logging leads to production of reactive oxygen species by roots that causes oxidative stress (mainly, H2O2 is produced by mitochondria when respiration slow down), Perata et al. 2011. In parallel, hypoxia causes a decreases in the root permeability that subsequently affect water and nutrient uptake from the soil, causing stomatal closure and a decrease in photosynthesis (Perata et al. 2011). On the contrary, terra-firme (slopes and hilltops) are display ferralitic and well-drained soils allowing important vertical and lateral drainage. Thus, terra-firme soils usually display lower water content than bottomlands. Tree communities, particularly seedlings unable to directly uptake water from the ground water table, may experience seasonal drought stress due to the depletion of water from at least the upper soil layers (Bonal et al. 2000, Daws et al. 2002, figure 20).
Figure 20: Seasonal variations of soil metric potential in different soil types (circles=bottomland, squares=slopes, triangle=plateau). From Daws et al. 2002. Figure 19: Soil properties along topography gradients (from Sabatier et al. 1997). Mainly, DVD=deep vertical drainage, Alt=red alloteriet, SLD= superficial lateral drainage and SH= hydromorphic soil.
26
Moreover, soil fertility varies from hilltops to bottomland. Reductions in soil respiration affect nitrogen cycling in bottomlands (Luizao et al. 2004) that commonly contain less nitrogen than hilltops or slopes (figure 21) but frequently contain more phosphorous than hilltops (Ferry et al. 2010). Last, topography gradients are associated with variations in irradiance transmitted below the canopy. As the soil is instable in slopes and water-logged soils, tree-fall gaps occur more frequently in slopes and bottomlands (Marthews et al. 2008, Ferry et al. 2010), figure 22.
Consequences of spatial heterogeneity on plant communities:
At regional scale, the structure and composition of plant communities may vary along rainfall gradients, as proposed by numerous studies (Givnish, 1999, Engelbrecht & Kursar, 2003, Condit et al. 2004). However, discerning whether adaptive or neutral processes are involved is a complex issue at such large scales. In the particular case of Amazonia, rainfall is supposed to exert a small effect on species diversity, whereas a strong effect of local patchiness is evident (ter Steege & Hammond 2001).
At local scale, large variations of plant community composition and diversity vary along topographic gradients. The most obvious variation of plant communities is the large increase in palm biomass in bottomlands (Kahn 1987, figure 23) and variations in tree species composition. Indeed, numerous palm and tree species are significantly associated to a particular habitat-type (Clark et al. 1999, Vormisto et al. 2004, Baraloto et al. 2007). This statement is commonly invoked as a result of adaptive radiations caused by topography leading to niche partitioning and habitat specialization. However, several studies suggested that the majority of species is generalists regarding to local habitat (figure 24, Webb & Peart 2000, Valencia et al. 2004) and their distribution is probably constrained by dispersal without being influenced by habitat heterogeneity.
Figure 21: Net nitrification during 10 days of soil incubation in different soil types. From Luizao et al. 2004
Figure 22: Tree fall gap. From Matthews et al. 2008
27
Several topographic and soil variables are however particularly relevant for explaining tree community composition and structuring (ter Steege et al. 1993, Clark et al. 1999, Sabatier et al. 1997, Kanagaraj et al. 2011), including slope, elevation, soil water availability, drainage, and water logging, figures 25.
Even if a majority of studies focus on one or several environmental factors or topographic variables, the structure of plant communities probably results from a complex superposition of factors (among which local irradiance, nutrient availability, water-logging and drought). Thus significant habitat-associations are commonly explained by species sensitivity to the underlying constraints: Engelbrecht et al. (2005, 2007) and Poorter et al. (2008) proposed drought, Paliotto et al. (Palmiotto et al. 2004) suggested irradiance, Lopez et
Figure 25: Left: Canonical correspondence analysis for environmental variables: soil types, topographical positions, slope and elevation (from Clark et al. 1999); Right: Vegetation ordination after correspondence analysis: symbols
indicates different soil types differing in drainage and hygromorphy: (from Sabatier et al. 1997) Figure 23: Schematic representation of plant communities along
a topography gradient. From Kahn et al. 1987. Figure 24: Venn diagram showing associations of tree species to three local habitats (from Webb & Peart 2000).
Circle intercepts show species encountered in different habitats.
28
al. (Lopez & Kursar 2003) proposed both flood and drought, whereas Baraloto et al. (Baraloto et al. 2005) proposed both nutrients and light. For example, a field experiment revealed a reversal of performance ranking among species between local situations (Baraloto et al. 2005), suggesting different degrees of sensitivity to constraints among species. Thus, adaptation to a particular habitat may partly explain the differences in community composition and species abundance among micro-habitat.
Local habitat patchiness is also associated with large variations of tree biomass and functional traits. In bottomlands, tree biomass is lower than in terra-firma (Kahn 1987, Ferry et al. 2010), probably because soil instability constrains a more superficial root anchorage and limits tree growth. Moreover, Kraft et al. (Kraft et al. 2008) found a significant structuring of functional traits at the community level in Ecuador, which is also consistent with a role of habitat filtering, figure 26. Another kind of phenotypic structuring commonly observed in tropical rainforest
is the ability of trees to develop morphological particularities, particularly in bottomlands. For example, buttress or stilt roots prevent constraints due to soil instability, whereas adventitious roots, lenticels, and aerenchyma tissues allow partial maintenance of root respiration in water-logged habitats, by allowing oxygen uptake directly from the air and oxygen transport to roots (Kozlowski 1997, Parelle 2010).
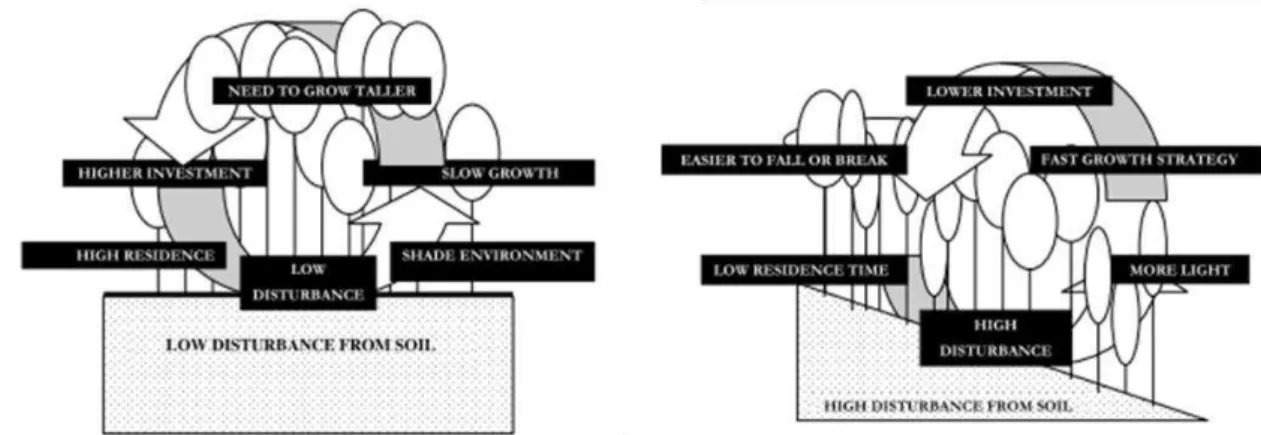
The entire forest dynamics vary along topographic gradients: canopy opening events created by frequent tree-fall gaps are also proposed as a driver of diversity in meta-communities (Schnitzer 2001, Robert 2003), by allowing establishment of light-demanding pioneer species and thus, creating patches of regenerations in the middle of mature communities composed by a majority of shade-tolerant tree species (Denslow et al. 1987, Schnitzer 2001, Ferry et al. 2010). Quesada et al. (2009) categorized forest dynamics according to a function of disturbance from soils, see figure 27.
Figure 26: Distribution of SLA (expressed as a deviance from null distribution) in relation with local topography.
29
Consequences of spatial heterogeneity on population evolution & species divergence As quickly evoked previously (‘3.The maintenance of diversity in Amazonia’), population evolution is driven by a combination of neutral (mutation, recombination, genetic drift, migration, reproduction, demography) and adaptive (natural selection) processes. Populations may diverge into new species, either due to isolation-by-distance that may be caused by populations isolation into refuges or biogeographic barriers (allopatric speciation), or by local adaptation to habitat heterogeneity (sympatric speciation). However, the drivers of populations evolution and speciation processes in tropical rainforest trees are poorly known, partly because the boundaries of species are often confused, and many species are organized in species complexes, with incomplete reproductive isolation between species and cryptic species (Cavers & Dick 2013).
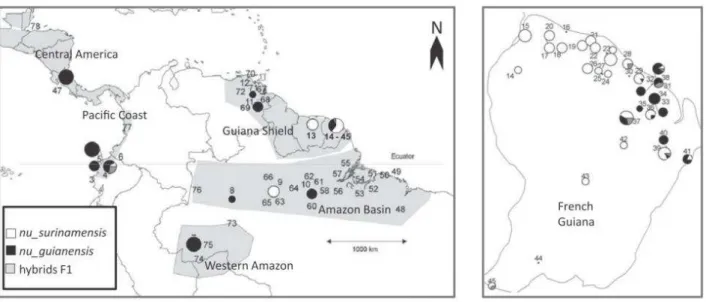
At regional scale, many phylogeographic analyses revealed patterns of genetic divergence structured by the biogeographic history of the species, and mainly dispersal constraints that occurred during tertiary and quaternary. For example, Jacaranda copaia is widespread in the Amazon basin and comprises two sub-species: one subspecies widespread from Central America to Bolivia and another one distributed in the Guiana shield. In a recent study, Scotti-Saintagne et al. (2012) showed that the geographical patterns of genetic diversity in these two Jacaranda copaia sub-species were largely shaped by Pleistocene climatic changes that isolated ancestral species into refuges, with a center of diversification in Central Amazonia probably due to a secondary contact zone. Moreover, the absence of cross-Andean disjunction suggested that the Andean uplift was not a barrier to dispersal, probably because Jacaranda copaia is a wind-dispersed pioneer species, favored by canopy gaps and disturbances, and able to tolerate relatively dry conditions. Another example is
30
provided by the Carapa species complex (Duminil et al. 2006, Scotti-Saintagne et al. 2012). Scotti-Saintagne et al. suggested that the biogeographic history of two Carapa species was a combination of tertiary and quaternary events, including Pliocene Andean uplifts, and then late Miocene development of Amazon drainage, but was also influenced by hybridization and introgressions during the Quaternary, figure 28.
In an original study (Fine & Kembel 2010), Fine et al. evoked the large influence of specialization to habitat type in driving the phylogenetic divergence between species. They analyzed the phylogenetic structure of Amazonian communities involving 1972 taxa across habitat types in Peru (white-sands that were widespread before Andean uplift and terra-firme forests composed by Cretaceous sediments that were laid down during Miocene). They compared the relative effects of habitat type and geographic distances between communities on the phylogenetic distances between taxa. They concluded that both dispersal limitation and habitat specialization influenced species divergence in tropical forests,
Figure 28: Bayesian clustering analysis for the tree Genus Carapa in the Neotropics (from Scotti-Saintagne et al. 2012). Maps indicate the structuring of genetic diversity at continental and regional scales.
Figure 29: Phylogenetic tree linking 1972 taxa in Amazonia. Thick lineages indicate lineages containing more descendant taxa associated to terra-firme (green) and wite-sand (blue) habitats than expected by chance.
31
but the effect of habitat specialization was greater than distance between communities, figure 29. They remained, however, cautious about the age of divergence: both biogeographic history of habitat types and recent in situ adaptive radiations governed by habitat heterogeneity would be involved in clade divergence.
Taken together, these results reveal that the biogeographic history of species is often insufficient to catch all the processes that structured the genetic diversity and induced speciation in Amazonian landscapes. In particular, more recent specialization to constraints would also be involved in species evolution and divergence, particularly at local scale.
At local scale, several studies revealed strong evidence of habitat specialization among closely related species. Baraloto et al. analyzed the distribution of four pairs of species from the same genus and observed divergent local habitat-associations between closely-related species (Baraloto et al. 2007). They proposed that specialization to local habitat may explain patterns of adaptive radiation in many tree genera. Similarly, Tuomisto et al. (Tuomisto 2006) observed strong evidence of niche specialization to local edaphic constraints (soil texture, soil cation content, inundation) between species of the Polybotrya genus in northwestern Amazonia.
Even if numerous studies evoked the influence of local variations in shaping the genetic diversity of tropical plants and in driving sympatric speciation, no study yet provided molecular evidences of local adaptation at intra-specific level in Amazonia. In temperate and boreal plant communities, local adaptation has been largely investigated and provides a wide range of examples: local adaptation to altitudinal gradients (Savolainen 2011), to water-logging (Parelle et al. 2010) etc… (see section ‘Molecular evolution’). In tropical rainforests, however, the relative influence of local adaptation and neutral processes in structuring the genetic diversity over short spatial scales remains largely misunderstood and requires much attention, particularly in the current context of climate change.
32
5. Tree species model, research questions and study sites
In this study, I address the question of population evolution at local scale within continuous populations of a dominant tree species widespread in French Guiana: Eperua falcata (a complete description of the species is given page 35). I addressed two main questions:
1) How is the genetic diversity of Eperua falcata structured in the forest landscapes of French Guiana?
2) Which evolutionary drivers are relevant to explain the structure of genetic diversity at local scale?
3) Does local adaptation contribute to structure the genetic diversity at local scale within continuous populations?
I analyzed the patterns of genetic diversity distribution within continuous forest landscapes of French Guiana through a global approach integrating both ecophysiological (phenotypic) and population genetics (molecular) approaches that are treated separately.
Figure 30 (page 34) provides a complete overview of the methods, the specific questions and future prospects.
Molecular evolution:
The section ‘Molecular evolution’ aims at (i) analyzing patterns of genetic differentiation among local habitats, (ii) identifying which evolutionary drivers structure the local genetic diversity of Eperua falcata, and (iii) testing for local adaptation by (iiia) detecting outlier loci under diversifying selection among local habitats and (iiib) estimating the extent of (divergent) natural selection in the genome of Eperua falcata. This section involves two main approaches:
- a candidate gene approach in which targeted genes of known function (potentially involved in adaptive genetic differentiation among local habitats) were sequenced: aquaporins, catalase, farnesyltransferase, etc…
- a genome-scan approach in which I genotyped a large number of (anonymous) AFLP markers spread over the genome.
The candidate gene approach was developed during the PhD of Delphine Audigeos. I participate to this work during my Master degree by developing genetic markers and by contributing to genetic analyses. The AFLPs approach was set-up during this PhD.
33
In parallel to population genetics, I worked on creating a large database of Eperua falcata expressed sequences (cDNA) that were sequenced by 454-pyrosequencing prior to this PhD. I realized the bioinformatics assembly and post-processed it to characterize genes and identify polymorphism. Such a database will be useful for further high-throughput re-sequencing or genotyping of candidate loci.
The different results obtained are detailed in the research articles, but the main results are summarized into this synthesis (‘orange boxes’). The prospects of the study are discussed in the section ‘Discussion’.
Phenotypic evolution:
In the section ‘Phenotypic evolution’, I analyzed (i) whether functional traits are (inherently) structured by local habitats, and (ii) whether habitat patchiness may have shaped tree sensitivity to environmental constraints (with a particular focus here on water stresses, including drought and water-logging). This section involves three experiments:
1- a provenance test under controlled and non-limiting conditions (‘common garden’), 2- a provenance test under constraining conditions in which different water treatments
were applied (drought and water-logging),
3- a reciprocal transplant experiment in natural conditions.
The two first experiments were designed, and their realization supervised by D. Bonal & I. Scotti from 2006 to 2008. The reciprocal transplant experiment was set up in 2011 at the beginning of this PhD. I designed and set up this third experiment (seed sampling, sowing, and seedlings transplant), and followed seedling growth from 2011 to 2013.
34
35
Eperua falcata (Aublet.)
Taxonomy: Fam. Fabaceae, Subfam.
Caesalpinioideae
Diversity:
The genus Eperua comprises about fifteen tree species in the Amazonia, but only three are present in French Guiana: E. falcata, E. grandiflora, and E. rubiginosa. Eperua
falcata is the most common species of French Guiana
Continental distribution:
E. falcata is widespread in the
Guiana shield. Its native distribution covers the whole Guiana shield (French Guiana, Suriname, Guyana) plus the North of Brazil and Venezuela.
Local distribution and spatial dynamics:
E. falcata is a generalist tree species able to colonize both
water-logged and terra-firme habitats. However, it is more abundant in water-logged bottomland (Baraloto et al. 2006), while E. grandiflora is restricted to hilltops (Barthes 1991). The third species (E. rubiginosa) is mainly encountered along rivers, but it has already been observed on well-drained ferralitic soils. E. falcata has an aggregative behavior (Bariteau 1992), and often exhibits high population densities.
Successional status and physiology:
E. falcata is an evergreen canopy-dominant tree species which
often emerges above the canopy. It is a ‘fast-growing late successional species’ (Bonal et al. 2007): it displays lower carbon assimilation rates, leaf nitrogen and SLA than early-successional species, but higher SLA and leaf nitrogen than slow-growing late-successional species. As it emerges above the canopy, it is considered as a shade hemitolerant species, a group displaying higher water use efficiency than heliophilic or shade tolerant species that is considered as an adaptive trait to high evaporative demand prevailing in the emerging tree crowns. Because emergent trees are commonly not shaded by other trees and because E. falcata reaches large circumferences, it displays high sapflow densities (Granier et al. 1996). It is well tolerant to drought: assimilation balance of adult trees remains positive under moderate to severe drought (Bonal & Guehl 2001) and leaf physiology is not affected by seasonal soil drought (Bonal et al. 2000). It displays an anisohydric behavior in relation to soil drought: trees are deep rooted (with tap roots below 3 m, Bonal et al. 2000) and the stomatal conductance of seedlings diaplay a limited sensitivity to drought (Bonal & Guehl 2001).
Phenology and Reproduction:
E. falcata flowers and fruits during athe the end of the dry
season (September to March), Cowan 1975. It is probably both self-compatible and outcrossing, even if differential ripening of the anthers and stigmas would limit selfing. Large pollen grains (size > 100µm) are probably not dispersed by wind. Recurrent observations of bats visiting flowers suggest that the species is chiropterophilous (bat-mediated pollination). E. falcata is autochorous: heavy seeds are dispersed at short distance around mother trees by explosive pod dehiscence. Autochorous seed dissemination results in very restricted seed dispersal (Hardy et al. 2006), thus explaining its aggregative distribution (Bariteau 1992).
Research advantages:
-Widespread in French Guiana, high population densities
-Easy to identify thanks to its characteristic even-pinnate sickle-shaped leaflets. - Conciliatory with both genetic analysis and shade-house experiments.
36 Study sites:
Four study sites were used along the different approaches and experiments, figure 31. Three were located on the coast of French Guiana (Laussat, Paracou and Regina), whereas the site of Nourragues was the most continental. The study sites display large differences in water-regime, with and annual mean precipitations ranging from 2500 (Laussat) to 4000 (Regina) mm/year. Site Location p° (mm/year) Area (ha) Eperua falcata population density Coexistence with other Eperua species
Laussat Coastal (W) 2500 4.3 48.1 No
Paraou Coastal (center) 2700 6.25 42.7 E. grandiflora
Regina Coastal (East) 4000 6.7 29.9 E. rubiginosa
Nourragues Continental (E) 3000 1 NA NA
The different plots cover different habitat types, from bottomland to terra-firme, but display several topographic differences. Laussat and Nourragues experimental plots are composed by a permanently water-logged bottomland and a large plateau of low elevation and low slope (at Laussat, elevation ranges between 20 and 60 meters). Paracou is composed of a seasonally water-logged bottomland surrounded by two hilltops and separated by moderate slopes. At Regina, topography is more complex, leading to a habitat patchiness
37
composed by smaller patches more finely juxtaposed. Regina is composed by high and thin hilltops bordered by important slopes, with elevations ranging from 40 to 100 meters. A complex hydrological network carries water toward a seasonally water-logged bottomland submitted to frequent flooding events during the rainy season. In spite of these differences, the soil properties of local habitats are quite similar between sites: all bottomlands are characterized by hydromorphic soils with a large accumulation of organic matter whereas terra-firme are characterized by ferralitic soils undergoing important drainage due to their sandy texture, probably leading to soil water deficits the dry season.
38
PART 1 - Molecular evolution: population genetics and genomics
1. Population evolution
Evolution starts with the existence of genetic polymorphisms in the genome of organisms due to mutations: substitution (“single nucleotide polymorphism” or SNPs), insertions-deletions, copy number variation (“simple sequence repeat” or SSR). Mutations occurred randomly during meiosis and are transmitted to the progeny by Mendelian inheritance. Moreover, crossing over contributes to break linkage disequilibrium between two physically linked loci, and creates new combinations of alleles (genotypes) considering the two loci simultaneously.
In a population of infinite, and thus constant, size (i.e. no genetic drift, no demographic changes), if reproduction is panmictic among individuals (i.e. mating is random) and if there is no selection, the population is at the Hardy-Weinberg equilibrium: allelic and genotypic frequencies remain stable across generations. For a bi-allelic locus, homozygotes (A/A), (a/a) and heterozygotes (A/a) occur in proportion p², q², and 2pq respectively; where p and q correspond to allelic frequencies for the alleles (A) and (a), figure 32. The expected heterozygosity under Hardy-Weinberg equilibrium is thus equal to 2pq or 1-(p²+q²). This index is called Nei’s diversity index and may be extended to multi-allelic loci, given:-ℎ = −
∑ � ².
On the contrary, the future of mutations in populations may vary across generations, driven by evolutionary drivers: genetic drift, gene flow, and natural selection. I also include mating system as well as the demographic history of populations as drivers of evolution.
Mating (selfing and inbreeding)
Figure 32: Genotypic frequencies as a function of allelic frequencies in a population at the equilibrium. “p” and “q”
refer to allelic frequencies for the alleles (A) and (a) respectively, where q=1-p.
39
Mating between organisms within populations is an important point to understand population evolution, particularly in plants in which selfing is common and because plants are immobile and thus more
susceptible to be affected by consanguinity. Mating affects genotypic frequencies, by decreasing heterozygosis (i.e. the proportion of heterozygotes in the population), without affecting allelic frequencies. Selfing drastically affect genetic diversity, by decreasing the frequency of heterozygotes across generations. In a population where all individuals are 100% selfing, heterozygosis decreases in proportion 1/2 each generation, figure 33.
Inbreeding also affects heterozygosis, depending on the inbreeding coefficient (Fis). One definition of the inbreeding coefficient is the difference between the expected (under Hardy Weinberg equilibrium) and the
observed heterozygosis divided by the expected heterozygosis:: � =
− ⁄ (Hartl & Clark 2007). A positive Fis indicates a deficit in heterozygotes due to inbreeding, whereas a negative value indicates an excess of heterozygotes. In populations, inbreeding affect genotypic frequencies, given f(A/A)=p²+pq*Fis, f(A/a)=2pq-2pq*Fis and f(a/a)=q²+pq*Fis, figure 34.
Figure 33: Variations in genotypic frequencies across generations in a theoretical 100% selfing population of constant
population size (each organism produces one descendant each generation).
Figure 34: Genotypic frequencies as a function of allelic frequency under the HW equilibrium (Fis=0) and in populations submitted to inbreeding (Fis=0.1 and Fis=0.25).
40 BOX 1 – THEORY
Apprehending genetic diversity from AFLP markers
“Amplified fragment length polymorphism” (AFLPs) is a powerful method to detect polymorphisms in populations, by allowing the analysis of numerous markers spread in the genome very quickly with a limited cost. The technique consists in digesting the genome with one or several enzymes (frequently two enzymes) and by amplifying digested fragments by PCR. The amplification of a fragment produces a band by genotyping, whereas the absence of band traduces a polymorphism that prevents enzyme clipping at this site (Vos et al. 1995). Thus, AFLPs are poorly informative dominant markers: even if the absence of a band necessary traduces a homozygote (0/0), the presence of a band confounds homozygotes (1/1) and heterozygotes (1/0). Thus, estimating allelic and genotypic frequencies in populations from AFLPs requires either the assumption that the population is at equilibrium, or a prior knowledge about the inbreeding coefficient (Fis) in populations estimated from other kinds of molecular markers (such as SNPs).
For each marker j, the frequency of homozygotes (0/0) is estimated by:
= ² + ∗ �
where p and q expresse the frequency of the allele (1) and (0) respectively, with p=1-q, leading to:
= − � ∗ + � ∗ ↔ − � ∗ + ( � ∗ ) − =
Thus, =−� +√∆
∗ −� with ∆ = � ² − [4 ∗ − � ∗ (− )]
� = ∗ � ∗ − ∗ � where Nj corresponds to the number of phenotypes available for this
marker (with removal of missing values).
This method was applied for estimating genotypic frequencies from the AFLP dataset obtained during this PhD (Article n°2). A mean Fis was estimated from genes sequenced during the candidate gene approach (Article n°1).
In the species-rich tropical rainforest, numerous tree species are monoecious and occur at low population densities. This observation originally led botanists to predict that tree species should be highly self-fertilizing and inbred. However, recent investigations revealed that dioecy is consistently more frequent in tropical than in temperate trees (>20% of tropical tree species, Ward et al. 2005, Dick et al. 2008), while estimates of outcrossing revealed that tropical tree species are mainly outcrossing (Ward et al. 2005), figure 35. High outcrossing rates, even in hermaphrodic species, may be a result of incompatibility mechanisms preventing selfing, and inbreeding depression (i.e. the fitness of selfed seedling is lower than the fitness of outbred seedlings, see the following paragraph on ‘natural selection’). However, mixed mating remains frequent in several species. Outcrossing depends on the balance between pollen dispersal (see paragraph on ‘gene flow’) and distance
41
between crowns. Thus, selfing is favored in populations of very low density, whereas outcrossing is favored by high population density. However, in species with an aggregative distribution -as it is the case in Eperua falcata- mating would occur principally among neighbors, leading to local inbreeding between trees (Dick et al. 2003).
Genetic drift
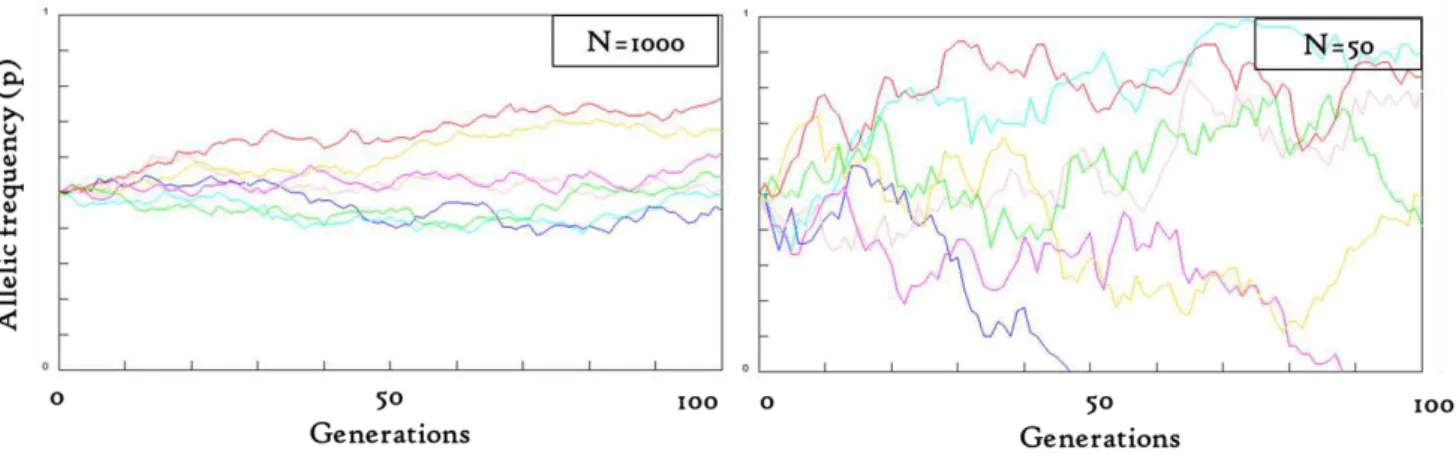
In a finite population, the random sampling of gametes causes variations in allelic frequencies across generations. Genetic drift may be modeled by the Wright-Fisher model in which each generation is constructed by random sampling from a pool of gametes. Alleles frequencies vary randomly across generations, leading either to allele fixation (p=1) or to allele loss (p=0). In small populations, allelic frequencies show strong variations across generations, and allelic fixation or loss occurs more quickly than in large populations, figure 36. In general, trees are characterized by high fecundity (by comparison with animals) leading to large population sizes (Petit & Hampe 2006). Thus, genetic drift is supposed to be low in continuous tree populations. However, low population densities encountered in numerous tropical trees, as well as frequent asynchronism of flowering among trees of a given species, may reinforce genetic drift (Ward et al. 2005, Dick et al. 2008).
Figure 35: Estimated outcrossing rates (tm) in several tropical tree species (From Ward et al. 2005, Hardy et al. 2006, Dick et
42 Gene flow
Gene flow refers to the movements of genes within or between populations. In plants, gene flow occurs through movements of haploid gametes (pollen flow), and diploid zygotes (seed dispersal). Moreover, gene flow is not only a function of dispersal, but also the success of migrants in different habitats (i.e. natural selection directly impacts the ‘realized’ gene flow). Gene flow is commonly estimated through paternity and maternity tests or indirectly inferred from the analysis of the fine-scale genetic structure of populations (see section ‘Neural genetic differentiation’). Trees display high levels of gene flow in both temperate and tropical ecosystems (Petit et al. 2006, Savolainen et al. 2007), and pollen flow is globally higher than seed dispersal in the latter (Dick et al. 2008), figure 37.
Pollen flow is high in tropical tree species, even in animal-pollinated species, and ranges from 200m to 19km (Ward et al. 2005). Indeed, tropical tree species are mainly
Figure 37: Estimates of pollen flow and seed dispersal in several temperate and tropical tree species (realized from Ward et al. 2005, Hardy et al.2006, Petit & Hampe 2006, Dick et al. 2008, and references within). Figure 36: Allelic frequencies (p) for 7 loci under the Wright-Fisher model simulated using the simulation engine
43 animal-pollinated (70% of the species), because high air humidity and frequent precipitations prevent wind-pollination. One of the rare examples of wind-pollination is provided by the pioneer species from the genus Cecropia, able to disperse pollen to several kilometers (6-14 km in C. obtusifolia, Kaufman et al. 1998), figure 38. Other examples of long-distance pollen flow are provided by the bat-pollinated
Ceiba pentandra, able to disperse pollen up to 18 km, and the wasp-pollinated species from the Ficus genus able to spread pollen from 6 to 15 km (Nason et al. 1998). However, long-distance pollen flow is not the norm for all tree species, and the extent of gene flow may be modulated by population density and species behavior as evoked in the ‘mating’ paragraph. Moreover, habitat fragmentation may increase pollen flow, suggesting that tropical tree species would be more adaptable to forest fragmentation than expected. In Swietenia humilis, White et al. (White et al. 2002) reported that pollen flow was 10 times larger in fragmented habitats than previous results in undisturbed populations. In the same way, Dick et al. (Dick et al. 2003) found strong differences in pollen dispersal between undisturbed (mean = 212 m) and fragmented habitats (mean = 1509 m) in the African tropical tree Dizinia excelsia.
Contrary to pollen flow, seed dispersal occurs principally at local scale in tropical rainforests and is commonly below 100 m, with a maximum at ~400 m in Simarouba amara (Hardesty et al. 2006). Hardy et al. (Hardy et al. 2006) found a relation between seed dispersers and total gene flow (including both pollen and seed dispersal): tree species dispersed by monkeys or birds have more effective gene flow than trees dispersed by gravity
(as it is the case for Eperua falcata and E. grandiflora), wind or rodents. They also suggested that limited seed dispersal would indirectly affect pollen dispersal by increasing local population densities. Moreover, rare events of extreme long-distance dispersal have already been reported and, even if rare, such extreme dispersal may be involved in the colonization of new areas. For example, a cross-Atlantic dispersal event would have allowed the
Figure 38: Cecrobia obtusifolia (Urticaceae)
Figure 39: Ceiba pentandra (Malvaceae) called ‘fromager’ (literally ‘the cheese maker’) due
44
colonization of Africa from the neotropics by Ceiba pentandra (Dick et al. 2007), figure 39.
Natural selection
Natural selection acts on genetic diversity through fitness-related phenotypic traits. Contrary to genome-wide neutral processes, natural selection acts on targeted genes involved in fitness-related traits, and affects the frequency of alleles in a population across generations. Fitness may be defined as the property for a genotype to survive and produce a fertile progeny. Mathematically, fitness is the ratio between the number of descendant produced by a given genotype and that produced by the genotype with the greater fitness. For a bi-allelic locus, fitness is called WAA, WAa and Waa for the genotypes (AA), (Aa), and
(aa). Genotypic frequencies at the following generation is thus (Hamilton 2009):
+ = �+�̅×� �
where �̅ traduces the marginal fitness or the frequency-weighted relative fitness of
genotypes: �̅ = × � + × � + × �
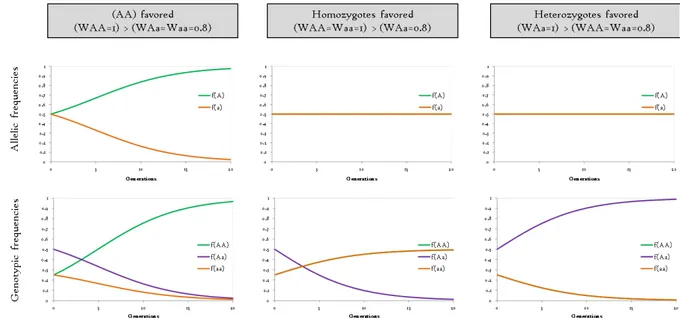
Thus, the future for an allele under selection may be easily guessed. Variations in the frequencies of the allele (A) depend on the fitness of the different genotypes, figure 40. The frequency of the allele (A) increases after selection if homozygotes (AA) are favored but decreases if homozygotes (aa) are favored, figure 41. When heterozygotes have the greatest or the lowest fitness, variations of allelic frequencies must be either positive or negative, depending on allelic frequency before selection. If homozygotes have equal fitness, selection will lead to equilibrating allelic frequencies around 0.5 (if no drift). However, natural selection may also impact neutral loci (leading any advantage or disadvantage to the different genotypes) because of a physical linkage between them (‘Hitchiking’).
Figure 40: Variation in the frequency of the allele (A) after selection (‘Delta p’) as a function of the frequency of the allele (A) before selection (‘p’) and the relative fitness of the genotypes.
45
Three kinds of natural selection may be distinguished. Positive selection favors an advantageous allele that will increase in frequency across generations until fixation, figure 42. Under selection, allele fixation is expected to occur quickly than with drift only. Negative (or purifying) selection eliminates deleterious mutations until their complete disappearance. Both positive and negative selection leads to an excess of rare alleles at a polymorphic locus by comparison with neutral expectations. Balancing selection favors several alleles of equal contributions, leading to an excess of alleles in intermediate frequencies than expected under neutrality. The figure 42 shows a conceptual allele frequency spectrum at a single locus that represents the patterns of allelic frequencies at a locus submitted to natural selection by comparison with the expected pattern under neutrality of this locus.
Figure 42: Conceptual allele frequency spectrum at a multi-allelic locus under neutrality and under selection. Figure 41: Variations of allelic and phenotypic frequencies across generations under selection (without genetic drift)