https://doi.org/10.4224/40000417
Questions? Contact the NRC Publications Archive team at
PublicationsArchive-ArchivesPublications@nrc-cnrc.gc.ca. If you wish to email the authors directly, please see the first page of the publication for their contact information.
https://publications-cnrc.canada.ca/fra/droits
L’accès à ce site Web et l’utilisation de son contenu sont assujettis aux conditions présentées dans le site
LISEZ CES CONDITIONS ATTENTIVEMENT AVANT D’UTILISER CE SITE WEB.
READ THESE TERMS AND CONDITIONS CAREFULLY BEFORE USING THIS WEBSITE. https://nrc-publications.canada.ca/eng/copyright
NRC Publications Archive Record / Notice des Archives des publications du CNRC : https://nrc-publications.canada.ca/eng/view/object/?id=9e3b39be-e0ed-415b-9649-3e7ec228f52c https://publications-cnrc.canada.ca/fra/voir/objet/?id=9e3b39be-e0ed-415b-9649-3e7ec228f52c
Archives des publications du CNRC
For the publisher’s version, please access the DOI link below./ Pour consulter la version de l’éditeur, utilisez le lien DOI ci-dessous.
Access and use of this website and the material on it are subject to the Terms and Conditions set forth at
Addendum to RR-335: sound transmission through Nail-Laminated
Timber (NLT) assemblies
Chapter 1: Sound Transmission via Many Paths
Addendum to RR-335:
Sound Transmission through
Nail-Laminated Timber (NLT)
Assemblies
Jeffrey Mahn, David Quirt, Christoph Hoeller,
Markus Mueller-Trapet
March 2018
Scope
This report is published as an addendum to NRC Research Report RR-335 “Apparent Sound Insulation in Cross-Laminated Timber Buildings." It is intended that this addendum will be merged with RR-335 in the future as a report for predicting the sound insulation in buildings using mass-timber constructions including NLT assemblies.
This report presents the results from experimental studies of airborne sound transmission through assemblies of nail-laminated timber (NLT) with various linings. To put the data presented in this report in the proper context, this report begins with a brief explanation of calculation procedures to predict the apparent sound transmission class (ASTC) between adjacent spaces in a building whose structure is a combination of mass-timber assemblies such as nail-laminated timber (NLT) or cross-laminated timber (CLT) panels.
Acknowledgments
The research studies on which this Report is based were supported by Natural Resources Canada. Their financial support is gratefully acknowledged.
Disclaimer
Although it is not repeated at every step of this Report, it should be understood that some variation in sound insulation is to be expected in practice due to changes in the specific design details, poor workmanship, substitution of “generic equivalents”, or simply rebuilding the construction. It would be prudent to allow a margin of error of several STC or ASTC points to ensure that a design will satisfy a specific requirement.
Despite this caveat, the authors believe that methods and results shown here do provide a good estimate of the direct airborne sound transmission for the mass-timber assemblies for the types of constructions presented.
Contents
1 Introduction ...1
1.1 Sound Transmission via Many Paths ... 2
1.2 Predicting Sound Transmission in a Building ... 4
2 Sound Transmission through NLT Wall and Floor Assemblies ...6
2.1 NLT Walls and Floors without Linings ... 8
2.2 Adding Linings on NLT Wall or Floor Assemblies ... 15
2.3 Structural Loss Factors for NLT Wall or Floor Assemblies... 27
3 Appendices of Sound Transmission Data ... 29
3.1 Appendix A1: Transmission Loss Data for NLT Wall and Floor Assemblies ... 30
3.2 Appendix A2: Calculating ΔSTC for Linings on NLT Assemblies ... 40
Executive Summary
Following the procedures explained in the NRC's Research Reports RR-331 and RR-335, the calculation of the ASTC rating of mass-timber constructions requires as inputs three sets of standard test data. This Addendum to the Research Report RR-335 provides two sets of the required data for nail-laminated timber (NLT) constructions: the airborne sound transmission through five thicknesses of base NLT assemblies and the change in the airborne sound transmission though these assemblies when a lining such as a gypsum board on wood furring strips is added to the basic NLT assembly.
The specimen descriptions and test data are located in this report as follows: • The NLT assemblies are described at the beginning of Section 2.1
• STC values and one-third octave band sound transmission test data are listed in Appendix A1.1 • Trends in those data are discussed in Sections 2.1 and 2.2.
• Key single number STC and ∆STC ratings determined from the tests are given in Table A1.2 and Table A1.3 of Appendix A1.
Key findings from this report include:
• The transmission loss of the NLT assemblies with a shear membrane which were evaluated are too low to be used in multi-tenancy, residential constructions without the addition of linings or toppings.
Nominal Timber
Dimensions Description
STC Rating 2x4 NLT89 with Plywood Shear Membrane 29 2x6 NLT140 with Plywood Shear Membrane 31 2x8 NLT184 with Plywood Shear Membrane 31 2x10 NLT235 with Plywood Shear Membrane 36 2x12 NLT286 with Plywood Shear Membrane 41
• For each thickness of NLT, the transmission loss of the NLT with a shear membrane of oriented strandboard (OSB) was also tested. In every case the substitution of OSB for plywood improved the transmission loss of the assembly at most frequencies, typically providing an increase of 1 STC point. Based on this finding, it is concluded that the STC ratings for assemblies with plywood provide a reliable conservative estimate for equivalent assemblies with OSB substituted for the plywood.
• Data presented in RR-335 for linings installed on CLT assemblies may be used in most cases as a conservative estimate of the use of the same linings used on NLT assemblies.
• For the NLT assemblies evaluated as part of this study, it was established that the loss factors were high enough to justify ignoring corrections for edge losses in the detailed calculations in accordance with ISO 15712-1, which greatly simplifies those calculations.
Chapter 1: Introduction
1 Introduction
The 2015 edition of the National Building Code of Canada (NBCC) includes changes to the acoustic requirements for residential constructions. Earlier editions of the NBCC described the acoustic requirements in terms of the sound transmission class (STC) rating of the assemblies that separate dwellings in a building. In the 2015 edition, the requirements based on a STC rating were replaced with new requirements based on the apparent sound transmission class (ASTC) rating.
One method of demonstrating compliance with the acoustic requirements of the NBCC is to predict the ASTC rating through calculations based on laboratory measured data. This prediction method is outlined in the NRC Research Report RR-331 "Guide to Calculating Airborne Sound Transmission in Buildings" [14]. The laboratory measured data includes the transmission loss of the walls and floors of the construction being considered.
This Addendum to Research Report RR-335 presents the results from experimental measurements of the airborne sound transmission through assemblies of nail-laminated timber (NLT)1 with various linings that are required for the calculation of the ASTC rating of constructions that include NLT assemblies.
1.1 Sound Transmission via Many Paths
The simplest approach to controlling sound transmission between adjacent rooms in buildings considers only the sound transmission through the separating wall or floor. This approach has been entrenched in North American building codes which for many decades have considered only the single number ratings for the common assembly between dwellings. The single-number ratings used by this approach is the sound transmission class (STC) rating for airborne sources and impact insulation class (IIC) rating for footstep noise. Implicit in this approach is the simplistic assumption that sound is only transmitted through the obvious separating assembly between dwellings – the separating wall assembly when the rooms are side-by-side (illustrated in Figure 1.1.1) or the floor/ceiling assembly when rooms are one-above-the-other. Under this approach, inadequate sound insulation is often incorrectly attributed to errors in either the design of the separating assembly or the workmanship of those who built it and remediation focusses on that assembly. Unfortunately, this mindset is still common among designers and builders in North America.
Figure 1.1.1: A cross-section through a building with
two side-by-side rooms. This figure shows the historic perspective that only the direct sound transmission through the separating assembly needs to be considered. Part of the sound from an
airborne source in one unit (represented by red loudspeaker in the drawings, which could include anything from a home theatre to people talking loudly) is transmitted to the adjacent unit.
Figure 1.1.2: In reality, there are many paths for
sound transmission between adjacent rooms, including both direct transmission through the separating assembly and indirect flanking paths, through the connected building elements, a few of which are shown here. The structure-borne paths usually significantly affect the overall sound transmission. See Section 1.4 for more detail.
In reality, the technical issue is more complex, as illustrated in Figure 1.1.2. There is the direct transmission of sound through the separating assembly, but that is only one of the ways that sound is transmitted between the adjacent rooms. As shown in the figure, the airborne sound source excites the surfaces in the source space and these surfaces vibrate in response. Some of this vibrational energy is transmitted as structure-borne sound through the junctions where these surfaces join the separating assembly and into surfaces of the adjoining space. The surfaces in the receiving room then radiate part of the vibrational energy as airborne sound. The sound transmission by these paths is called flanking
Transmission through wall Airborne Sound Source Separating assembly Transmission through wall Airborne Sound Source Separating assembly Flanking Transmission via ceiling surfaces Transmission through wall Airborne Sound Source Flanking Transmission via floor surfaces Flanking Transmission
via ceiling surfaces Transmission through wall Airborne Sound Source Flanking Transmission via floor surfaces
Chapter 1: Introduction
Occupants of the adjacent room hear the combination of sound due to direct transmission through the separating assembly plus sound due to structure-borne flanking transmission involving all the other elements coupled to the separating assembly. Furthermore, there is also transmission of sound through leaks (openings) in the walls. It follows that in reality, the sound insulation between adjacent rooms is always worse than the sound insulation provided by just the separating assembly. The importance of including all of the transmission paths has long been recognized in principle and the fundamental science was largely explaineddecades ago, by Cremer et al [8]. Although the measurement of the ASTC rating in a building according to ASTM E336 is quite straightforward, predicting the ASTC rating of a building is more complex. The challenge has been to reduce the complicated calculation of the sound transmission by multiple paths into manageable engineering that yields trustworthy quantitative estimates and to standardize that process to facilitate its inclusion in a regulatory framework.
For design or regulation, there is a standardized frameworks for calculating the overall sound transmission have been developed and have been in use to support performance-based European code systems. For example, ratings described in ISO standards such as the weighted apparent sound reduction index (R’w) have been used in many countries for decades. The weighted apparent sound reduction index has a corresponding rating called the apparent sound transmission class (ASTC) rating as described in the standard, ASTM E336 [2]. The ASTC rating is used in the 2015 edition of the National Building Code of Canada and explained in detail in the NRC Report RR-331.
1.2 Predicting Sound Transmission in a Building
In 2005, ISO published the standard, ISO 15712-1, “Building acoustics — Estimation of acoustic performance of buildings from the performance of elements — Part 1: Airborne sound insulation between rooms” [7]. This standard describes a method of calculating the sound transmitted via many paths and is one part of a series of standards on the subject. Part 2 of ISO 15712 deals with “impact sound insulation between rooms”, Part 3 deals with “airborne sound insulation against outdoor sound”, and Part 4 deals with “transmission of indoor sound to the outside”. The procedures of ISO 15712-1 were specified in the 2015 edition of the National Building Code of Canada (NBCC) as appropriate methods for calculating the ASTC rating to establish that the sound control provisions of a proposed building design will conform to the acoustic requirements of the Building Code.
However, there were two significant impediments to applying the methods of ISO 15712-1 within a North American context:
• ISO 15712-1 provides reliable estimates for massive types of construction, including cross-laminated timber (CLT) constructions, but not for the lightweight framed construction widely used for buildings in North America.
• There are many differences between the ISO standards for building acoustics [5] and the ASTM standards [1] used by the construction industry in North America both in terms of terminology and in terms of the technical requirements for measurements and the calculations of ratings.
The 2015 edition of the National Building Code of Canada deals with these issues by specifying suitable procedures and test data to calculate the ASTC rating for different types of constructions. These procedures are explained with many worked examples in the NRC Research Report RR-331, “Guide to Calculating Airborne Sound Transmission in Buildings”. Report RR-331 outlines a strategy for merging ASTM and ISO test data and procedures and provides recommendations and example calculations for adapting the calculation procedures for different building constructions.
The Report RR-331 was developed as part of a project established by the National Research Council of Canada along with industry partners including the Canadian Wood Council with the goal of supporting the transition of construction industry practices to adopt the ASTC rating rather than the STC rating for the sound control objectives in the National Building Code of Canada (NBCC). However, the potential range of applications for RR-331 goes beyond the minimum requirements of the NBCC. The Report also facilitates building designs to provide enhanced levels of sound insulation and should be generally applicable to construction with mass-timber assemblies both in Canada and in the USA.
For buildings constructed from NLT wall and floor assemblies, the Detailed Method and the Simplified Method of ISO 15712-1 provide predictions of the ASTC rating which are suitable to meet the requirements of the NBCC. Research Report RR-335 [15.3] gives a detailed description of the steps of the standardized calculation procedure for buildings with a structure of CLT assemblies, and it is anticipated that those same procedures will apply with some extensions to other types of mass-timber
Chapter 1: Introduction
For mass-timber constructions, there are three sets of standard test data which are required as inputs for the ASTC calculations following the procedures of ISO 15712-1:
1. The airborne transmission loss through the basic mass-timber assemblies measured according to ASTM E90. A requirement for the test data to be properly applied to the calculation of the flanking sound transmission is that there must be negligible air leakage through the specimens evaluated.
2. Data measured according to ASTM E90 to determine the change in transmission of airborne sound though the assemblies when a lining such as a floor surface or a gypsum board wall or ceiling finish mounted on lightweight wood or steel framing is added to the basic mass-timber element.
3. The vibration reduction index measured according to ISO 10848 [6] to determine the transmission of structure-borne vibration though the junctions where mass-timber wall and floor assemblies are connected.
In addition, pertinent physical properties of the assemblies such as their mass per unit area and structural loss factors are required.
This Addendum to Research Report RR-335:
• includes two of the three sets of standard test data described above
• details only part of the data needed to calculate the ASTC rating for adjacent units in a
building. Measurement of the transmission of structure-borne noise through junctions
between connected NLT assemblies in a subsequent project will provide the missing
data for the calculation of the ASTC rating.
2 Sound Transmission through NLT Wall and Floor Assemblies
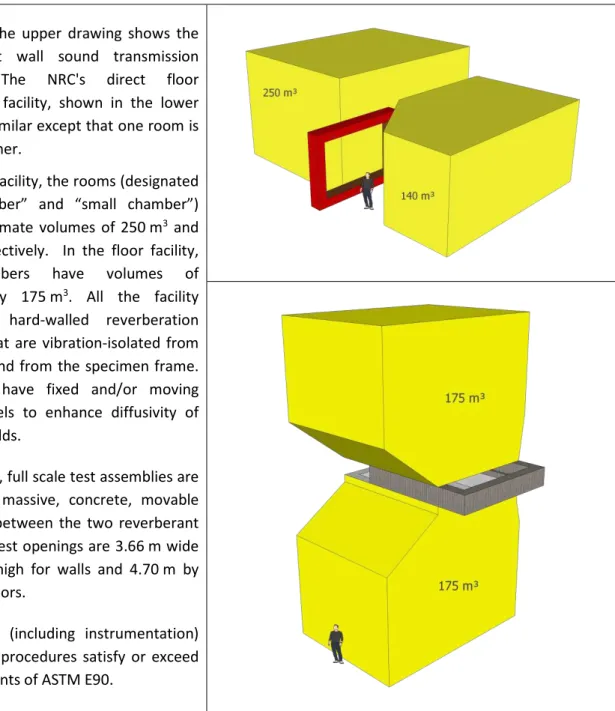
The direct sound transmission loss of wall and floor assemblies were measured in the NRC’s wall and floor direct sound transmission facilities according to ASTM E90 [1]. Concept drawings of the NRC's direct sound transmission facilities are presented in Figure 2.1.
Figure 2.1: The upper drawing shows the
NRC's direct wall sound transmission facility. The NRC's direct floor transmission facility, shown in the lower drawing, is similar except that one room is above the other.
For the wall facility, the rooms (designated “large chamber” and “small chamber”) have approximate volumes of 250 m3 and 140 m3 respectively. In the floor facility, both chambers have volumes of approximately 175 m3. All the facility rooms are hard-walled reverberation chambers that are vibration-isolated from each other and from the specimen frame. The rooms have fixed and/or moving diffusor panels to enhance diffusivity of the sound fields.
In both cases, full scale test assemblies are mounted in massive, concrete, movable test frames between the two reverberant rooms. The test openings are 3.66 m wide and 2.44 m high for walls and 4.70 m by 3.78 m for floors.
The facilities (including instrumentation) and the test procedures satisfy or exceed all requirements of ASTM E90.
Chapter 2: Sound Transmission through NLT Wall and Floor Assemblies
Each of the direct transmission facilities is equipped with an automated measurement system for data acquisition and post-processing. In each room, a calibrated Brüel & Kjær condenser microphone (type 4166 or 4165) with preamp is moved under computer control to nine positions, and measurements are made in both rooms using a National Instruments NI-4472 data acquisition system installed in a computer. Each room has four bi-amped loudspeakers driven by separate amplifiers and noise sources. To increase the diffusivity of the sound field, there are diffusing panels installed in each room.
Measurements of the direct airborne sound transmission loss (TL) were conducted in accordance with the requirements of ASTM E90-09, “Standard Method for Laboratory Measurement of Airborne Sound Transmission Loss of Building Partitions”. The sound transmission loss measurements were performed in both transmission directions – from the large chamber to the small chamber and vice-versa for walls, and from the upper chamber to the lower chamber and vice-versa for floors. The results presented in this Report are the average of the two transmission directions to reduce measurement uncertainty due to factors such as calibration errors and local variations in the sound fields.
For every measurement, the direct sound transmission loss values were calculated from the average sound pressure levels in the source room and the receiving room and the average reverberation times of the receiving room. One-third octave band sound pressure levels were measured for 32 seconds at nine microphone positions in each room and then averaged to get the average sound pressure level in each room. Five sound decays were averaged to get the reverberation time at each microphone position in the receiving room; these times were averaged to get the average reverberation times for each room. The frequency-dependent direct sound transmission loss was measured in one-third octave bands in the frequency range from 50 Hz to 5000 Hz. However, only the one-third octave bands from 125 Hz to 4000 Hz were used for the calculation of the STC rating in accordance with ASTM E413-16 [3].
In addition to the sound transmission measurements, several additional measurements were also made to characterize the NLT assemblies. The mass and dimensions of the materials were recorded and the structural reverberation times were determined in accordance with the requirements in ISO 10140 for thick and heavy wall or floor assemblies. The structural reverberation times are presented in Section 2.4 and Appendix A1 and the corresponding loss factors are also presented in Section 2.4.
Location of the test data:
• Transmission loss data in one-third octave bands is listed in Appendix A1. • Trends in those data are discussed in Sections 2.1 and 2.2.
• A summary of key single-number STC and ∆STC ratings determined from the tests is given in Tables A1.1 and A1.2 in Appendix A1, together with corresponding one-third octave band values.
2.1 NLT Walls and Floors without Linings
In this section, the focus is on the basic NLT1 assemblies (wall or floor) without an added lining such as a gypsum board finish supported on some form of framing.
Each of the NLT panels was fabricated by nailing together individual pieces of timber as illustrated conceptually in Figure 2.1.1 and discussed in more detail in Endnote 1 on page 49. This report includes test results on five thicknesses of NLT wall or floor assemblies which are listed in Table 2.1.1.
Figure 2.1.1:
A bare NLT assembly with no shear membrane or other lining on either side.
Table 2.1.1: Physical details of the five NLT assemblies evaluated in this report
NLT Designation Common Timber Name Mass / unit area (kg/m2) Fabrication NLT89 2x4 39.5
Fabricated from 2x4 timbers of nominal cross-section
38 mm x 89 mm
NLT140 2x6 65.8
Fabricated from 2x6 timbers of nominal cross-section
38 mm x 140 mm
NLT184 2x8 81.6
Fabricated from 2x8 timbers of nominal cross-section
38 mm x 184 mm
NLT235 2x10 89.5
Fabricated from 2x10 timbers of nominal cross-section
38 mm x 235 mm
NLT286 2x12 136.8
Fabricated from 2x12 timbers of nominal cross-section
Chapter 2: Sound Transmission through NLT Wall and Floor Assemblies
While the sound insulation data provided in this Report is based on measurements conducted with NLT assemblies with the specific parameters listed in Table 2.1.1, the data may also be used as a conservative estimate for NLT assemblies of similar construction but of greater thickness or higher mass.
Determination of the Base NLT assemblies for linings
Prior studies on concrete masonry walls as described in Research Report RR-334 and CLT assemblies as described in Research Report RR-335 have found that the application of linings to the bare assembly increases the transmission loss of the assembly both due to the lining and due to the sealing of voids or slits in the base assembly. It was concluded in those studies that in order to avoid overestimating the change the transmission loss when a lining was applied to the assembly with sound leakage, the change in the transmission loss due to stopping the leakage needed to be separated from the change in the transmission loss due to the lining. A procedure was developed where a thin layer of parge was applied to one side of the element to stop the leaks so that the transmission loss of just the element without leakage could be determined. The layer of parge was used because it effectively stopped the sound leakage without significantly changing the mass or stiffness of the element. The changes in the transmission loss of the parge itself could be determined by applying the parge to the other side of the element and subtracting the measured transmission loss of the element with parge on both sides from the transmission loss of the same element with parge on one side. Measurements were made on NLT89 and it was shown that the parge had a negligible transmission loss itself and therefore was a good means of sealing air leaks without affecting the transmission loss of the bare element.
For the NLT assemblies considered for this study, the appropriate Bare (with leakage) and the Base (no leakage) assemblies needed to be determined. This investigation is discussed in detail below. It was concluded that the Bare assembly would be the NLT assembly with a plywood shear element on one side since this is how the NLTs are used in practice.
Note that:
• The third-octave-band sound transmission loss data for the unsealed NLT assemblies with a plywood shear membrane on one side, referred to as the Bare assembly is shown in Table A1.1. • The third-octave-band sound transmission loss data for the sealed NLT assemblies with a
plywood shear membrane on one side, referred to as the Base assembly is shown in Table A1.2.
Each of the NLT assemblies listed in Table 2.1.1 was first tested with both surfaces of the assembly bare and then tested again with one or both of the surfaces parged with a thin layer of cementitious material that seals the openings of the cracks between the timber elements comprising the NLT. The purpose of the sealing of the cracks was to stop the leakage of sound through the cracks.
Figure 2.1.2:
Comparison of the sound transmission loss of the basic NLT89 assembly with no lining on either side (bare) and with parge on one and on both sides of the assembly (sealed).
Figure 2.1.2 presents the direct sound transmission loss measured for NLT89 both without a shear membrane or other linings and with parge on one or both sides of the assembly (sealed cases). Several features are obvious:
• The transmission loss curve for the bare NLT89 assembly is far below the transmission loss curve observed when the assembly was sealed with parge. The difference indicates that for this sample, there was significant sound leakage through the thin slits between the individual timbers of the NLT assembly.
• The result when both sides of the NLT assembly are sealed has the same STC rating as when only one side is sealed. The curves in the figure cross one another (mean difference = 0.2 dB) in the 250 Hz one-third octave band and the differences in any one-third octave band are smaller than the nominal measurement uncertainty. It was concluded that sealing the second side makes negligible practical difference compared to sealing one side of the NLT assembly and therefore subsequent assemblies were evaluated with parge on only one side.
The change in the transmission loss due to sealing the NLT89 assembly shown in Figure 2.1.2 was found to be typical for the other NLT assemblies, as shown in Figure 2.1.3.
0 5 10 15 20 25 30 35 40 45 50 63 125 250 500 1k 2k 4k S o u n d T ran sm is sio n L o ss ( d B )
1/3 Octave Band Center Frequency (Hz) NLT89 Assembly: Bare vs. Sealed
NLT89 No linings or parge, STC 24 NLT89 Sealed 1 side, STC 34 NLT89 Sealed both sides, STC 34
Chapter 2: Sound Transmission through NLT Wall and Floor Assemblies
Figure 2.1.3:
Comparison between the direct sound transmission loss for the bare and sealed NLT assemblies The upper graph shows transmission loss data for the sealed NLT assemblies.
The lower graph shows transmission loss data for the bare NLT assemblies.
10 15 20 25 30 35 40 45 50 55 60 63 125 250 500 1k 2k 4k S o u n d T ran sm is sio n L o ss ( d B )
1/3 Octave Band Center Frequency (Hz) Sealed NLT Assemblies NLT286 Sealed, STC 42 NLT235 Sealed, STC 39 NLT184 Sealed, STC 38 NLT140 Sealed, STC 38 NLT89 Sealed, STC 34 10 15 20 25 30 35 40 45 50 55 60 63 125 250 500 1k 2k 4k S o u n d T ran sm is sio n L o ss ( d B )
1/3 Octave Band Center Frequency (Hz) Bare NLT Assemblies NLT286 Bare, STC 39 NLT235 Bare, STC 29 NLT184 Bare, STC 24 NLT140 Bare, STC 22 NLT89 Bare, STC 24
In every case, across the frequency range of interest the bare NLT assembly had an appreciably lower transmission loss than the comparable sealed NLT assembly although there was less of an effect due to sealing observed for the thickest NLT assemblies as compared to the thinner assemblies. Because the sealing process should have a negligible effect on the parameters that are significant for sound transmission such as the stiffness or weight of the assembly, the results are a clear indication that air leakage through the slits between the timber elements of the NLT assemblies dominated the sound transmission for the bare assembly. This result is not surprising since the slits between the timber elements of the NLT assemblies were a millimetre wide in some instances.
Normally, NLT assemblies in a building include a shear membrane which is a layer of plywood or oriented strandboard (OSB) mechanically fastened with nails or screws to one face of the NLT assembly to resist shear forces that could otherwise distort the assembly. Figure 2.1.4 illustrates how the addition of a shear membrane alters the sound transmission loss of a bare or sealed 235 mm thick NLT assembly.
Figure 2.1.4:
Comparison of the sound transmission loss curves of NLT235 due to sealing the assembly and/or adding a shear membrane of 19 mm thick plywood (Ply19) or OSB (OSB19).
The trends evident for the NLT235 assemblies are typical for all of the thicknesses of the NLT assemblies: • Across all of the frequency range, adding a shear membrane or sealing the NLT assembly
increases the transmission loss.
• At the lower frequencies (up to about 1 kHz), sealing the NLT assembly increases the transmission loss more than simply adding a shear membrane of plywood or OSB to the unsealed NLT. This indicates that leakage through the slits between the timber elements of the NLT assembly significantly reduces the transmission loss even when the shear membrane is fastened to one face.
20 25 30 35 40 45 50 55 60 63 125 250 500 1k 2k 4k S o u n d T ran sm is sio n L o ss ( d B )
1/3 Octave Band Center Frequency (Hz) Adding Shear Bracing Layer (OSB19 or PLY19)
NLT235 Bare, STC 29 NLT235_PLY19, STC 36 NLT235_OSB19, STC 37 Sealed NLT235 , STC 39 Sealed NLT235_PLY19, STC 41
Chapter 2: Sound Transmission through NLT Wall and Floor Assemblies
• Above 1 kHz, adding the plywood shear membrane to a sealed NLT235 assembly results in an increase in the transmission loss, but below about 1 kHz, the transmission loss is not significantly changed.
• When OSB is substituted for plywood as the shear membrane, the transmission loss increases consistently for all frequencies above about 250 Hz and the STC rating increased by one point. This behaviour was observed for all thicknesses of NLT assemblies and provides good confidence that substituting OSB in place of plywood will give at least as good a sound transmission performance as the cases tested with plywood.
The magnitude and frequency of the peaks and dips shown in the figures below 500Hz are not consistent from one thickness of NLT to another. This is most evident in Figure 2.1.5 which shows the transmission loss curves for all five thicknesses of NLT assemblies with an attached shear membrane of 19 mm thick plywood. The dips are more pronounced than the corresponding peaks evident in the low frequency “plateau region” of the transmission loss curves presented for CLT panels in Research Report RR-335. The peaks and dips reflect the effect of the very different stiffness of the NLT assemblies in the directions parallel and perpendicular to the long axis of the timbers elements of the NLT assembly.
Despite the peaks and dips at the lower frequencies, one can still discern the division of the transmission loss curves into two regions: a region below 500 Hz where the curves show no consistent trend and a region above about 500 Hz where the curve steadily increases with increasing frequency.
Figure 2.1.5:
Comparison of the direct sound transmission loss curves for NLT assemblies with an added shear membrane of 19 mm thick plywood (Ply19). 20 25 30 35 40 45 50 55 60 63 125 250 500 1k 2k 4k S o u n d T ran sm is sio n L o ss ( d B )
1/3 Octave Band Center Frequency (Hz) Sealed NLT Assemblies with PLY19 Lining
Sealed NLT286_PLY19, STC 43 Sealed NLT235_PLY19, STC 41 Sealed NLT184_PLY19, STC 38 Sealed NLT140_PLY19, STC 36 Sealed NLT89_PLY19, STC 34
NLT assemblies used as a wall or floor in a building will typically have an attached layer of plywood or oriented strandboard on at least one side to provide adequate shear bracing. Hence, the sound transmission data in Figure 2.1.5 for the NLT assemblies with the shear element attached are an appropriate starting point for the evaluation of the expected sound transmission in a building with a structure of NLT wall and/or floor assemblies. These values are used as the reference for determining the effect of gypsum board linings (see Section 2.2) and would also be considered as the Base structure for the calculation of the ASTC rating as discussed in Research Report RR-335.
As noted previously, the results of the tests of the NLT assemblies with a plywood shear membrane should provide a conservative estimate for the transmission loss when OSB is substituted for the plywood.
The STC ratings and one-third octave band direct sound transmission loss values for all the tested NLT assemblies (for bare assemblies and for the corresponding assemblies with an added shear-membrane and or other linings) are presented in the tables in Appendix A1.
Chapter 2: Sound Transmission through NLT Wall and Floor Assemblies
2.2 Adding Linings on NLT Wall or Floor Assemblies
It is common practice, especially in residential buildings, to add finishing surfaces to the basic structural floor or wall assemblies to conceal both the bare structure surfaces as well as the building services such as electrical wiring, water pipes and ventilation ducts. The finishing on walls or ceilings is commonly comprised of gypsum board panels, framing used to support the gypsum board panels and sound absorptive material in the inter-framing cavities between the gypsum board and the face of the basic structural floor or wall assemblies. On floors, the finish may include toppings such as concrete or a floating floor as well as flooring such as hardwood or tiles. These elements are described in ISO 15712-1 as “linings” or “liners” or “layers” or “coverings”. The term “linings” is used in this Report.
Two methods of characterizing the change in the direct sound transmission loss of the NLT assemblies by adding a lining are used in this Report. The first method is the change in the transmission loss (ΔTL) which is calculated from the difference between the transmission loss values measured with the lining installed on the Base NLT assembly and the transmission loss values of the Base NLT assembly without a lining. The Base NLT assembly is the NLT with the shear membrane attached to one side without leakage. The ΔTL is used for the calculation of the ASTC rating using the Detailed Method of ISO 15712-1 which is discussed in Research Report RR-335.
The second method of characterizing the change in the direct sound transmission loss of the NLT assemblies by adding a lining is a single-number rating called the ΔSTC. The ASTM standards do not define a rating like ΔSTC, but there is a counterpart in the ISO standards called ΔRW. The calculation of the ΔSTC rating is adopted from the ISO standard with modification as explained in Appendix A2 of this Report. The ΔSTC rating is used for the calculation of the ASTC rating using the Simplified Method of ISO 15712-1 which is discussed in Research Report RR-335.
The linings evaluated on NLT assemblies for this study are described in Tables 2.2.1 and 2.2.3. The ΔSTC ratings for the measured linings are listed in Table 2.2.2.1 of Section 2.2.2. The ΔTL values for the measured linings are provided in Appendix A1. Because of the strong similarity to measured performance of corresponding linings on CLT Base assemblies, some results for CLTs from Research Report RR-335 can also be used as conservative estimates on NLTs, as discussed later in Section 2.2.1.
Each Lining Code shown in Tables 2.2.1 to 2.2.3 begins with “ΔTL-NLT” to indicate that the lining applied to a NLT assembly has an effect on the direct sound transmission loss through the lined assembly. In some cases the thickness of the NLT assembly is indicated (as in “ΔTL-NLT235”) if the result applies only to that thickness. For the three linings in Table 2.2.2 (W03, W04, and W05), the code does not indicate the thickness of the Base assembly because these are conservative estimates based on results for CLT assemblies that are assumed to apply for all thicknesses of the NLT assemblies. The final part of the lining code is a letter (such as “W” to indicate a wall lining or “F” for a floor lining) followed by a unique number used to identify the lining in the table of ΔSTC ratings.
The Descriptive Short Code provides a compact physical description of each lining, which is used in the figure captions and in the examples throughout this Report. This code identifies the elements of the lining beginning at the exposed side and proceeding to the face of the supporting NLT wall or floor assembly. As detailed in the descriptions in Tables 2.2.1 and 2.2.2, each component of the lining is described by a short code. For example: G13 is gypsum board that is 12.7 mm thick, 2G13 is two connected G13 layers, and WFUR38 is a 38 mm x 38 mm wood furring. The distance between components such as adjacent studs is indicated by a number in parentheses which is the distance (on centre) between the components in millimetres.
The spacing and type of fasteners are not stated in the tables, but they are assumed to conform to standard industry practice as specified in the endnotes. Where sound absorbing material such as glass fiber batts (GFB) was included in a tested assembly, the code indicates the specific material that was tested, but applicability to other sound absorbing materials is assumed, as explained in Endnote 2 on page 49.
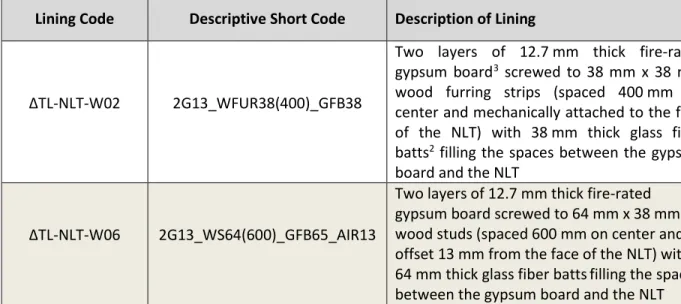
Table 2.2.1: Linings tested on Base NLT wall assemblies. Linings W02 and W06 from Research Report
RR-335 were chosen to give the key points for interpolating to relate other linings tested on CLT assemblies to expected performance of the same linings on NLT assemblies.
Lining Code Descriptive Short Code Description of Lining
ΔTL-NLT-W02 2G13_WFUR38(400)_GFB38
Two layers of 12.7 mm thick fire-rated gypsum board3 screwed to 38 mm x 38 mm wood furring strips (spaced 400 mm on center and mechanically attached to the face of the NLT) with 38 mm thick glass fiber batts2 filling the spaces between the gypsum board and the NLT
ΔTL-NLT-W06 2G13_WS64(600)_GFB65_AIR13
Two layers of 12.7 mm thick fire-rated gypsum board screwed to 64 mm x 38 mm wood studs (spaced 600 mm on center and offset 13 mm from the face of the NLT) with 64 mm thick glass fiber battsfilling the spaces between the gypsum board and the NLT NOTES: a. For the notes in this table please see the corresponding endnotes from page 49.
Chapter 2: Sound Transmission through NLT Wall and Floor Assemblies
Table 2.2.2: Linings tested on Base CLT wall assemblies (see Research Report RR-335) that could be used
as conservative estimates for linings on NLT assemblies.
Lining Code Descriptive Short Code Description of Lining
ΔTL-NLT-W01 2G13 Two layers of 12.7 mm thick fire-rated gypsum board2
ΔTL-NLT-W03 2G13_WFUR38(600)_GFB38
Two layers of 12.7 mm thick fire-rated gypsum board screwed to 38 x 38 mm wood furring (spaced 600 mm on center and mechanically attached to the face of the NLT) with 38 mm thick glass fiber battsfilling the spaces between the gypsum board and the NLT
ΔTL-NLT-W04 WFUR38(400)_GFB38 2G13_RC13(600)_
Two layers of 12.7 mm thick fire-rated gypsum boardscrewed to 13 mm resilient metal channels4 (spaced 600 mm on center) that are screwed to 38 x 38 mm wood furring (spaced 400 mm on center and mechanically attached to the face of the NLT) with 38 mm thick glass fiber batts filling the spaces between the gypsum board and the NLT
ΔTL-NLT-W05 2G13_WFUR64(600)_GFB65
Two layers of 12.7 mm thick fire-rated gypsum board screwed to 64 x 38 mm wood furring (spaced 600 mm on center and mechanically attached to the face of the NLT) with 64 mm thick glass fiber batts filling the spaces between the gypsum board and the NLT
NOTES: a. For the notes in this table please see the corresponding endnotes from page 49. b. The linings listed for wall assemblies may also be used on ceilings.
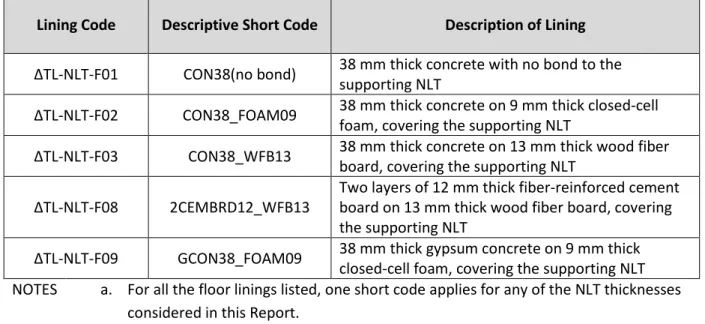
Table 2.2.3: Floor linings tested on Base CLT floor assemblies (see Research Report RR-335) that could
be used as conservative estimates for linings on NLT assemblies.
Lining Code Descriptive Short Code Description of Lining
ΔTL-NLT-F01 CON38(no bond) 38 mm thick concrete with no bond to the supporting NLT
ΔTL-NLT-F02 CON38_FOAM09 38 mm thick concrete on 9 mm thick closed-cell foam, covering the supporting NLT
ΔTL-NLT-F03 CON38_WFB13 38 mm thick concrete on 13 mm thick wood fiber board, covering the supporting NLT
ΔTL-NLT-F08 2CEMBRD12_WFB13
Two layers of 12 mm thick fiber-reinforced cement board on 13 mm thick wood fiber board, covering the supporting NLT
ΔTL-NLT-F09 GCON38_FOAM09 38 mm thick gypsum concrete on 9 mm thick closed-cell foam, covering the supporting NLT NOTES a. For all the floor linings listed, one short code applies for any of the NLT thicknesses
Chapter 2: Sound Transmission through NLT Wall and Floor Assemblies
2.2.1 Measured Change
ΔTL due to Linings on NLT Assemblies
The trends in the measured sound transmission loss curves for the cases where linings were applied to NLT assemblies are presented and discussed in this Section. The corresponding ΔSTC ratings for each of the linings are shown in the tables presented in Section 2.2.2. The ΔSTC ratings are needed for the Simplified Method of calculating the ASTC rating as discussed in Reports RR-331 and RR-335. The averaged one-third octave band changes in the direct sound transmission loss (ΔTL) for the set of linings applied to the NLT assemblies are given in Table A1.3 in Appendix A1. The data in Appendix A1 is needed for calculating the ASTC rating using the Detailed Method as presented in Research Report RR-335.
Linings W02 and W06 were chosen to give the key points for relating linings tested on CLT assemblies to the expected performance on NLT assemblies. Each lining was tested with the lining applied on only one side of the Base NLT assembly which is comprised of the NLT and the plywood or OSB shear membrane fixed on one side. Because the Base assembly is asymmetric (with a shear membrane mechanically attached on one side of the NLT assembly) two configurations for each lining were tested:
a. With the lining applied on the same side as the plywood shear membrane b. With the lining on the opposite side from the plywood shear membrane.
A comparison of the sound transmission loss curves for two linings (each installed first on the plywood side and then the opposite side of a Base NLT_PLY19 assembly) is presented in Figure 2.2.1.1.
Figure 2.2.1.1:
Comparison of the transmission loss curves for the NLT235_PLY19 assembly with the W02 or W06 lining on either side of the assembly. -10 0 10 20 30 40 50 60 70 80 90 63 125 250 500 1k 2k 4k S o u n d T ran sm is sio n L o ss ( d B )
1/3 Octave Band Center Frequency (Hz) Effect of Adding Linings to NLT235_PLY19
PLY19_NLT235_ AIR13_WS64(600)_GFB65_2G13, STC 61 NLT235_PLY19_ AIR13_WS64(600)_GFB65_2G13, STC 64 PLY19_NLT235_WF38(400)_GFB38_2G13, STC 46 NLT235_PLY19_WF38(400)_GFB38_2G13, STC 47 Sealed NLT235_PLY19 , STC 41
The results in Figure 2.2.1.1 illustrate the key features typical of all linings discussed in this Report: • For each lining, there is a slight difference in the sound transmission loss if the lining is mounted
over the plywood shear membrane or on the bare NLT on the opposite side.
• A higher STC rating is achieved if the lining is mounted on the same side as the plywood shear membrane. The same pattern was observed for all four thicknesses of NLT on which this set of linings was tested.
In order to prevent confusion when the linings are used on NLT assemblies in practice and for compatibility with the calculation method presented in Reports RR-331 and RR-335, the structural assemblies should be symmetrical and the effect of adding a lining should be the same when it is added on either side. To work within that framework, some conservative simplifications were made in the process for calculating the change in the sound transmission loss (ΔTL) due to the addition of the linings:
• The Base NLT assembly comprised of the NLT assembly and the shear membrane is treated as acoustically symmetric, despite the shear membrane on one side.
• Use the lower of the measurements for the lining applied on each side of the NLT assembly to calculate the ΔTL to remove the effect of whether the plywood is on the same side as the lining or the opposite side. This gives the correct result if the same lining is on both sides, and permits use of the Simplified Method for the calculation of the ASTC rating.
• Determine the ΔTL values for all NLT thicknesses and use the average value the results are not significantly different.
The values of ΔTL derived from the measurements for the W02 lining (2G13_WFUR38(400)_GFB38 ) are presented in Figure 2.2.1.2. There is some scatter in the results, but for the most part, the data points are within the range of the experimental uncertainty.
Chapter 2: Sound Transmission through NLT Wall and Floor Assemblies
Figure 2.2.1.2:
Change in the sound transmission loss (ΔTL) due to the addition of the W02 lining (construction code 2G13_WFUR38(400)_GFB38) on the Base NLT assemblies of different thicknesses.
Data for NLT89 assemblies were not included in this analysis because that NLT assembly was not tested with the combination of a shear membrane and the gypsum board lining.
The ΔTL curves for lining W02 show similar trends for all of the thicknesses of the NLT assemblies with a well-defined mass-air-mass resonance at the 125 Hz one-third octave band and the gypsum board coincidence dip near the 2500 Hz one-third octave band. Note that due to the mass-air-mass resonance dip, the use of lining W02 negatively affects the transmission loss of the NLT assembly when it is applied.
There are differences in the magnitudes of the ΔTL curves and the ΔSTC rating for each thickness of NLT assembly. Therefore, the ΔTL curve and the ΔSTC rating used should be specific to the NLT assembly thickness rather than using an average of the values over all thicknesses for the calculation of the ASTC rating.
The values of ΔTL derived from the measurements for the W06 lining (2G13_WS64(600)_GFB65_AIR13) are presented in Figure 2.2.1.3. There is some scatter in the results, but the data points are within 5 dB.
-15 -10 -5 0 5 10 15 20 63 125 250 500 1k 2k 4k C h an g e in T ran sm is sio n L o ss Δ TL (d B )
1/3 Octave Band Center Frequency (Hz) ΔTL for Lining W02 Lining_W02 on NLT140_PLY19 -∆STC = 1 Lining_W02 on NLT184_PLY19 -∆STC = -3 Lining_W02 on NLT235_PLY19 -∆STC = -3 Lining_W02 on NLT286_PLY19 -∆STC = -7 Mean Lining W02
Figure 2.2.1.3:
Change in the sound transmission loss (ΔTL) due to the addition of the W06 lining (construction code
2G13_WS64(600)_GFB65_AIR13) on the Base NLT assemblies of different thicknesses.
Data for NLT89 assemblies were not included in this analysis because that NLT assembly was not tested with the combination of a shear membrane and the gypsum board lining.
The ΔTL curves for this lining show similar trends for all of the NLT thicknesses, with the mass-air-mass resonance well below the frequency range of interest and the gypsum board coincidence dip at the 2500 Hz one-third octave band. The full set of ΔTL values are listed in Table A1.3 of Appendix A1, and the calculations of the ΔSTC rating are presented in Table 2.2.2.1 in Section 2.2.2.
-5 0 5 10 15 20 25 30 35 63 125 250 500 1k 2k 4k C h an g e in T ran sm is sio n L o ss Δ TL (d B )
1/3 Octave Band Center Frequency (Hz) ΔTL for Lining W06 Lining_W06 on NLT140_PLY19 -∆STC = 23 Lining_W06 on NLT184_PLY19 -∆STC = 19 Lining_W06 on NLT235_PLY19 -∆STC = 19 Lining_W06 on NLT286_PLY19 -∆STC = 20 Mean Lining W06
Chapter 2: Sound Transmission through NLT Wall and Floor Assemblies
2.2.2
ΔSTC Ratings for Linings on NLT Assemblies
Section 2.2.1 presented and discussed the trends in the sound transmission loss for a series of NLT assemblies comprising a Base NLT_PLY19 wall assembly with an added lining covering one side of the Base assembly. This Section 2.2.2 presents the corresponding single-number ΔSTC ratings for the assemblies.
Key points regarding the ΔSTC rating include:
• The ΔSTC rating is a required input for the calculation of the ASTC rating using the Simplified Method of ISO 15712-1 which is discussed in Research Report RR-335.
• The ΔSTC ratings are calculated from the experimental data in this Report using the procedure described in Appendix A2.
• Readers of this Report can simply use the tabulated ΔSTC ratings from Table 2.2.2.1 in calculations like those in the examples of Research Report RR-335, without the need to perform the calculations detailed in the Appendix.
The ΔSTC ratings for the linings are presented in Table 2.2.2.1 and the corresponding ΔTL values are listed in Table A1.3 of Appendix A1.
ΔSTC ratings for linings tested on NLT wall assemblies
A quick scan of the calculated ΔSTC ratings in Table 2.2.2.1 shows that for lining W02 there is a strong variation in the results, from a slight improvement to a significant reduction of the STC rating, so using a mean value for all thicknesses of NLT is not recommended. Instead, the ΔSTC rating for W02 specific to the thickness of the NLT should be used.
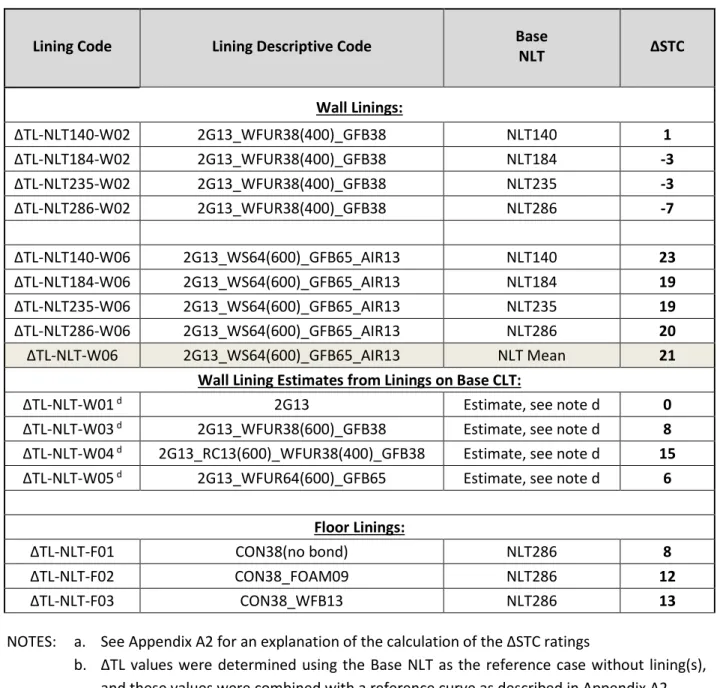
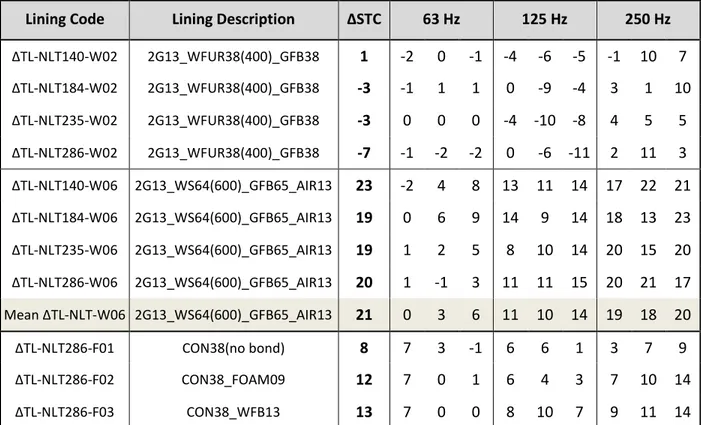
Table 2.2.2.1: ΔSTC ratings for linings on NLT wall or floor surfaces.
Lining Code Lining Descriptive Code Base
NLT ΔSTC Wall Linings: ΔTL-NLT140-W02 2G13_WFUR38(400)_GFB38 NLT140 1 ΔTL-NLT184-W02 2G13_WFUR38(400)_GFB38 NLT184 -3 ΔTL-NLT235-W02 2G13_WFUR38(400)_GFB38 NLT235 -3 ΔTL-NLT286-W02 2G13_WFUR38(400)_GFB38 NLT286 -7 ΔTL-NLT140-W06 2G13_WS64(600)_GFB65_AIR13 NLT140 23 ΔTL-NLT184-W06 2G13_WS64(600)_GFB65_AIR13 NLT184 19 ΔTL-NLT235-W06 2G13_WS64(600)_GFB65_AIR13 NLT235 19 ΔTL-NLT286-W06 2G13_WS64(600)_GFB65_AIR13 NLT286 20 ΔTL-NLT-W06 2G13_WS64(600)_GFB65_AIR13 NLT Mean 21
Wall Lining Estimates from Linings on Base CLT:
ΔTL-NLT-W01 d 2G13 Estimate, see note d 0
ΔTL-NLT-W03 d 2G13_WFUR38(600)_GFB38 Estimate, see note d 8 ΔTL-NLT-W04 d 2G13_RC13(600)_WFUR38(400)_GFB38 Estimate, see note d 15 ΔTL-NLT-W05 d 2G13_WFUR64(600)_GFB65 Estimate, see note d 6
Floor Linings:
ΔTL-NLT-F01 CON38(no bond) NLT286 8
ΔTL-NLT-F02 CON38_FOAM09 NLT286 12
ΔTL-NLT-F03 CON38_WFB13 NLT286 13
NOTES: a. See Appendix A2 for an explanation of the calculation of the ΔSTC ratings
b. ΔTL values were determined using the Base NLT as the reference case without lining(s), and these values were combined with a reference curve as described in Appendix A2. c. The ΔSTC ratings should be appropriate for all walls or floor/ceilings with a core of NLT d. For W01, W03, W04, and W05, each listed value was determined for application on a CLT
Base assembly (see RR-335) but gives a conservative estimate of the ΔSTC rating on the Base NLT.
Chapter 2: Sound Transmission through NLT Wall and Floor Assemblies
Comparison between Linings Tested on NLT and CLT assemblies
For both Lining W02 and W06, the measured values of ΔTL consistently show very similar frequency dependence when added to NLT or CLT assemblies, but are slightly higher when added to NLT assemblies. The results demonstrate that it is reasonable to use ΔSTC ratings measured for CLT assemblies as credible but conservative estimates of the ΔSTC ratings for the same linings applied to NLT assemblies.
The similarities in the ΔTL curves for linings applied to NLT and CLT assemblies can be seen in Figure 2.2.2.1 which compares the ΔTL curves of lining W02 installed on the different assemblies and in Figure 2.2.2.2 which compares the ΔTL curves of lining W06 installed on the different assemblies. Both figures show that there are strong similarities both in the frequency dependence of the individual curves and in the variation of the ΔSTC rating with the thickness of the mass-timber Base assembly.
Figure 2.2.2.1:
Change in the sound transmission loss (ΔTL) due to the addition of the W02 lining (construction code 2G13_WFUR38(400)_GFB38) on the Base NLT and CLT assemblies of different thicknesses.
For lining W02, the strong variation in the ΔSTC ratings vs thickness (and weight) of the mass-timber
assemblies results from the method of calculating the STC rating which can be limited by a sharp dip in the transmission loss curve. For lining W02, the sharp dip is caused by a mass-air-mass resonance around the 125 Hz one-third octave band. The dip can result in negative values for the ΔTL in the one-third octave bands at and below 160 Hz meaning that the addition of the linings decreases the transmission loss of the assembly. When the mass-air-mass resonance is shifted to a lower frequency by increasing the depth of the cavity between the gypsum board and the timber assembly (as for Lining W06), then the resonance and its adverse effect on the STC ratings are reduced as shown in Figure
-15 -10 -5 0 5 10 15 20 63 125 250 500 1k 2k 4k C h an g e in T ran sm is sio n L o ss Δ TL (d B )
1/3 Octave Band Center Frequency (Hz) ΔTL for Lining W02 on NLT vs. ΔTL on CLT Assemblies
Lining W02 on CLT175(5-ply), ΔSTC = -5 Lining W02 on CLT78(3-ply), ΔSTC = 4 Lining_W02 on NLT140_PLY19, ΔSTC = 2 Lining_W02 on NLT184_PLY19, ΔSTC = 0 Lining_W02 on NLT235_PLY19, ΔSTC = -2 Lining_W02 on NLT286_PLY19, ΔSTC = -6
Figure 2.2.2.2:
Change in the sound transmission loss (ΔTL) due to the addition of the W06 lining (construction code
2G13_WS64(600)_GFB65_AIR13) on the Base NLT and CLT assemblies of different thicknesses.
For Lining W06, the variation in ΔTL with the thickness of the NLT assembly is small and there is no
consistent trend in the ΔSTC rating for different thicknesses of the NLT assemblies. It is reasonable to use a mean value of the ΔSTC rating for lining W06 with for all thicknesses of NLT when calculating the ASTC rating. -10 -5 0 5 10 15 20 25 30 35 63 125 250 500 1k 2k 4k C h an g e in T ran sm is sio n L o ss Δ TL (d B )
1/3 Octave Band Center Frequency (Hz) ΔTL for Lining W06 on NLT vs. ΔTL on CLT Assemblies
Lining W06 on CLT175(5-ply), ΔSTC = 16
Lining_W06 on NLT140_PLY19, ΔSTC = 24
Lining_W06 on NLT184_PLY19, ΔSTC = 20
Lining_W06 on NLT235_PLY19, ΔSTC = 21
Chapter 2: Sound Transmission through NLT Wall and Floor Assemblies
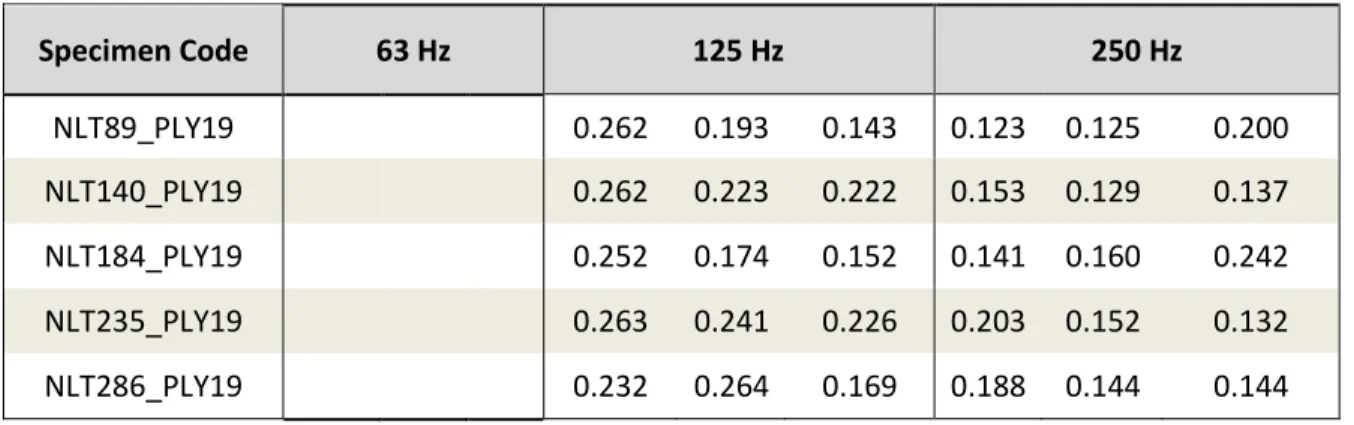
2.3 Structural Loss Factors for NLT Wall or Floor Assemblies
The structural loss factors required for the calculation of the ASTC rating using the Detailed Method were calculated from the structural reverberation times measured for each NLT assembly according to the standard, ISO 10848. Following ISO 10848, the structural loss factor ������ was calculated from the measured structural reverberation time such that:
������ =��2.2
�
Eq. 2.3.1
where f is the one-third octave band frequency in Hz and �� is the structural reverberation time per one-third octave band in seconds. The resulting loss factors are compared in Figure 2.3.1. and are listed in Table A1.9 of Appendix A1.
Figure 2.3.1:
Comparison of the structural loss factors,
������ for the five NLT
Base assemblies.
For the calculation of the ASTC rating using the Detailed Method, the effect of edge conditions may be ignored for building elements with structural loss factors greater than 0.03. Figure 2.3.1 shows that over the frequency range used for the STC rating (125 Hz to 4000 Hz), the loss factors tend to be above 0.03 and the loss factor averaged across the NLT assemblies and the frequencies is above 0.03. The loss factor greater than 0.03 greatly simplifies the calculation of the ASTC rating for constructions which include NLT assemblies. 0.000 0.020 0.040 0.060 0.080 0.100 0.120 125 250 500 1k 2k 4k Lo ss F a ct o r
1/3 Octave Band Center Frequency (Hz) Measured Loss Factors for the Base NLT Assemblies
NLT89_PLY19 NLT140_PLY19 NLT184_PLY19 NLT235_PLY19 NLT286_PLY19 Loss Factor = 0.03 Average = 0.05
Appendices of Sound Transmission Data
3
Appendices of Sound Transmission Data
Appendix A1 presents data in one-third octave bands. The data includes:
A1. 1. Airborne sound transmission loss for the Bare NLT assemblies including a 19 mm plywood shear membrane attached on 1 side of the NLT assembly (see page 9 for an explanation of the Bare NLT).
A1. 2. Airborne sound transmission loss for the Base NLT assemblies including a 19 mm plywood shear membrane attached on 1 side of the sealed NLT assembly (see page 9 for an explanation of the Base NLT).
A1. 3. One-third octave band ΔTL values for the change in sound transmission loss due to the addition of linings to the Base NLT assemblies (See Section 2.2)
A1. 4. Airborne sound transmission loss data for NLT89 assemblies A1. 5. Airborne sound transmission loss data for NLT140 assemblies A1. 6. Airborne sound transmission loss data for NLT184 assemblies A1. 7. Airborne sound transmission loss data for NLT235 assemblies A1. 8. Airborne sound transmission loss data for NLT286 assemblies A1. 9. Structural reverberation times for the tested NLT assemblies
Details of the test facilities and the measurement procedures are given in Chapter 2.
Appendix A2 presents the procedure for calculating the ΔSTC rating for linings on NLT assemblies. It is a
subset of a more general set of procedures presented in NRC Research Report RR-331, “Guide to Calculating Airborne Sound Transmission in Buildings”.
3.1 Appendix A1: Transmission Loss Data for NLT Wall and Floor Assemblies
Table A1.1: Sound transmission loss data for Bare NLT assemblies which have a shear membrane of19 mm plywood attached on one side and the other side is unsealed. Attaching a shear membrane to the NLT assembly is normal practice to provide structural rigidity in typical applications, as explained in Section 2.1. The data in the table is the data that should be used if just the direct transmission of the NLT assembly is required.
Specimen Code Description STC 63 Hz 125 Hz 250 Hz
Bare NLT89 NLT89_PLY19 29 27 25 28 29 27 23 22 21 23 Bare NLT140 NLT140_PLY19 31 32 33 34 29 27 23 24 22 24 Bare NLT184 NLT184_PLY19 31 35 36 33 28 29 21 22 25 26 Bare NLT235 NLT235_PLY19 36 34 35 30 27 31 30 27 29 29 Bare NLT286 NLT286_PLY19 41 30 34 33 29 31 33 34 33 36 Note 1: For NLT assembly thicknesses not listed, use the data from a listed NLT assembly with a smaller thickness as a conservative estimate.
Appendices of Sound Transmission Data
(Continuation of Table A1.1 from opposite page):
500 Hz 1000 Hz 2000 Hz 4000 Hz Reference 25 25 26 27 29 31 32 34 36 38 40 42 TLA-17-143 25 26 28 30 31 33 34 35 36 38 40 42 TLA-18-027 26 26 28 29 31 33 34 35 37 40 42 45 TLA-18-004 30 31 34 35 37 39 39 40 41 44 46 49 TLA-18-038 36 37 38 40 41 42 43 44 46 49 52 54 TLA-18-051, TLF-18-021
Table A1.2: Sound transmission loss data for Base NLT assemblies which have a shear membrane of
19 mm plywood attached on one side of the sealed NLT assembly. Attaching a shear membrane to the NLT assembly is normal practice to provide structural rigidity in typical applications, as explained in Section 2.1. The Base NLT data is used to calculate the ΔTL values and the ΔSTC rating as explained in Appendix 2. When used as the bare common partition for the calculation of the ASTC rating, the data in the table is adjusted for leakage. For example, see Example 4.2-H1 of Research Report RR-335.
Specimen Code Description STC 63 Hz 125 Hz 250 Hz
Base NLT89 NLT89_PLY19 34 25 25 26 25 29 27 25 23 25 Base NLT140 NLT140_PLY19 36 31 30 30 29 32 28 29 25 30 Base NLT184 NLT184_PLY19 38 31 31 30 28 33 26 25 35 28 Base NLT235 NLT235_PLY19 41 30 33 31 30 35 33 27 36 34 Base NLT286 NLT286_PLY19 43 30 35 35 29 32 35 35 33 38 Note 1: ∆PLY19 is change adding PLY19 for TLA-18-048vs.036, TLA-18-046vs.047, TLA-18-060vs.061 Note 2: For NLT assembly thicknesses not listed, use the data from a listed NLT assembly with a smaller thickness as a conservative estimate.
Table A1.3: Change in sound transmission loss (ΔTL) due to linings on NLT wall assemblies
Lining Code Lining Description ΔSTC 63 Hz 125 Hz 250 Hz
ΔTL-NLT140-W02 2G13_WFUR38(400)_GFB38 1 -2 0 -1 -4 -6 -5 -1 10 7 ΔTL-NLT184-W02 2G13_WFUR38(400)_GFB38 -3 -1 1 1 0 -9 -4 3 1 10 ΔTL-NLT235-W02 2G13_WFUR38(400)_GFB38 -3 0 0 0 -4 -10 -8 4 5 5 ΔTL-NLT286-W02 2G13_WFUR38(400)_GFB38 -7 -1 -2 -2 0 -6 -11 2 11 3 ΔTL-NLT140-W06 2G13_WS64(600)_GFB65_AIR13 23 -2 4 8 13 11 14 17 22 21 ΔTL-NLT184-W06 2G13_WS64(600)_GFB65_AIR13 19 0 6 9 14 9 14 18 13 23 ΔTL-NLT235-W06 2G13_WS64(600)_GFB65_AIR13 19 1 2 5 8 10 14 20 15 20 ΔTL-NLT286-W06 2G13_WS64(600)_GFB65_AIR13 20 1 -1 3 11 11 15 20 21 17 Mean ΔTL-NLT-W06 2G13_WS64(600)_GFB65_AIR13 21 0 3 6 11 10 14 19 18 20 ΔTL-NLT286-F01 CON38(no bond) 8 7 3 -1 6 6 1 3 7 9 ΔTL-NLT286-F02 CON38_FOAM09 12 7 0 1 6 4 3 7 10 14 ΔTL-NLT286-F03 CON38_WFB13 13 7 0 0 8 10 7 9 11 14 Note 1: A + symbol indicates that the values are from an averaging of test data.
Appendices of Sound Transmission Data
(Continuation of Table A1.2 from opposite page):
500 Hz 1000 Hz 2000 Hz 4000 Hz Reference 27 29 30 32 35 39 42 44 47 49 51 53 TLA-17-152, ∆PLY191 30 31 33 35 37 40 42 43 45 47 51 54 TLA-18-048 35 32 35 36 40 42 44 43 45 48 51 54 TLA-18-022, ∆PLY191 37 36 39 39 41 42 43 46 48 51 54 57 TLA-18-046 37 40 41 42 43 43 45 48 50 53 56 59 TLF-18-016, TLF-18-035
(Continuation of Table A1.3 from opposite page):
500 Hz 1000 Hz 2000 Hz 4000 Hz Reference 10 13 13 13 13 13 12 12 7 7 7 9 TLA-18-029,035,048 7 11 10 11 10 11 12 12 8 7 9 10 TLA-18-013,021,022+ 4 9 8 11 13 14 15 12 8 8 9 11 TLA-18-040,043,046 7 8 9 12 13 15 14 11 8 9 10 11 TLA-18-052,057,060 25 28 28 29 29 29 28 29 26 27 27 27 TLA-18-031,033,048 20 25 24 26 25 26 27 30 28 28 29 28 TLA-18-014,019,022+ 19 22 20 21 24 27 30 29 27 27 29 26 TLA-18-029,041,045 19 19 20 22 23 27 29 27 25 26 28 25 TLA-18-053,059,060 21 23 23 25 25 27 29 29 26 27 28 27 12 10 7 11 14 16 19 21 23 24 24 25 TLF-18-023,035 16 13 10 14 18 23 28 32 36 37 35 33 TLF-18-026,035 17 14 12 16 19 20 23 26 28 29 31 30 TLF-18-029,035
Table A1.4: Measured sound transmission loss data for NLT89 assemblies with and without a lining. Specimen Code STC 63 Hz 125 Hz 250 Hz Bare NLT89 24 18 16 15 14 17 16 16 18 18 PLY19_NLT89 29 27 25 28 29 27 23 22 21 23 PLY19_NLT89_PLY19 33 26 26 27 26 30 29 28 25 25 NLT89_OSB19 30 28 27 28 29 31 24 22 21 23 NLT89_WF38(400)_GFB38_2G13 40 29 26 23 19 21 19 25 33 36 NLT89_AIR13_WS64(600)_GFB65_2G13 52 23 19 18 22 28 31 36 41 45 PLSTR_NLT89 34 25 25 25 25 28 27 25 23 27 PLSTR_NLT89_PLSTR 34 26 25 26 25 29 28 27 22 27
Table A1.5 Measured sound transmission loss data for NLT140 assemblies with and without a lining
Specimen Code STC 63 Hz 125 Hz 250 Hz Bare NLT140 22 19 18 16 15 18 17 19 19 21 PLY19_NLT140 31 32 33 34 29 27 23 24 22 24 NLT140_OSB19 32 32 34 32 27 24 23 23 22 25 PLSTR_NLT140 38 31 31 30 28 31 29 30 25 33 NLT140_PLY19_WF38(400)_GFB38_2G13 44 30 31 31 28 26 23 28 35 37 PLY19_NLT140_WF38(400)_GFB38_2G13 45 29 30 29 25 26 24 31 37 40 NLT140_PLY19_AIR13_WS64(600)_GFB65_2G13 60 29 34 38 42 43 42 46 47 51 PLY19_NLT140_AIR13_WS64(600)_GFB65_2G13 62 32 34 38 44 48 45 46 47 52 PLSTR_NLT140_PLY19 36 31 30 30 29 32 28 29 25 30
Appendices of Sound Transmission Data
(Continuation of Table A1.4 from opposite page):
500 Hz 1000 Hz 2000 Hz 4000 Hz Reference 21 22 24 25 26 25 23 23 26 26 25 25 TLA-17-142 25 25 26 27 29 31 32 34 36 38 40 42 TLA-17-143 26 27 28 30 33 36 38 41 43 46 49 52 TLA-17-144 25 25 26 28 31 33 33 35 37 40 43 46 TLA-17-147 37 41 44 46 48 50 52 51 50 52 55 58 TLA-17-148 50 54 57 60 62 64 64 62 61 64 67 71 TLA-17-151 27 30 31 33 35 38 40 41 42 42 43 42 TLA-17-152 26 29 30 32 35 37 39 41 43 43 43 44 TLA-17-153
(Continuation of Table A1.5 from opposite page):
500 Hz 1000 Hz 2000 Hz 4000 Hz Reference 22 24 25 24 23 21 22 23 21 23 22 22 TLA-18-023 25 26 28 30 31 33 34 35 36 38 40 42 TLA-18-027 26 28 30 32 33 34 35 36 38 40 43 47 TLA-18-032 29 33 36 38 40 41 42 42 41 41 43 44 TLA-18-036 40 44 46 48 50 53 54 55 52 54 58 63 TLA-18-029 41 45 46 49 52 56 59 57 55 58 63 68 TLA-18-035 55 59 61 64 66 69 70 72 71 74 78 81 TLA-18-031 56 60 62 65 68 72 74 74 72 75 81 83 TLA-18-033 30 31 33 35 37 40 42 43 45 47 51 54 TLA-18-048