HAL Id: hal-01462761
https://hal.archives-ouvertes.fr/hal-01462761
Submitted on 5 Jun 2020HAL is a multi-disciplinary open access
archive for the deposit and dissemination of sci-entific research documents, whether they are pub-lished or not. The documents may come from teaching and research institutions in France or abroad, or from public or private research centers.
L’archive ouverte pluridisciplinaire HAL, est destinée au dépôt et à la diffusion de documents scientifiques de niveau recherche, publiés ou non, émanant des établissements d’enseignement et de recherche français ou étrangers, des laboratoires publics ou privés.
Scenarios’ simulation results
Chantal Le Mouël
To cite this version:
Chantal Le Mouël. Scenarios’ simulation results. [Technical Report] auto-saisine. 2016, 28 p. �hal-01462761�
Agrimonde-Terra foresight: Land use and food security in 2050
Technical report
Scenarios’ simulation results
Le Mouël C. (Inra, SMART, Rennes)
with contributions from: Marajo-Petitzon E. (Inra, SMART, Rennes), Dumas P. (Cirad, CIRED,
Nogent/Marne), Manceron S. (Inra, DEPE, Paris), Forslund A. (Inra, SAE2, Rennes), Mora O.
(Inra, DEPE, Paris)
2
Table of content
Introduction...3
1. “Metropolization”…...4
2. “Regionalization” ...9
3. “Healthy”...15
4. “Communities”...21
3
Introduction
GlobAgri-AgT has been used to simulate the impacts on world and regional land use, agricultural production and agricultural trade of the five Agrimonde-Terra scenarios. For most scenarios several hypotheses of change pattern may co-exist for several drivers. This means that for these drivers, world’s regions can follow different paths of development, some prevailing in some regions, others being prominent in other regions. For the quantitative analysis however one hypothesis is chosen for each driver and applies to all regions. When relevant, the same scenario is simulated using alternatively different hypotheses of change for one or two drivers. In such cases, the simulation results of the scenario variants may be interpreted as boundaries for that scenario as a whole. The variants of the different scenarios are described in Table 1 below.
Provided that the main specificities of the “Households” scenario are rather qualitative features (networks, mobility, multi-activity, plasticity, agility) which cannot be dealt with by GlobAgri-AgT, we do not provide quantitative results for this scenario.
The objective of this technical report is to present the main simulation results of each scenario. In the following, we report the simulation results of each scenario and its variants, starting with land-use change impacts, then describing some crucial production impacts and ending with trade impacts.
4
1.
“Metropolization”
The considered combination of drivers’ pathways involved in the “Metropolization” scenario is described in Figure 1.
5 Two variants are simulated:
- Transition to diets based on ultra-processed products (ultrap) involving strong increase in food consumption of vegetable oils, sugar and sweeteners and poultry meat;
- Transition to diets based on animal products (animp) involving strong increase in food consumption of animal products, particularly meat and especially in developing countries.
1.2. Land-use change impacts
Figure 2. World total agricultural land area (million ha)
Total agricultural area increases at the world level with the animp variant (+1.3 billion ha) but slightly decreases with the ultrap variant (-54 million ha). Hence one may notice the land-saving nature of the ultrap variant compared to the animp variant.
Figure 3. World cropland area (million ha)
Cropland area increases at the world level with both variants. Once again, the ultrap variant requires less cropland (+243 million ha) than the animp variant (+620 million ha). In both variants, India, The
6 Near and Middle East (NME), North Africa and West Africa are constrained by their maximum cultivable area. In these four regions, the pressures on cropland area are much stronger in the animp variant than in the ultrap variant.
Figure 4. World pastureland area (million ha)
The animp variant is very pastureland-using since it induced a huge increase in the world pastureland: +698 million ha. In contrast the ultrap variant is pastureland-saving: -297 million ha. Indeed, first the ultrap variant involves significantly lower increase in food consumption of animal products than the animp variant; second we assume a stronger substitution of poultry meat to ruminant meat in the ultrap variant. Both movements work together to limit the pastureland required at the world level with the ultrap variant relative to the animp variant.
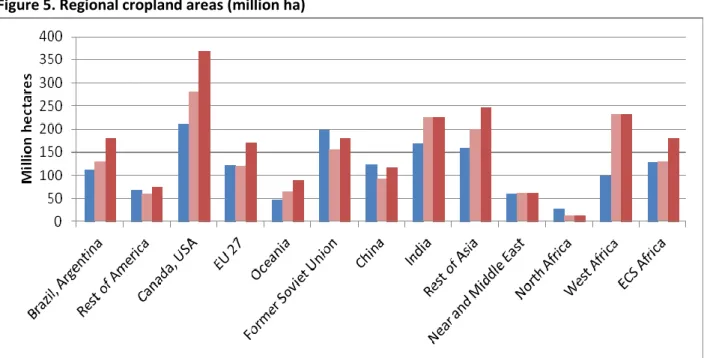
Figure 5. Regional cropland areas (million ha)
In both variants, cropland area increases in Brazil/Argentina and the USA/Canada, both world leading regions regarding the production of oilseeds (vegetable oils) and sugar plants as well as feed ingredients (maize and cakes) and meat, and in developing countries such as India, Rest of Asia, West
7 Africa and ECS Africa, all regions where involved changes in food diets joint with population increase induces a particularly strong rise in food consumption.
Figure 6. Regional pastureland areas (million ha)
Pastureland area decreases in nearly all regions with the ultrap variant, except in some developing regions such as Rest of Asia, ECS Africa and to a lesser extent West Africa, where even the diet based on ultra-processed food involves increased consumption of meat. Pastureland increases significantly with the animp variant in regions where either this variant induces a huge increase in meat consumption or a significant rise in exports (such as Brazil/Argentina and Oceania, where a non-negligible share of ruminant meat is produced by pastoral systems, which is less the case in Canada/USA and the EU 27 for example).
Figure 7. Forest area at the regional level (million ha)
The ultrap variant would allow to maintain the forest cover at the world level (+11 million ha). At reverse, the animp variant involves a so huge drop in the world forest cover (-1.3 billion ha) that this scenario is clearly unsustainable. With this variant the forest area decreases in nearly all regions,
8 including Brazil/Argentina, Canada/USA, EU 27, Oceania and Rest of Asia. But the strongest drop in forest area is experienced in West Africa where the whole forest area disappears and in ECS Africa where the forest area drops from 600 million ha in 2010 to 60 million ha in 2050.
Therefore, in these African regions, the only lever which could be used to limit deforestation in the “Metropolization” scenario with animal product-rich diets would be to increase the performance of livestock production systems, especially the ruminant ones.
1.2. Trade impacts
Figure 8. Net import dependence: (imports-exports)/domestic use
« Metropolization » is a scenario where world agricultural production concentrates on a few standardized agricultural products produced in a few most competitive regions. Hence in such a scenario, world trade must expand, the few producing regions increasing their exports to the other regions which become more and more depnedant on world markets for their food needs. According to our results, world trade (measured in calories) increases by +71% in the ultrap variant and +151% in the animp variant.
Figure 8. shows that both variants of “Metropolization” induce significant increase in world trade with main world exporting regions (Brazil/Argentina, Canada/USA and Oceania) consolidating their net export position and main importing regions becoming increasingly dependent on world markets (NME, North Africa, West Africa, ECS Africa). The net import dependence level of the NME and, above all, North Africa is particularly high in this scenario.
One may notice the huge increase in Indian net import dependence in the animp variant. Indeed, in this variant, India experiences a significant increase in food consumption, with a large share of meat, and reaches its maximum cultivable area. Hence India starts increasing to import both animal products and animal feed. Adjustments are similar in the ultrap variant but pressures on cropland are lower and the need to import is less.
9
2.
“Regionalization”
The considered combination of drivers’ pathways involved in the “Regionalization” scenario is described in Figure 9.
10 Two variants are simulated:
- Technology A involving the “Sustainable intensification” pathway for cropping systems and the “Conventional intensive livestock with local resources” pathway for livestock systems; - Technology B involving the “Agroecology” pathway for cropping systems and the
“Agroecological livestock” one for livestock systems.
Following our quantitative hypotheses, the performances of cropping systems in terms of per-hectare yields and of livestock systems in terms of global feed-to-output ratios are higher in the technology A variant than in the technology B variant. In other words for equal food needs, the technology A variant will requires less agricultural land than the technology B variant.
2.1. Land-use change impacts
Figure 10. World total agricultural land area (million ha)
Total agricultural area increases at the world level with the both variants:
- the global increase is lower than in the previous “Metropolization” scenario mainly because the “Regional” food diet involves less kcal per capita and per day; world agricultural land area expansion is nevertheless significant following the regionalization of food diets and food systems, the “sovereignity and subsidiarity” principle involved in this scenario leading regions with lower comparative advantages to rise their domestic production in order to fit with their domestic food needs, pushing up the total agricultural land required at the world level. - agricultural land required is much greater with the technology B variant than with the
technology A variant: +691 million ha vs. +249 million ha. This result illustrates the extent of the power of improved performances in agricultural production for saving land.
11
Figure 11. World cropland area (million ha)
Cropland area increases at the world level with both variants. Once again, the technology A variant requires less cropland (+70 million ha) than the technology B variant (+174 million ha). In both variants, the NME and North Africa are constrained by their maximum cultivable area. In the technology B variant only EU 27 becomes constrained by its maximum cultivable area. In other words, in case of regionalization of food diets and food systems, the EU 27 would have to reduce its agricultural exports in order to be able to feed its own domestic populations.
Figure 12. World pastureland area (million ha)
Once again the major share of agricultural land increase results from pastureland increase. Both variants are pastureland-using but the technology B variant (involving agroecology in both cropping and livestock systems) requires far more pastureland than the technology A variant: +517 million ha vs. +179 million ha.
12
Figure 13. Regional cropland areas (million ha)
In both variants, major cropland increases are in West Africa, India and the EU 27. In contrast, cropland decreases in Brazil/Argentina following mainly the decreased world consumption of vegetable oils for food and of oilseed cakes for feed, resulting in a significant decrease in the region’s production and exports of soybean seeds, oil and cakes.
Figure 14. Regional pastureland areas (million ha)
Most of the world pastureland increase arises in ECS Africa and West Africa. Pastureland is also increasing in North Africa and NME. For all these regions, the pastureland expansion is, at least partly, explained by the major role of small ruminant meat in traditional diets so in “Regional” diets for these regions. Small ruminant production systems are in general less efficient in transforming feed inputs into meat than poultry production systems. Furthermore their feed rations involved more grass. Both factors work to increase the required pastureland area in both regions. Pastureland area is also increasing in the EU 27. Once again, the change in shares of the different meats within
13 the meat group, which favours ruminant meat relative to poultry meat in “Regional” food diets in the EU 27 is one notable factor explaining the pastureland expansion in this region.
Figure 15. Forest area at the regional level (million ha)
The “Regionalization” scenario induces serious reduction in the world forest area: -347 million ha in the variant A and -768 million ha in the variant B. Once again this scenario appears as unsustainable for ECS Africa and West Africa, both regions experiencing serious cuts in their forest areas. This scenario would also raise difficulties for North Africa and India. Significant deforestation would arise in the EU 27 meaning that a regionalization of food diets and food systems in Europe would imply to reduce drastically EU exports in order to limit agricultural land area expansion.
Finally, our results show that the “Regionalization” scenario cannot be envisaged without drastic improvement of the performances of cropping and, above all, livestock systems in ECS Africa and West Africa. The discrepancy between the extent of deforestation in ECS Africa under the both agricultural technology variant A and B is particularly illuminating to this regard: +315 million ha with variant A vs. +562 million ha with variant B.
14
2.2. Trade impacts
Figure 16. Net import dependence: (imports-exports)/domestic use
“ Regionalization“ is a scenario involving a decrease in inter-regional trade. Hence, logically world agricultural trade reduces in this scenario: -15% in both variants depite the world population increase and the induced ris in world food consumption. However internatiional trade is far from disappearing and remains a key factoor in the world food security equation
Among the major world net exporting regions, Brazil/Argentina and canada/USA experience a deterioration in their net export position, their trade partner regions reducing their import needs of both animal products and feed ingredients. Oceania and the FSU maintain their net export position in this scenario. One important reason is the small ruminant meat effect linked to “Regional” diets in some region for Oceania and icreased wheat exports for the FSU.
The EU 27, China and the Rest of Asia become all nearly self-sufficient in the “Regionalization” scenario. In contrast to the previous “Metropolization” scenario, the “Regionalization” scenario allows West Africa and ECS Africa to stabilize or reduce their dependance to food imports, but at the cost of significant further deforestation. As far as the NME and North Africa are concerned, the regionalization of food diets and food systems involves by “Regionalization” would lead to increase their dependency on food imports. However the rise is lower than in the “Metropolization” scenario (whatever the ultrap or the animp variant).
15
3.
“Healthy”
The considered combination of drivers’ pathways involved in the “Healthy” scenario is described in Figure 17.
16 Two variants are simulated:
- Technology C involving the “Sustainable intensification” pathway for cropping systems and the “Agroecological livestock” pathway for livestock systems;
- Technology D involving the “Agroecology” pathway for cropping systems and the “Agroecological livestock” one for livestock systems.
Following our quantitative hypotheses, the performances of cropping systems in terms of per-hectare yields and of livestock systems in terms of global feed-to-output ratios are higher in the technology C variant than in the technology D variant. However the gap between technologies C and D is lower than the gap between previous technologies A and B since contrary to A and B, C and D use the same livestock systems development pathway. Therefore, between C and D only the hypotheses for the future of crop systems differ.
3.1. Land-use change impacts
Figure 18. World total agricultural land area (million ha)
Total agricultural area increases at the world level with the both variants:
- the global increase is nevertheless sharply lower than in the previous “Regionalization” scenario, mainly because the “Healthy” scenario does not limit inter-regional trade. Compared to “Regionalization”, “Healthy” also induces less kcal per capita and per day and less animal products in diets in developed and emerging regions but this is compensated by more kcal per capita and per day and slightly higher more animal products in diets in developing regions.
- agricultural land required is much greater with the technology D variant than with the technology C variant: +269 million ha vs. +29 million ha. The gap between the agricultural land required results only from the difference in their involved cropping systems pathway.
17 The gap remains important partly because the “Healthy” diets involved in this scenario relies less on animal products (at least in developed and emerging regions) and more on diversified crops. Hence the performances of cropping systems in terms of per-hectare yields are essential as regards the world agricultural land required by the “Healthy” scenario.
Finally, above results suggest that in face of significantly increasing world population, the “Healthy” scenario could be able to limit world agricultural land expansion.
Figure 19. World cropland area (million ha)
Cropland area decreases at the world level with the C variant (-56 million ha) but increases with the D variant (+50 million ha). In both variants, the NME and North Africa are constrained by their maximum cultivable land area. In both regions, tensions on cultivable land areas are stronger with the technology D than with the technology C.
18 Once again and even if the “Healthy” diets reduce the share of animal products in the average world diet between 2010 and 2050, a notable part of agricultural land increase results from pastureland increase (+85 million ha with variant C and +219 million ha with variant D). Once again, the pastureland expansion arises in developing regions where the change towards healthier diets involves a rise in the share of animal products in diets from 2010 to 2050. Such an increasing share of animal products compared to the initial situation is observed in West Africa, ECS Africa and India.
Figure 21. Regional cropland areas (million ha)
In both variants, major cropland increases are in West Africa and India. In contrast, cropland decreases or is stable in all other regions. The case of Brazil/Argentina, which experience a decrease in its cropland area is interesting since an important share of the agriculture of this region has been shaped to fit the needs of the food and nutritional transition arising all over the world: increased food consumption with rising share of animal products (particularly poultry meat), of vegetable oils and sugar and sweeteners. Following the “Healthy” scenario the world consumption of these products decreases significantly and Brazil/Argentina as one of the world leading producer of animal feed, vegetable oils and sugar cane must adapt its agriculture to the changing world food demand. This involves reducing its production of soybeans essentially and replacing it by other crops which are more demanded at the world level: fruits and vegetables and pulses mainly in “Healthy” diets.
19
Figure 22. Regional pastureland areas (million ha)
Most of the world pastureland increase arises in ECS Africa and West Africa. This is not surprising since for both regions, as already mentioned, the “Healthy” diet involves an increasing share of animal products compared to 2010. This is not the case in most of the other regions/
Figure 23. Forest area at the regional level (million ha)
Even the “Healthy” scenario induces some further deforestation at the world level. The extent of the reduction of the world forest area is however significantly lower in this scenario than in both previous ones: -63 million ha with the C variant and -279 million ha with the D variant. Most of this deforestation takes place in ECS Africa: -412 million ha in variant C and -464 million ha in variant D. In contrast, Canada/USA, FSU and China can expand their forest area with the “Healthy” scenario. Finally, our results show that the “Healthy” scenario is the less agricultural land-using compared to other Agrimonde-Terra’s scenarios. This is the only scenario allowing to feed in a healthy way the
20 growing world population while limiting agricultural land expansion and deforestation at the world level. However, even this scenario seems likely unsustainable for developing countries such as ECS Africa, West Africa and India, because of the dramatic population increase in these regions one the one hand and because change towards healthier diets involves increasing animal products consumption in these regions. This is clear from our results that a region such as ECS Africa could increase its imports instead of expanding its agricultural land area to the detriment of its forest area. In a certain extent, this would not result in further deforestation at the world level since some net exporting regions could expand their agricultural area without deforesting (Canada/USA notably). However, improving further the performances of agricultural production and especially of livestock systems in developing regions such as ECS Africa would certainly be a more efficient option in terms of saving agricultural land.
Furthermore, the “Healthy” scenario involves a “Stabilization of global warming” pathway requiring that all options for climate change mitigation are used. Deforestation works clearly against mitigation and there is a tension in the “Healthy” scenario between food security and climate mitigation objectives.
3.2. Trade impacts
Figure 24. Net import dependence: (imports-exports)/domestic use
International trade is increasing following the “Healthy” scenario: around + 30% compared to 2010 in both variants. One notable impact of the “Healthy” scenario is that this is with this scenario that North Africa is the less dependent on food imports in 2050. Among the major world net exporting regions, Brazil/Argentina just maintains its net export position in this scenario, but its soybean cakes exports are reduced by half, its soyabean oil exports experience a -30% decrease as do its sugar products exports. On the other hand, Brazil/Argentina increases its exports of the most demanded products on the world markets: fruits and vegetables and other cereals. At reverse FSU consolidates its net export position in the “Healthy” scenario. The main reason is that this region has some comparative advantages for wheat and other cereals. As change towards healthier diets involves increasing the share of cereals in diets, especially in developed and emerging regions, and rising the
21 share of other cereals within the cereal group, the “Healthy” scenario makes the FSU region better positioned on world markets than other scenarios.
4.
“Communities”
The considered combination of drivers’ pathways involved in the “Communities” scenario is described in Figure 25.
22 Two variants are simulated:
- Agroecology (AE) involving the “Agroecology” pathway for cropping systems and the “Agroecological livestock” pathway for livestock systems.
- Collapse (Collapse) involving the “Collapse” pathway for cropping systems nd the “Backyard livestock” one for livestock systems.
Following our quantitative hypotheses, the performances of cropping systems in terms of per-hectare yields and of livestock systems in terms of global feed-to-output ratios are higher in the AE variant than in the collapse variant. In the latter, per-hectare yields do not increase relative to 2010, but are affected by climate change (“Moderate warming” pathway) while feed-to-output ratios do not decrease relative to 2010. In other words, ”Communities with collapse” is the worst of our scenarios regarding the performances of agricultural production systems all over the world.
4.1. Land-use change impacts
Figure 26. World total agricultural land area (million ha)
Total agricultural area increases in both variants: +142 million ha in the AE variant and 2 billion ha in the collapse variant. Total agricultural area expands dramatically in the collapse variant and once again, this result illustrates perfectly well the extent of the power of increased agricultural production performances to save agricultural land.
The “Communities” scenario involves the “Regional” diets but with a -10% decrease in daily calories availability per capita in all regions except ECS Africa and India. Hence our results suggest that in face of a significantly increasing world population, the collapse variant would lead to dramatic consequences both in terms of food security and in terms of agricultural land expansion. The agricultural land expansion is much more limited in the AE variant, where the reduction in the daily calories availability and the shift to agroecology work together against the land-using impact of world population increase.
23 All in all, our results suggest that the world population growth makes it necessary to improve the performances of agricultural production systems (as measured by per-hectare yields and feed-to-output ratios) at least in some regions, for the world food needs can be met without dramatically expanding agricultural land area at the world level.
Figure 27. World cropland area (million ha)
Cropland area increases at the world level with both variants: +277 million ha with the AE variant and + 555 million ha with the collapse variant. Of course the collapse variant requires larger cropland area at the world level since facing the same food needs the collapse variant involves no increase in per-hectare yields compared to 2010 while the AE variant involves rising per-hectare yields. In both variants, the NME, North Africa and India are constrained by their maximum cultivable land area. In the collapse variant West Africa joins the group of constrained regions. In addition, tensions on cultivable land areas are much stronger in the collapse variant than in the AE variant.
24 The “Communities” scenario induces a reduction of the world pastureland area (-135 million ha) with the AE variant while the same scenario leads to a dramatic increase in the world pastureland area (+1.5 billion ha) with the collapse variant. One reason, but this remains a partial explanation, is the -10% decrease in daily calories availability in most regions which contribute to alleviate the rising consumption of animal products and thus the pastureland needs. But this first explanatory factor applies to both variants. In the AE variant this factor together with the improved performances of ruminant systems as involved in the “Agroecological livestock pathway” allows for limiting pastureland expansion at the world level. In the collapse variant this factor is largely over-balances by the unchanged feed-to-output ratios in all livestock sectors and systems.
Figure 29. Regional cropland areas (million ha)
In both variants, major cropland increases are in West Africa, India, ECS Africa and Canada/USA. Cropland also increases in both variants, but to a lesser extent, in Rest of Asia and Oceania. Obviously, also at the regional level, the extent of the cropland expansion is much higher in the collapse variant than in the AE variant.
25 Pastureland reduces in nearly all regions with the AE variant (exceptions are ECS Africa, the NME, North Africa and the EU 27). At reverse, pastureland expands in nearly all regions with the collapse variant. In this variant, pastureland expansion is particularly significant in ECS Africa, the FSU and Oceania.
Figure 31. Forest area at the regional level (million ha)
Within the “Communities” scenario, the AE is a variant which would allow to cope with world food needs while limiting agricultural land expansion and deforestation at the world level, in a very unfavourable global context. With this variant, the world forest area experience a -153 million ha reduction. In contrast, the collapse variant would induce dramatic deforestation in all regions.
26
4.2. Trade impacts
Figure 32. Net import dependence: (imports-exports)/domestic use
Despite the fragmented world involved in the global context of the “Communities” scenarios, our results suggest that international trade increase should increase in this scenario to fit the regional food needs: + 20% to +30% compared to 2010 according to the both variants.
5. Conclusion: the main limits of both the model and the quantitative analysis
The GlobAgri-AgT model is a biomass balance model. As such it suffers from several limits:- There is no price vector which as in usual economic model act as signals to both consumers and producers and give them incentives to change their plan according to the level of scarcity or abundance of resources. In such economic models, agricultural land expansion would have probably been more limited than in our analysis since price increases would have lead consumers to adjust their consumption, changing their diets towards cheaper products and probably revising down their animal products, especially meat consumption.
- There are a lot of rigidities in our model: no change in import and export patterns of regions unless when they reach their maximum cultivable land area; no substitution between products on the food demand side, but also within feed rations at the livestock production systems level and on the supply side.
Our results are sensitive to the way the model is solved in our analysis. Due to the lack of data on the maximum land area available to agriculture (involving both cropland and pastureland) in each region, we decided to put an upper limit on the cropland area only, letting the pastureland to adjust freely. Followingis lead to very large pastureland expansion et the world level and especially in some regions under some scenarios. In some cases, simulated pastureland expansion are clearly unreasonable.
27 Putting an upper limit on agricultural land would have avoided such situations. The question here is what kind of data should we use to estimate this upper limit by region.