HAL Id: tel-00929963
https://tel.archives-ouvertes.fr/tel-00929963
Submitted on 14 Jan 2014HAL is a multi-disciplinary open access
archive for the deposit and dissemination of sci-entific research documents, whether they are pub-lished or not. The documents may come from teaching and research institutions in France or abroad, or from public or private research centers.
L’archive ouverte pluridisciplinaire HAL, est destinée au dépôt et à la diffusion de documents scientifiques de niveau recherche, publiés ou non, émanant des établissements d’enseignement et de recherche français ou étrangers, des laboratoires publics ou privés.
Study of the Far Infrared Emission of Nearby Spiral
Galaxies
Willie Drouhet
To cite this version:
Willie Drouhet. Study of the Far Infrared Emission of Nearby Spiral Galaxies. Other [cond-mat.other]. Université Paris Sud - Paris XI, 2013. English. �NNT : 2013PA112257�. �tel-00929963�
Universit´
e Paris-Sud
Ecole Doctorale 127 :
Astronomie et astrophysique d’Ile-de-France
Laboratoire : CEA
Discipline : Astrophysique
Th`
ese de doctorat
Soutenue le 07/11/2013 par
Willie Drouhet
Etude de l’´
emission dans l’infrarouge lointain
des galaxies spirales proches
Directeur de th`ese : Marc Sauvage Directeur de recherche (CEA Saclay)
Composition du jury :
Rapporteurs : Maarten Baes Directeur de recherche (Universit´e de Gent)
Alessandro Boselli Directeur de recherche
(Laboratoire d’ Astrophysique de Marseille) Examinateurs : Alain Abergel Professeur (Institut d’ Astrophysique Spatiale)
Contents
Introduction 7
Formation of disk galaxies . . . 7
Before first disk galaxies formed ... . . 7
Inner galactic structures and the evolution of galaxy morphology in the early Universe ( z . 2 ). . . 11
Morphological classifications of galaxies in the local Universe . . . 14
Main properties of the de Vaucouleurs classification . . . 15
NIR morphologies . . . 16
Disk galaxies in local universe . . . 17
Gas content and structures . . . 17
Stellar content and structures . . . 19
Metallicity . . . 27
Dust emission, content and structures in disk galaxies . . . 28
Main dust contributors according to wavelength ranges . . . 28
Dust heating regimes and structures observable in IR galaxy maps . . . 29
Dust role in star formation . . . 32
Dust production and distribution of mass . . . 34
Central questions driving my thesis work . . . 39
The goals and the sample . . . 40
The method . . . 40
Layout of the thesis . . . 41
Foreword . . . 41
1 Evidencing dust disks 43 1.1 Extraction of the background sky signal . . . 43
1.2 Region of interest around each galaxy . . . 44
1.3 Isophote extraction . . . 45
1.4 Disk orientation extraction and distance between ellipses . . . 46
1.4.1 Azimuthal integral of absolute value of the difference in square radii . . . 49
1.4.2 Radial integral of circular arc length between each ellipse side . . . 54
1.4.3 Distance (D) between two ellipses of same semi-major axis and same center 57 1.4.4 Qualitative examination of the variations of D for all couples of ellipses . 58 1.4.5 Ellipse neighbours to one specific ellipse, at a fixed value of the discrep-ancy D. . . 60
1.5 Difference of disk orientations . . . 67
1.6 Method for extracting consistent disk orientation . . . 69
1.6.1 Isophote selection . . . 69
1.6.4 Comparing disk orientation in different band maps for each object . . . . 85
1.6.5 Properties of CDO sample . . . 85
1.6.6 Comparison between extended disk orientations and litterature orientations 91 1.7 Conclusion on disk orientations . . . 93
2 Study of dust physical properties vis a vis stellar content in Kingfish 97 2.1 Far-infrared modelisation . . . 97
2.2 From 2D-maps to radial profile of SEDs . . . 100
2.3 Results of the SED fitting . . . 102
2.4 Links between ISRF, stellar mass and dust mass . . . 110
2.4.1 Power intercepted by dust . . . 112
2.4.2 Densities of power in various wavelength domains . . . 114
2.5 Stellar luminosity and stellar mass . . . 115
2.6 Links between emission at different wavelengths and power intercepted by dust . 115 2.7 Power intercepted by dust against stellar surface density of power . . . 121
2.8 Dust and stellar surface density . . . 127
2.8.1 The Sersic profile . . . 127
2.8.2 Size, shape and central level of surface density for stars and dust . . . 128
2.8.3 Half mass radius and Sersic index . . . 134
2.8.4 Maximum surface densities of stars and dust . . . 137
2.9 Conclusion on our study of cosmic dust and stellar galactic content . . . 138
3 Summary and Perpectives 145 4 APPENDICES 149 4.1 Notations . . . 149
4.2 Abbreviations . . . 149
4.3 Derivation of expressions for the discrepancy Dinteg between 2 ellipses with same center and same semi-major axis . . . 150
4.4 Why Ir does not change when |∆P A| = 90◦, max(e1, e2) is fixed and min(e1, e2) varies. . . 151
4.5 Two other notions of distance for ellipses of same center and same semi-major axis151 4.5.1 Spherical distances . . . 153
4.5.2 Flat distances . . . 153
4.5.3 Maps of distances . . . 154 4.6 Stellar mass against: dust heating field, dust intercepted starlight and dust mass. 159
About this thesis, research, dust and galaxies...
The way I pass never yet was run - Dante - Divine Comedy
We are all very ignorant, but not all ignorant of the same things - Albert Einstein Quand le danger nous semble l´eger il cesse de l’ˆetre - Francis bacon
Is it not careless to become too local when there are [hundreds of] billions of stars in our galaxy alone - A. R. Ammons
Dusting is a good example of the futility of trying to put things right. As soon as you dust, the fact of your next dusting has already been established - George Carlin
Men think highly of those who rise rapidly in the world; whereas nothing rises quicker than dust, straw, and feathers - Lord Byron
Your idol is shattered in the dust to prove that God’s dust is greater than your idol -
Ra-bindranath Tagore
I’m not a prophet, but I always thought it was natural for dictatorships to fall. I remember in 1989, two months before the fall of the Berlin Wall, had you said it was going to happen no one would have believed you. The system seemed powerful and unbreakable. Suddenly overnight it blew away like dust - Salman Rushdie
I consider the positions of kings and rulers as that of dust motes. I observe treasures of gold and gems as so many bricks and pebbles. I look upon the finest silken robes as tattered rags. I see myriad worlds of the universe as small seeds of fruit, and the greatest lake on Earth as a drop of oil on my foot - Buddha
Mourning is not forgetting... It is an undoing. Every minute tie has to be untied and some-thing permanent and valuable recovered and assimilated from the dust - Margery Allingham
Introduction
In this thesis we will mainly focus on the stellar emission and interstellar dust emission of nearby disk galaxies.
However we will first highlight a few processes known to have occured during the formation of these objects so as to clarify how these processes are related to the presently observed physical content and morphological aspects of disk galaxies. In the following section we will do so by discussing successively the main stages of disk galaxy formation.
We will in a subsequent section elaborate upon the morphology of galaxies in the nearby universe in the optical and the near infrared (NIR). We will thereafter confine our study to disk galaxies and discuss their gaseous and stellar content. We will then detail the links between these latter phases and the dust phase inside these galaxies, while also reviewing structures observed in the dust phase and the dust emission.
After this detailed introduction on the context of this thesis, we will state a few central issues this work specifically adresses, then explicit the galaxy sample we will study and why we chose to study it. At this point we will give the layout of this work and explain in more details the spirit in which it was drawn up.
Formation of disk galaxies
Before first disk galaxies formed ...
Since the Big Bang, matter concentrated under gravity to form aggregates named stars as well as huge assemblies of stars, gas and dust that we name galaxies. We will now catch the main steps of these processes.
At present, it is common knowledge that the farthest celestial phenomenon whose light can be detected is the Cosmic Microwave Background (CMB).
This is the testimony to ages approximately 13.79 billion years ago (as found by Planck Collaboration, 2013b) roughly 378,000 years after the Big Bang (at redshift1z = 1090.51 ±0.95, see Hinshaw et al., 2009 ), when our universe was much hotter (∼ 3000 K) and homogeneous than today. This prompts the question of how did the Universe became as inhomogenous as it is seen today on the galactic scales? The CMB is a signature of the universe going from an opaque plasma to a neutral transparent gas. At this epoch long after Big Bang baryogenesis and nucleosynthesis (see Steigman, 2007), the universe already has a visible matter content dominated by hydrogen and helium in proportions very close to the one it harbours at present. Although already created, visible matter was not substantially gathered together. Before this happened to be the case, the universe first expanded and cooled. One of the main components
1We assume standard cosmology with H
of the mass-energy budget of the universe, namely dark matter, condensated into significantly large and dense clumps under the gravitational influence of previously existing but tiny inho-mogeneities (see van der Kruit and Freeman, 2011). These clumps in turn relaxed to virial equilibrium, their angular momentum having been acquired from cosmological torques (see Dutton, 2009 and Governato et al., 2012).
Only then these clumps gravitationally attracted visible matter, as well as more dark matter. The currently observed distribution of specific angular momentum (angular momentum per unit mass) of disk galaxies suggest very specific formation scenarios (although uncertainties remain, see Dutton and van den Bosch, 2012). Namely, the infalling gas is traditionnally deemed to have been shock-heated (see Wang and Abel, 2008) to the dark halo virial temperature, even though some studies showed the important role played by “cold-mode” filamentary gaseous infalls for which shock-heating is less efficient (see Stewart et al., 2013, Dubois et al., 2012). In the shock-heating scenario the distribution of specific angular momentum assumed to be first acquired by baryons, after shock-heating is the same as that of the pre-existing dark matter halo. As brought forward by Dalcanton et al. (1997), Mestel et al. (1963) showed that the angular momentum distribution of a galactic disk is very similar to that of a sphere in solid body rotation. Thus it was then assumed that the collapse of a uniformly rotating gaseous protogalaxy was a good model for disk formation. As explained in Kaufmann et al. (2006), to obtain the observed exponential decrease of stellar density with radius, very little angular momentum transport is expected to have occured in the gas while it was collapsing inside dark halos. It is also expected that the angular momentum is responsible for eventually halting the collapse and that dark halos originally have a radial density profile such that the observed rotation velocity profile of disks are mainly flat at large distances from the center (see Dalcanton et al., 1997).
The gas then necessarily cooled radiatively from inside out as shown by the bluer colors of outer regions of disk galaxies (see Wang et al., 2011) as well as their decreasing dust content with increasing galacto-centric radius (see Mu˜noz-Mateos, 2012).
Thereafter, the relative timing of disk formation with respect to the first main star formation episodes is constrained by the dynamics of disk galaxies. More precisely as explained by van der Kruit and Freeman (2011), and because stellar content is mainly non dissipative, the observation of disks close to centrifugal equilibrium entails that disks formed before the onset of the main star formation episode.
Two other characteristics of disk galaxies, their prevalence and fragility, shed light on their subsequent growing process. For instance, as galactic disks are as well very easily “puffed up” by mergers (see van der Kruit and Freeman, 2011) and ubiquitously observed, they are thought to be alternatively destroyed by mergers and reformed by gas accretion. This process is thought to have occured from the very early times. Furthermore if disks are destroyed/thickened during mergers, as the majority of stellar mass resides in disks in the local Universe, the dominant galaxy formation mechanism that leads to galaxies currently observed cannot be merger driven, and is rather, presumably, the more quiescent process of cold gas accretion (see Driver et al., 2013).
Once the first disks were formed, the gas they contained condensed to much higher densities (see Naoz et al., 2008) and formed stars quiescently.
In finer details, star formation occured at different paces in different environments. For example, most intense star forming episodes occured in smaller systems as cosmic time went by. But the formation of small scale high-density structures such as stars has to be distinguished from the build-up of structures as large as or larger than galaxies. On these larger scales, smaller
agregates of matter, e.g. galaxies, appeared first before gravity and mass acquisition resulted in production of larger ones (see Searle and Zinn, 1978).
It was shown that the first generation of stars had specific consequences on galaxy formation processes and evolution. The CMB temperature had to decrease to lower than 60 K (z < 20) before the first stellar objects, preferentially massive fast-spinning stars (see Chiappini et al., 2011; Jaskot and Oey, 2013), forming between 150 million and one billion years after the Big Bang (see for instance Becker et al., 2001; Bond et al., 2013), very probably caused reionization of interstellar and intergalactic medium (see figure 1 for a schematic view of reionization; Bovill and Ricotti, 2009, Morales and Wyithe, 2010 for details about reionization; McKee and Ostriker, 2007 for star formation processes). Reionization is expected to have had a significant regulatory role in galaxy formation for instance by impeding gas cooling (see Dutton, 2009) notably in dwarf galaxies.
It can be noted here that galaxy formation and evolution in the early universe is peculiar (see Bovill and Ricotti, 2009) because of the lack of efficient cooling elements (C, O, etc.) and the small sizes of dark matter halos. Cooling elements have been shown to be crucial to star forming processes in local galaxies because more cooling elements could enable gas clouds to cool more quickly therefore enhancing their capability to contract and form stars. Without such elements, stellar feedback on molecular gas creation occuring in pre-reionization era was shown to be strongly different from molecular gas creation processes in local galaxies.
Figure 1: A picture illustrating the cosmic reionization taken from Robertson et al. (2010). The transition from the neutral intergalactic medium (IGM) left after CMB emission, to the fully ionized IGM observed today is named cosmic reionization. Hydrogen in the IGM remained neu-tral until the first stars and galaxies formed at z ∼ 15 − 30. These primordial systems released energetic ultraviolet photons capable of ionizing local bubbles of hydrogen gas. As the abun-dance of these early galaxies increased, the bubbles increasingly overlapped and progressively larger volumes became ionized. This reionization process completed at z ∼ 6−8, approximately 1 Gyr after the Big Bang. At lower redshifts, the IGM remains highly ionized through radiation provided by star-forming galaxies and gas accretion onto supermassive black holes that power quasars.
Very generally, most galaxies earlier than 3 billion years after the Big Bang (z ≥ 2 − 3) are peculiar (see Jiang et al., 2013). These peculiarities along with the early fragmentation of disks into giant clumps, as observed before 3 billion years after the Big Bang ( z ≥ 2 ), could be due to turbulence created by local accretion of metal-poor gas in clumpy streams penetrating deep onto the galaxy following the potential well (see Mannucci and Cresci, 2010). These streams would also explain the giant clumps being sites of efficient star formation. In turn these clumps could possibly be the progenitors of the central spheroids observed to appear later on in galaxies.
Galaxies observed in later cosmic times point to the prototypical instability of early disks, which can be compared to the known marginal stability of presently observed disks (see van der Kruit and Freeman, 2011). For instance, most galaxies less than 4.3 billion years after the Big Bang ( z = 1.5 −3.6 ) were found by Law et al. (2012a) to exhibit small, clumpy aspects and tri-axial structures, with high gas fractions and velocity dispersion, thus still differing strongly from galaxies observed in the recent and local universe (even though this difference was rendered a little less striking by the observation of already exponential surface brightness profiles in these galaxies extending out to more than 6 × re, with effective radii re ≈ 0.7 − 3 kpc ). These
authors interpreted their findings as at least proving a markedly asymmetric distribution of stellar mass in these early objects. They further suggested these galaxies are not in stable dynamical equilibrium but on the contrary exhibit short-lived gas disks, continually forming and reforming from recently accreted gas until stabilized. But, before the establishment of the disk, outflowing gas at high velocities and large distances from galactic centers may have arisen (see Law et al., 2012b).
These outflows proved important for the creation of the more recent and more neatly-organized thin rotating disks. They were possibly created by feedback from low to intermediate mass stars or AGN in early clumpy objects, and probably provided galaxies with the ability to dissipate energy, e.g. from velocity dispersion of infalling gas, on timescales smaller than the galactic free fall timescale, thus precluding excessive bulge formation (see Driver et al., 2013).
It was reported by Law et al. (2012b) that at least some star-forming galaxies between 2 and 3 billion years after the Big Bang (z ∼ 2 − 3) were transiting from clumpy irregular systems to more regular (albeit thick) disks (see van der Kruit and Freeman, 2011 for thick disk formation scenarios).
Furthermore, Labb´e et al. (2003) detected disk-like galaxies between 2 and 4.5 billion years after the Big Bang (1.4 < z < 3.0), whereas the most ancient galactic spiral structure has been reported inside a galaxy’s thick disk by Law et al. (2012c) 3.01 billion years after the Big Bang (z = 2.18) although this spiral structure may have arisen from a minor merger and not from galactic secular evolution.
Furthermore, the long standing rule of exponentially decreasing surface density of stars with increasing galacto-centric radius in the inner regions of galactic disks has been shown to fail at larger radii where localised changes in exponential slope, named breaks, are observed (see Pohlen and Trujillo, 2006, and references therein). These breaks were interpreted as hinting at precise properties of disk dynamics and/or star forming processes. It was reported by Roskar et al. (2008) that disk breaks have been observed in the distant universe as soon as 6 billion years after the Big Bang (out to z ∼ 1), implying that they are a generic feature of disk formation. Several theories for the formation of downward-bending breaks have been suggested. The most common interpretations include angular momentum-limited collapse, star formation threshold either due to a critical gas density or the lack of a cool equilibrium in the interstellar medium (ISM) phase. Alternatively, breaks have also been attributed to angular momentum redistribution. They are now also thought to be strongly linked with radial migration of stellar material.
Besides, it is expected that star formation had a strong impact through supernovae (SN) feedback on shaping galactic disks either in the recent and earlier Universe. More precisely (see Dutton, 2009, Governato et al., 2012) the role of energy driven outflows due to SN is crucial and already closely related to the formation, in the context of ΛCDM cosmology, of exponential disks and galactic breaks observed in the local Universe. Especially models with momentum driven outflows or no outflow at all are shown to overpredict sersic index for low mass galaxies, thus these models are not efficient enough at removing mass from low mass galaxies.
Although these results proved the fundamental role of outflows in shaping disk galaxies, taking place after the main first star formation episodes, Dutton (2009) showed that, even with outflows taken into account, no universal exponential density profile emerges for stellar content in disk galaxies, especially at small radii. This bolsters deeper analysis of stellar profiles close to galactic centers, thus probing bulges and connections between disks and bulges.
Inner galactic structures and the evolution of galaxy morphology in the early Universe ( z . 2 )
The prominent inner structures of disk galaxies are already under close scrutiny and their formation are on the process of being elucidated. As explained by Driver et al. (2013), early epochs saw the rise of Active Galactic Nuclei (AGN) activity which is almost always coincident with massive star formation episodes and also directly linked to the formation and growth of the associated super-massive black holes (SMBH). Galactic center evolution, including AGN and SMBH activities, are strongly expected to interact with galactic bars. For instance bars, through tidal torques and shocks, induce substantial mass transfer towards these circumnuclear regions probably causing early star formation episodes inside them (see Roussel et al., 2001a). It is interesting to note here that early Universe studies of galaxies are biased, because of redshift, against detection of bars (see Eskridge et al., 2000) as bars are increasingly difficult to detect at bluer rest wavelengths. This bias is likely to hinder future research on the formation of the inner parts of galactic disks. The effects of bars in the form of spiral-bar resonance (see Minchev et al., 2010) or galaxy evolution and morphology (see Masters et al., 2010a) are indeed very complex and important subjects, though they are not the main focus of this thesis.
SMBH were in turn linked to spheroid formation via the well established SMBH-bulge relations (see Gebhardt et al., 2000, Ferrarese and Merritt, 2000). Moreover, as recently found by Debattista et al. (2013) this relation also implies that as disks formed and reformed through accretion around bulges, these disks compressed bulges, inducing a pronounced SMBH growth. This shows a substantial growth of SMBH along with disks. The compression of bulges by disks is a natural explanation of de Jong (1995b) finding that bulge and disk scalelengths were correlated (see for more details).
Conflicting claims have been made concerning the link between spheroid galaxies and bulges of disk galaxies. For instance, studies of the very rapid evolution of galaxy sizes have argued that the compact elliptical systems seen between 2.6 and 4.5 billion years after the Big Bang (1.4 < z < 2.5) might represent the naked bulges of present day spiral systems (see Driver et al., 2013). This could possibly link early type galaxies observed in the distant Universe to modern times disk galaxies. Though as such a link would predict projected axis ratios (minor axis over major axis) to decrease on average when spheroids acquire disks, as cosmic time passes, along with a possible increase in mass, such a prediction seems dubious with regards to figure 7 of Chang et al. (2012) (see figure 2) at least for galaxies more massive than log(M⋆/M⊙) ∼ 10.7.
We see on this figure that in similar bin of mass, the average projected axis ratio varies modestly or increases when time passes. Thus it seems reasonable to conclude that massive elliptical galaxies, mainly become rounder when ageing.
Chang et al. (2012) found that early type galaxies were on average flatter before 6 billion years after the Big Bang (z = 1), thus proving an increased disk-like aspect of massive early type galaxies before this cosmic time (see also Bruce et al., 2012). Many early type galaxies of this early epoch were found by these authors to host pronounced disks. Furthermore they showed that the median projected axis ratio (minor axis over major axis) at a fixed mass decreases with redshift. It suggests that all early types more massive than log(M⋆/M⊙) ∼ 10.7 gradually and
Figure 2: Fig. 7 of Chang et al. (2012). On this figure are shown the projected axis ratio versus stellar mass for their early-type galaxy sample, split into three redshift bins. The symbols are K-band images of the galaxies. The lines represent running median values of the axis ratio. Up to the highest redshift bin, the most massive galaxies appear to be the roundest and overall the galaxies in the highest redshift bins are also flatter than their lower-redshift counterparts.
than 3 billion years after the Big Bang (z ≤ 2) are the roundest with a pronounced lack of galaxies that are flat in projection. They interpreted this result as a hint towards a universal ceiling mass for the formation of disks independent of cosmic epoch.
The study of early Universe galaxies also hinted at different chronologies for the emergence of massive disks and massive spheroids as well as an evolution of disk galaxy morphology. To substantiate this we can refer to Elmegreen et al. (2005, fig 7) showing that the typical shapes of the brightest elliptical galaxies have probably been produced earlier than roughly 5 billion years after the Big Bang2. These authors showed that disk galaxies of these ancient times are 2 or 3 times thicker than they are now. This further implies that the settling of visible matter in thin galactic disks as observed today probably operated on much longer timescale than the time necessary for building up shapes of large elliptical galaxies. Thus the observed disk more than likely shifts with time from thick disks for ancient disk galaxies to thin disks for more local disk galaxies (see also van der Kruit and Freeman, 2011).
The dichotomy of forming galactic disks through accretion and spheroids through mergers was recently questioned by Sales et al. (2012) studying galaxy simulations. These authors sug-gested that disk dominated objects are made of stars formed predominantly in situ by baryons mostly accreted late from a hot corona. Baryons forming disks have coherent spin alignment, producing less than 5% of counter rotating stars. On the other hand, direct filamentary accre-tion of cold gas, especially when accompanied by substantial spin misalignments, favours the formation of slowly rotating spheroids. The less massive spheroid may thus form even in the absence of mergers. This kind of spheroid formation could be confirmed or falsified by the ob-servable imprint it is likely to leave in galactic spheroids, namely overlapping stellar populations of distinct age, kinematics and, possibly, metallicity.
This morphological separation between disks and spheroids may also evolve with cosmic times, as Driver et al. (2013) reported a transition epoch 4 billion years after the Big Bang (z = 1.7) from galactic spheroid formation, growth via mergers and/or collapse called “hot mode evolution” to disk formation, growth via gas infall and minor mergers called “cold mode evolution”. This transition is in agreement with the findings of Sales et al. (2012).
This evolution should have taken place simultaneously with the hierarchical build-up of large scale structures. For instance from the Big Bang on, the merging rate of galaxies is first increasing with cosmic time then decreasing (see Kitzbichler and White, 2008). This maximum of merging rate occurs later when one increases the lower stellar mass of the two merging galaxies. The value of this maximum merging rate is also decreasing with increasing stellar masses. The slowing pace of mergers is connected to the emergence of more and more coherent structures in the universe. An illustration of this point is the decreasing fraction of irregular galaxies from ∼ 30 %, 6 Gyr after the Big Bang (z ∼ 1), to less than 10%, 9 Gyr after the Big Bang (z ∼ 0.4) and 5% in the local universe (z ∼ 0; see Abraham and van den Bergh, 2001). These authors thus claimed that earlier than 6 Gyr after the Big Bang 30% of galaxies are sufficiently peculiar for galactic morphological typology defined through minute examination of nearby galaxies (such as the Hubble tuning fork, see section ) to be of no avail.
This morphological evolution was probably accompanied by a strong evolution of galaxy properties towards enhanced far infrared (FIR) output in the past (see Dole et al., 2008) as the cosmic infrared background (CIB), mainly emitted by galaxies 6 billion years after the Big Bang (z ∼ 1), accounts for roughly half of the total energy in the optical/infrared extra-galactic background light (EBL), whereas locally the infrared output of galaxies is only a third of the optical one. This was probably due to early dust production, itself enabled by the early increase of galactic metallicities, as previously noted.
Although much later in cosmic time, systematic deviations from nearby universe morpho-logical typology are already present in the Universe observed 3.5 billion years ago (z = 0.3; see Abraham and van den Bergh, 2001). Even as soon as 1 billion years ago (z ≥ 0.1) galaxies are less well developed and their structures are more disturbed in the optical and rest frame-UV than local galaxies (see Jiang et al., 2013).
Morphological classifications of galaxies in the local Universe
In cosmic times more recent than 1 Gyr ago, galaxies fit well in the morphological classifications defined from studies of local galaxies e.g. the Hubble tuning fork (see figure 3).
Figure 3: Diagram of the Hubble sequence.
This classification built by Hubble (1926) defines three main galaxy types: spiral, elliptical and irregular, with irregular objects amounting for only 3% of present-day galaxies. Spirals were subdivided by Hubble (1926) in barred and non-barred types depending on whether they presented “a bar of nebulosity [extending] diametrically across the nucleus. In these spirals, the arms spring abruptly from the end of this bar”. Another subclassification was added subdividing further barred and non-barred spirals into late, intermediary and early types. Contrary to the usual temporal meaning of these adjectives, they here only refer to a progression from simple (early) to complex (late) observed structural forms comprising “ a progression in nuclear luminosity, surface brightness, degree of flattening, major diameters, resolution and complexity”. A widely used extension to the Hubble sequence is the de Vaucouleurs classification (see table 1, de Vaucouleurs, 1959, de Vaucouleurs et al., 1976, de Vaucouleurs et al., 1991). In its present form the de Vaucouleurs classification uses a three coordinate system (stage s, family f, variety v), the three of which are mutually orthogonal, i.e. independant. The stage s is very similar to but more precise than the Hubble type, and mainly correlated with global luminosity. The main morphological stages are gE: giant ellipticals, L: lenticular galaxies, S: spiral galaxies, Im: irregular galaxies. Disk galaxies are more finely classified as spiral galaxies or lenticular galaxies. Spiral galaxies are disk galaxies within which spiral arms and substantial star forming activity are observed, whereas lenticular galaxies are disk galaxies within which no spiral arms nor star forming activity can be found. The main causes of this star formation quenching in lenticulars are gas stripping and gas exhaustion (see van der Kruit and Freeman, 2011). Spiral, lenticular and elliptical galaxies are the majority of luminous nearby galaxies (see Jiang et al., 2013).
Family f (ordinary A, barred B, transition AB) is also close to but finer than the Hubble barred or non-barred type. Variety v (spiral-shaped s, ring shaped r, transition rs) concerns inner structural details other than the bar.
Main properties of the de Vaucouleurs classification
We here review fundamental trends observed between physical properties and de Vaucouleurs morphological classification.
Along with de Vaucouleurs et al. (1991) and Simien and de Vaucouleurs (1986) we define LT the total luminosity of the galaxy. These authors fitted on the central region of azimuthally
averaged surface brightness radial profile of galaxies, Sg(r), seen as functions of the galacto
centric radius r, a specific model named “r1/4”, defined such that Smodel(r) ∝ r1/4. They
computed the integrated luminosity of this latter pure r1/4spheroid component, quantifying the bulge luminosity and noted Lbul. The difference of r1/4and total component B-band magnitude,
itself due to the presence of a disk, is a measure of the total-to-bulge ratio, noted ∆mtot−to−bul.
The quantity ∆mtot−to−bul = 2.5 log (LT/Lbul) is increasing with stage from 0 − 0.5 for giant
ellipticals (gE), to > 5 for (Sdm). This trend mainly marks the growing importance of the disk component, from inexistent (gE), to prominent (Sdm) when one considers later type galaxies. We emphasize that for types as late as or later than Sc the bulge components are relatively weak as compared to their disk counterpart. This total-to-bulge ratio is not calculated for the remaining (Sm) and (Im) types which are too irregular to yield meaningful measurements.
For positive stage types, difference of the 21 cm and B-band magnitudes (see de Vaucouleurs et al., 1991, or equation (13), tables 12, 13, 14 of Buta, 1994), both corrected for extinction and self absorption, decreases with type from 2.63 (S0/a) to 0.59 (Im). So for same B-band magnitude there is more atomic gas in later types. Such comparison holds as long as the stage type is positive.
The concentration index is defined as the ratio of diameters of circular apertures transmitting 3/4 to 1/4 of the B-band flux of the galaxy. The logarithm of the concentration index decreases with type from 0.8 (gE) to 0.435 (Im), thus showing that later types are less concentrated than earlier types.
The mean effective B-band surface brightness, i.e. the mean surface brightness inside the ef-fective aperture (the circular aperture enclosing one-half of the total flux), corrected for galactic and internal extinction, and to face-on orientation has a minimum for stage type 0 (S0/a) and 1 (Sa) and a maximum for stage type 10 (Im). Therefore, except for stage types less than 0 (early types), later stage types have lower average surface brightnesses. This trend links morpholog-ical appearances (types) to the history of these objects as it was shown by MacArthur et al. (2004) that stellar surface density, on which B-band measurements strongly depend, is a more fundamental parameter than total stellar mass to determine star formation history, especially recent one.
These authors further demonstrated the role of local galactic potential in shaping galactic interstellar medium (ISM) properties. More precisely they showed in a combined optical and NIR study of nearby positive morphological type galaxies, that locally, inside each galaxy, regions having higher surface brightnesses in the optical and NIR are also older and have higher metallicities.
They also explored the global galactic potential, and deduced that age and to a lesser extent, metallicity gradients show radial structures, with steeper gradients in inner galactic regions.
Comparing galaxies in their sample, they found that the trends linking stellar history and galactic matter composition vary with dynamical and morphological properties. More precisely the age and metallicity they measured at one scalelength in K band (2.2µm) increase with earlier
de Vaucouleurs class gE L S0/a Sa Sab Sb Sbc Sc Scd Sd Sdm Sm Im
Hubble stage type -5 -2 0 1 2 3 4 5 6 7 8 9 10
Table 1: De Vaucouleurs Classification of stages as presented on NED website. From left to right we have giant ellipticals (gE), lenticular (L), spirals (S) and irregular galactic objects (Im). Hubble type, higher luminosity, larger rotational velocity and higher central surface brightness. They concluded that higher surface brightness regions of galaxies probably formed their stars earlier than lower surface brightness regions, or at a similar epoch but on shorter timescales, and the SFHs at a given surface brightness (SB) level, which lead to age radial gradients, are modulated by the overall potential of the galaxy such that at fixed mass, brighter/higher rota-tional velocity galaxies formed earlier. These authors also invoked stellar feedback as possibly impeding star formation in low mass systems, thus making their conclusions not contradictory with more massive galaxies forming later. The trends reported above reach saturation for the brightest and highest central surface brightness galaxies.
Moreover, either older stellar populations or higher metallicities may create redder galactic colors. These two are mostly degenerate in observed optical colors of unresolved stellar popula-tions. Dust extinction possibly produced by more metal rich environments is only a secondary contributor to such color gradients (see MacArthur et al., 2004), at least in optical and NIR colors.
As can be expected from the arguments shown above, globally determined galactic colors also change with morphological types, as later types have bluer colors. More precisely the effective color indices corrected for galactic and internal extinction between U and B as well as B and V bands show systematic trend from early type being reddish objects to late types being bluer objects.
NIR morphologies
In this subsection we will review some important morphological trends observed by shifting wavelengths from optical to near infrared (NIR).
Buta et al. (2010b) found that on average, at 3.6µm, morphologies are very close to blue light (λ ∼ 445 nm) morphologies, with only the most dusty galaxies exhibiting drastic mor-phological differences between the two wavelengths (see also Jarrett et al., 2003). Systematical morphological differences between the two wavelengths seem consistent on average with S0/a to Sc galaxies appearing of earlier type at 3.6µm than in blue light. This is caused by a slightly increased prominence of the bulge, the reduced effects of extinction in the NIR, and the reduced (but not completely eliminated) effect of the extreme population I stellar component3. Popu-lation I stars include most recently formed stars and thus massive and scarce short-lived stars. For instance those stars bias direct estimates of stellar mass from blue light toward lower values as massive stars represent only a tiny fraction of galactic stellar masses. This is one of the main interests of studying galaxy morphology in the NIR instead of in the optical.
The increased weight of the bulge in NIR as compared to optical is readily explained by redder colors of the bulge as compared to the disk (as seen on figure 8 of MacArthur et al., 2004). This difference could be due to dust extinction, though as previously stated, this is currently seen as a parameter of lesser importance than age and metallicity to explain color gradient inside galaxies.
Another important yield of recent morphological studies in the NIR is the observation that 3
Population I stars are the most recent stellar generation as opposed to population II (intermediate) and population III (oldest, still hypothetical, and very metal poor).
approximately half of all massive disk galaxies contain bars. The fraction of strong bars increases twofold, from 30% in the optical, to 60% in dust-penetrating NIR wavelengths, while the total bar fraction does so by up to 35%, either when bar detection is carried out through visual classification or via quantitative methods (see S´anchez-Janssen and Gadotti, 2012).
It was also recently found in NIR bands that (S0) lenticular galaxies had on average weaker bars than spirals, even compared to their closest spiral counterpart S0/a (see Buta et al., 2010a). This was interpreted as a possible continuing evolution of bars proceeding during and after gas depletion.
It is also known that spiral structure which may appear “flocculent” in blue light and I band (at 0.8µm), can appear more global (i.e. continuous and large-scale, or “grand design”) in K band (at 2.2µm; see Buta et al., 2010b).
Disk galaxies in local universe
From a general point of view, the vast majority of galaxies of the local Universe can be described as consisting of a compact smooth spheroidal component containing a predominantly pressure-supported old high-metallicity stellar population, and/or an extended flattened star-forming disk component containing intermediate-age and young stars with a wide range in metallicities, having smooth rotation and embedded in an extensive gaseous cold gas disk (see Driver et al., 2013).
More precisely, 70% percent of galaxies in the nearby Universe exhibit prominent spiral arms inside a disk (see D’Onghia et al., 2013). Chang et al. (2012) also noted that all but the most massive galaxies in the present day Universe have disk-like structures and are rotating.
These arguments make studies of spiral galaxies and more generally disk galaxies fundamen-tal for understanding the local Universe.
We will now focus more particularly on disk galaxies and discuss the main properties of these objects. We will successively describe the main observed structures of these objects in their gaseous, stellar and dust phases as well as important links between these components.
Gas content and structures
The gaseous content of disk galaxies of the local universe is mainly constituted of atomic and molecular hydrogen (resp. H and H2).
An easy way to observe atomic hydrogen is through the detection of its hyperfine structure splitting which produces the famous 21-cm hydrogen emission line also called HI (in the radio part of the electromagnetic spectrum). We will use from this point on HI as refering to atomic hydrogen. This emission line enables the precise measurement of rotation velocities and ve-locity dispersions inside galaxies and its study subsequently yielded remarkable constraints on orientations of disks (see Carignan, 1990, Daigle et al., 2005, Dicaire et al., 2008).
In disk galaxies, HI is mainly found in disk-shaped structures. These are much more ex-tended than optically observable disks. The ratio of HI diameter to the optical diameter (at 25 B-mag arcsec−2) is about 1.7 with a large scatter, but does not depend on morphological type
or luminosity. There is also a very good correlations between log(MHI) and log(DHI) with a
slope of about 2, M being the globally integrated mass of HI in the galaxy and D the diameter of the HI disk. This implies that the HI surface density averaged over the whole HI disk is constant from galaxy to galaxy, independent of luminosity or type. There is also a relatively well-defined maximum HI surface density in disks of observed galaxies, which amounts to about 10M⊙.pc
The most exterior regions of HI disks are known to exhibit ubiquitous deviations from the main plane of the inner disk, in the forms of flaring and warps. Most researchers from this field seem to agree that these phenomena have something to do with a constant accretion of material with an angular momentum vector misaligned to that of the main disk (see van der Kruit and Freeman, 2011).
On the contrary molecular hydrogen (H2) is much more restricted to inner regions and
spiral arms. A usual method to characterize the galactic content in H2 is the well established
CO-to-H2 conversion factor (often noted XCO).
For instance these techniques to estimate HI and H2 were used by Leroy et al. (2008), to
obtain radial surface densities of molecular gas in nearby spiral galaxies, yielding an approxi-mately constant star formation efficiency across the disk as well as a neatly defined transition region from mainly molecular to mainly atomic hydrogen. In the outer parts of spiral galaxies and in dwarfs, where ΣHI > ΣH2, the star formation efficiency declines steadily with increasing galacto-centric radius.
Another analysis of molecular and atomic gas surface density lead to precise conclusions linking variations of both physical state and density of matter across galactic disks. Making use of the link between CO and H2 reported above, Biegel and Blitz (2012) successfully
demon-strated a remarkably reduced scatter of galactic gaseous radial profiles especially in nearby spirals not experiencing interactions with their environments. The reduced scatter is obtained if H2 and HI are combined into a single quantity ΣHI+H2/ΣHI+H2(rHI=H2). This quantity is
the surface density of gas normalized to the surface density of gas where HI and H2 are present
in equal proportions. This transition occurs at around Σgas ≈ 14 M⊙.pc −2
. This result was interpreted as conversion of HI into H2 being governed primarily by the midplane hydrostatic
pressure in galactic disks. In that case, the location where the gas in the disk goes from being primarily molecular in the inner regions, to where it becomes primarily atomic in the outer regions, should occur at a constant stellar surface density. This constancy is good to about 40% and have values varying from 120 M⊙.pc
−2
to 81 ± 25 M⊙.pc
−2 depending on the study.
We now define star formation rate (SFR) as the total mass of stars created per year (in
M⊙.yr
−1), and the star formation surface density as the SFR of a region of a galactic disk,
divided by the surface this region occupies on the galactic disk (the SFR surface density can be expressed in M⊙.yr
−1.kpc−2).
It is well known since Schmidt et al. (1959) that star formation surface density is caused in the local Universe by enhanced gas surface density. This link is embodied by the Schmidt-Kennicutt law which states
ΣSF R∝ ΣnH
with n between 1 and 2, but whose slope steepens (in the sense of larger decrease of SFR when hydrogen surface brightness decreases) when ΣH .10 M⊙.pc
−2. It was shown that on average
n = 1.4 ± 0.15 (see Kennicutt et al., 1998).
Exploring the evolution of this law with cosmic time provided clues as to how galaxy evolu-tion could have been impacted by dust presence and galactic interstellar radiaevolu-tion fields (ISRF). This is examplified by Gnedin and Kravtsov (2010), studying simulated galaxy evolution, com-paring galaxies 2 billion years after the Big Bang (z ∼ 3) and in the local Universe, showing a systematic decrease of star formation efficiency in lower mass galaxies. Decreasing supernovae prevalence in lower mass systems was ruled out by these authors as a possible explanation for this decrease, and leaving out low dust abundances and high far ultraviolet (FUV) fields as very plausible phenomena suppressing star formation in low metallicity and low mass halos.
In the local Universe pristine HI forms H2 mainly on the surface of dust grains and star
formation stems from molecular H2clouds. So star formation is mainly linked to both molecular
cold dust emission have been envisionned by many authors (see Galametz et al., 2012, Holwerda et al., 2013).
It also consequently follows that study of gas and dust distribution in local galaxies is essential to understand and put severe constraints on galaxy evolution (see Pohlen et al., 2009). More precisely the rate at which gas is accreted and converted into stars regulates not only the star formation history (SFH) but also the chemical evolution of galaxies (see Pohlen et al., 2009).
In the following subsection we will go through the main properties of stellar content observed in disk galaxies.
Stellar content and structures
Stellar emission
The emission of disk galaxies at shorter wavelengths than NIR wavelengths is mostly dominated by their stellar emission. In disk galaxies the stellar content gather most of the visible mass. As mentionned earlier, to probe the bulk of stellar content and also to eliminate dust extinction, galaxies can be studied in the NIR.
Spatially, stellar emission is often analysed as caused by many morphologically diverse com-ponents. The most prominent ones are structures called the exponential disk and the bulge (see van der Kruit and Freeman, 2011). Chang et al. (2012) stated that in present day Universe 58 ± 7% of stars are in spheroids and 42 ± 7% are in disks. These two structures are axisym-metrical with respect to the axis of rotation of the galaxy. Other important stellar components are spiral arms and bars. These are not axisymmetrical.
A census of finer structures was attempted by Gadotti (2008) and Tasca and White (2011). The former authors estimated the distribution of the stellar mass M⋆ for galaxies more massive
than 1010M⊙, and the latter authors examined the distribution of the r and i band luminosity,
L, for a sample of galaxies complete down to a magnitude limit of 15.9:
• 36% of M⋆ and 54 ± 2% of L is found inside in disks;
• 32% of M⋆ and 32 ± 2% of L is found inside elliptical galaxies;
• 28% of M⋆ and 7 ± 2% of L is found inside bulges;
• 4% of M⋆ and 7 ± 2% of L is found inside bars.
Stellar disk
Studies of hydrodynamical simulations enabled to predict that galactic matter in disks had been subjected to mild evolution associated with particularly quiescent merger histories. This is examplified by Driver et al. (2013) reporting that the stellar mass still residing in disks has assembled and lived on without experiencing major mergers. As almost all starbursting galaxies in the nearby Universe are mergers (see Duc et al., 1997, Elbaz and Cezarsky, 2003), it suggests that most matter composing disks did not experienced starbursting events created by mergers, which are known to be destructive events as far as disks are concerned.
Furthermore it seems interesting to precisely detect where non axisymmetric features are present in disk galaxies as non axisymmetric and axisymmettric patterns do not have the same consequences on disk galaxy stability (see Freeman, 1970 and Toomre, 1964). This detection and identification of the diverse components is feasible through the use of ellipse fitting on isophotes and especially the study of their axis ratios and position angles as explained in the
Below we show a widely used (e.g. see Dutton, 2009 refering to Blanton, 2005, or van der Kruit and Freeman, 2011), recent and general parameterization of disk galaxy radial profile of surface brightness, namely the S´ersic profile :
Is(R) = Is,0× e[−(R/Rs)
1/n]
(1) where R is the distance from the center of the galaxy to the region emitting the intensity
Is(R), Is,0 is the central intensity, Rs the scale radius and n the S´ersic index. Values for n of
(4, 1, 0.5) respectively correspond to the de Vaucouleurs (see de Vaucouleurs, 1959), exponential or gaussian profile. The use of S´ersic profiles enables to quantify the proportion of different types of decreasing intensity profiles amid galaxies and especially disk galaxies. Using this methodology, Dutton (2009) provided an estimate of the proportion of purely exponential disk galaxies, which this author showed to be relatively rare (≤ 0.1% of Milky Way like galaxies are purely exponential disk).
We may add to these considerations that the exponential stellar disk model often taken for granted can be questionned. We read in Dutton (2009), quoting Dalcanton et al. (1997), that in a gas disk with solid body angular momentum distribution in centrifugal equilibrium (i.e. close to observed exponential disks), the center is more concentrated than the pure exponential law and there is an outer cut-off at around 4 disk scalelengths, at least for stellar bands.
Although purely exponential disks are relatively seldom, by the time of Freeman (1970) landmark paper, it is already known that in most spiral and lenticular galaxies, a substantial range of radii can be found, over which the decrease of surface brightness is close to exponential. Thus a very usual model used to describe at least a part of stellar disk radial intensity curve in isolated galaxies is given by:
Id(R) = Id,0× e−R/h (2)
where R is the distance from the center of the galaxy to the region emitting the intensity Id(R).
It has first to be emphasized that for the same galaxy and same wavelength band, literature values of scalelengths h may vary by up to 20% from one author to another because of differing methods of measurement (see similar conclusions drawn by Giovanelli and Haynes, 1994 and, on a broader basis, by van der Kruit and Freeman, 2011). More precisely Knapen and van der Kruit (1991) named h1 the disk scalelengths found by Grosbol (1985) in visible red band, and
h2 the disk scalelengths found by other authors for the same galaxies in either blue or red band.
They showed that the average value of the discrepancy d = 2 × |h1− h2|/(h1+ h2) for more
than 120 galaxies is 23% with a standard deviation of 20%. These authors did not find any systematic trend nor correlation of this discrepancy with obvious galactic parameters such as morphological type, arm class or inclination. Discrepancies of 50% are no exceptions and are not confined to one study.
Besides, due to absorption effects, in wavelength ranges subjected to this effect (e.g. I band), the observed scalelength (h) and central surface brightness (Id,0) characterizing exponential disks
may differ from the un-absorbed e-folding scalelength and central surface brightness as shown in Fig. 4 of Giovanelli and Haynes (1994).
This in turn forces to distinguish between observed morphological parameters and intrinsic physical quantities of disk galaxies. It also seems to indicate that an interesting way to measure the unabsorbed e-folding scalelength and central surface brightness would be to consider maps
made from disk galaxies observation at wavelengths where absorption is negligible e.g. NIR wavelengths. But, as galactic emission at some NIR wavelengths exhibits excesses not linked with stellar emission (e.g. PAH emission, see Mentuch et al., 2010), multiwavelength analysis in the NIR is required to finely estimate stellar NIR continuum.
Amid disk galaxies, many structural properties of the stellar phase are related to one another. For instance, many morphological trends were summarized by van der Kruit and Freeman (2011) as follows: galaxies of smaller stellar masses have statistically smaller scalelengths in optical wavelengths as well as smaller isophotal sizes, fainter central surface brightnesses and later morphological types. Giovanelli and Haynes (1995) found similarly that more luminous galaxies have higher central brightnesses, this effect being amplified at K band as compared to I band (and more generally as compared to visual bands).
Furthermore structural properties of disk galaxies have intrinsic distributions. For example morphological studies with statistically meaningful approaches (ruling out selection effects and the limit of detection of disk galaxy samples) found a specific intrinsic surface brightness distri-bution for disk galaxies. Namely this includes the paucity of high surface brightness and large scalelength systems, as well as a bright end limit in terms of surface brightness, whereas no faint end limit of surface brightness could be found (see Giovanelli and Haynes, 1995, de Jong, 1995a).
Structural properties of stellar and dust phases are linked. This link can be revealed by studying stellar light extinction inside disk galaxies as was hinted at by Giovanelli and Haynes (1994). These authors studied I band scalelength variations with galactic inclination. They found their results consistent with the scaleheight of the absorbing material in disk galaxies being approximately equal to about half that of the stellar content or less.
Properties of inner galactic regions and dust extinction were studied through examination of broadband structural parameters of disk galaxies. de Jong (1995b) showed that bulge and disk scalelengths are positively correlated and thus suggested that formation of these two structures were coupled. They also highlighted the decrease of central intensity (i.e. Id,0) when the galaxy
type increases in all 6 bands (B, V, R, I, H, K). More precisely a very pronounced trend is the galactic extinction corrected effective surface brightness of the bulge decreasing with increasing morphological type. This trend is stronger for K band than B band. Explanations for this involve bulges being brighter in redder filters than bluer ones, circumnuclear star formation and dust lanes affecting more B band than K band. These authors also stated that the K band (near IR) is well suited to probe the bulk of the stellar mass mainly made of old stellar populations without being hampered by dust extinction. They found a typical extinction level of 0.06 mag (much less than in bands with smaller wavelengths).
Comparing scalelengths and sizes of disks Giovanelli and Haynes (1995) showed a systematic trend that can be taken into account to reduce the dispersion of scalelengths in galaxy samples. These authors found that scalelengths extracted from global exponential fits of Sc galaxies (these galaxies have weak bulge component as compared to their disk counterpart) in visual bands are to first order proportional to the overall size of the galaxy as measured at some external isophote e.g. at 25 B − mag.(′′
)−2 (see NED “diameter” section). That is a good argument to divide
scalelengths by an isophotal diameter of the galaxy before comparing scalelengths between two galaxies.
cosmological approach to exponential galactic disk formation, that the expected scalelengths in K band are related to optical band scalelengths. These authors also showed that even if observationnally K band is considered a good stellar mass tracer, the scalelength in the K band is typically 1.2 times larger than the scalelength in stellar mass. They thus conclude that in order to derive stellar mass scalelengths from observations, it is necessary to take into account the color gradients which will result in stellar mass-to-light ratio gradients, even in the near infrared (NIR).
In more local approaches, it was made clear (see Pohlen and Trujillo, 2006) that 90% of spiral galaxies exhibit at least 2 radial ranges where the surface brightness decreases exponentially with different slopes, such that breaks are ubiquitous in nearby galactic disks.
In the same outer regions where edge-on galaxies tend to exhibit sharp or complete cut-off, Pohlen and Trujillo (2006) examining face-on to moderatly inclined disk galaxies, found no cut-off. According to these authors studies of edge-on galaxies introduce severe problems caused by the effects of dust and the line-of-sight integration, such as masking the actual shape of the truncation region, or interfering with the identification of other important disk features (e.g. bars, rings, or spiral arms).
In outer regions of non edge-on galaxies, classical downbending breaks are more frequent in later types while the fraction of upbending breaks rises towards earlier types.
For classical downbending breaks (60% of the 90 galaxies studied by Pohlen and Trujillo, 2006) the break galacto centric radius (in kpc) is larger for more luminous galaxies although it is located at 2.5 ± 0.6 times the inner scalelength. Downbending breaks are thought to be created either by star formation threshold, or outer Lindblad resonance associated with the bar when the break is located at around twice the bar radius (see Pohlen and Trujillo, 2006).
Upbending breaks (30% of the sample of Pohlen and Trujillo, 2006) appear to be located at 4.9 ± 0.6 times the inner scalelength, thus further out than downbending breaks. For more than 60% of upbending galaxies a good indication was found that the outer upbending part is a disk-like structure (e.g. by finding spiral arms). Close physical neighbours and slightly disturbed morphology suggested in several cases interaction as a possible origin.
Besides, as stated in Giovanelli and Haynes (1995) and in Giovanelli and Haynes (1994) internal extinction of stellar light in disk galaxies may be studied through careful evaluation of scalelengths corrected for face-on aspect of disk galaxies, in I band. Dust extinction will be further reviewed in a following dedicated subsection. As far as stellar light is concerned, the conclusion of Giovanelli and Haynes (1995) are that galactic disks are more transparent to stellar light at larger galacto centric radius.
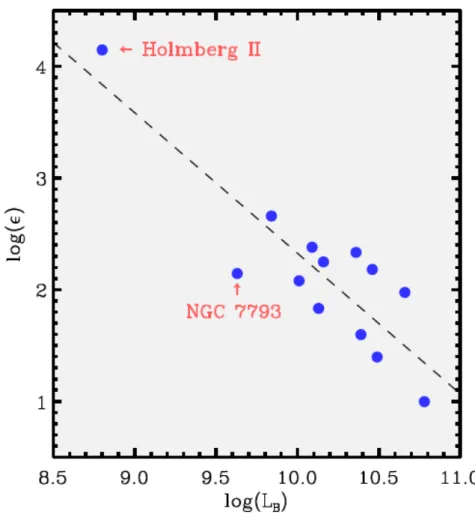
Moreover, according to Giovanelli and Haynes (1994) the ratio of dust-to-stellar scale heights, more likely to reproduce measured profiles of edge-on galaxies, is around ζ ∼ 0.5. ζ is decreas-ing, at least in the I band, when overall luminosity of the galaxy increases, meaning the dust responsible to starlight attenuation is more tightly confined to disk plane in more luminous galaxies ( see page 1067 of Giovanelli and Haynes, 1995). However these authors say it is cus-tomary to assume that dust scalelength is similar to stellar scalelength. This has been shown to be true except for a 10% increase of dust scalelength as compared to stellar scalelength (see Mu˜noz-Mateos, 2009, studying the SINGS galaxy sample).
It was also showed that there is no reliable correlation between scalelength or bulge-to-disk ratios and galaxy types (see de Jong, 1995b). They found a strong correlation (in the studied sample of 86 face-on galaxies) between bulge and disk separately for magnitudes and scale-lengths, but no correlation between bulge and disk central intensities. The correlation between
scalelengths of the disk and the bulge was interpreted by these authors as showing that the formations of the bulge and the disk were coupled (see section ).
Dutton (2009) mentionned that viscous processes may explain the existence of exponential disks in galaxies, but that it requires initial conditions where disks are less concentrated than exponential, which does not correspond to natural yields of the ΛCDM paradigm. This author added that viscous evolution fails to produce bulgeless galaxies with only exponential disks. Instead, he proposed a possible exponential disk formation process through supernovae driven outflows and density dependent star formation, in the general and up-to-date context of ΛCDM initial conditions for galaxies. In many of the resulting simulated galaxies, realistic stellar surface brightness profiles were observed, with disk exponential over several scalelengths, but upturns in very inner regions of the so created “exponential” disk are found ubiquitously. This finding is similar to conclusions previously reached by Dalcanton et al. (1997), showing that a gas disk with solid body angular momentum distribution in centrifugal equilibrium inside a dark matter halo exhibits inner regions more concentrated than exponential. It therefore seems rather reasonable to posit that some upturns of light at small galactic radii may well be part of the disk. We will explore further this question in the next section.
Bulges
Bulges are defined by Kormendy and Kennicutt (2004) as inner regions of disk galaxies where light are found in excess of the extrapolated exponential behaviour of the disk.
They may or may not include more inner structures like nuclear star clusters and bars. Mendez-Abreu et al. (2007) reported strong correlations between the bulge and disk parameters. About 80% of bulges in unbarred lenticular and early to intermediate spiral galaxies are not oblate but triaxial ellipsoids. The interplay between bulge and disk parameters favors scenarios in which bulges have assembled from mergers and/or have grown over long times through the migration of stellar or/and non stellar material from turbulent disk secular evolution (see Driver et al., 2013).
In a study of simulated galaxies (see Sales et al., 2012) it was shown that star formation in spheroids proceeds episodically, leaving behind populations of stars of similar age but distinct kinematics. These populations originate from the accretion of gas whose angular momentum is misaligned relative to that of earlier-accreted material. The misalignment destabilizes any pre-existing disk, prompts the rapid transformation of gas into stars, and reduces the net rotational support of the system. In the core regions the gravitational coupling of the baryons with the dark-matter may allow it to exhibit a pseudo-pressure (see Driver et al., 2013). In general the greater the merger-rate the more bulge-dominated the final galaxy population appears (see Driver et al., 2013).
Bulges are nowadays usually classified as pseudo or classical bulges. Pseudo bulges are as flattened as disks with disky or boxy/peanut edge-on shapes whereas classical bulges are thicker and spheroidal (see Okamoto, 2012).
While these differences point out different formation processes for classical and pseudo-bulges, significant overlaps in their properties were found (see Gadotti, 2008), indicating that these different processes might happen concomitantly. Classical bulges contain 25 per cent of the total stellar mass of galaxies more massive than 1010M⊙in the nearby Universe and
pseudo-bulges contain only 3 per cent, although approximately a third of disk galaxies of the nearby Universe hosts pseudo-bulges.
As reported in Gadotti (2008), pseudo bulges have S´ersic indices broadly n < 2 and are often exponential bulges, these pseudo bulges are expected to be flattened, rotationnally supported,
mainly built through disk instabilities and mostly undergoing fierce star forming episodes. These pseudo bulges are actually very similar to disks in graphs of mean effective surface brightness against effective radius. The mass-size relation of pseudo bulges is close to the one of bars.
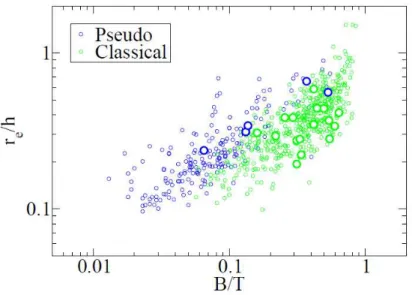
On the contrary classical bulges have n ≥ 2, are more pressure supported and thought to be created through minor mergers. Most of them are quiescent thus not forming stars. Classical bulges are more concentrated than pseudo bulges at fixed bulge-to-total luminosity ratio. More precisely figure 14 of Gadotti (2008) (see figure 4) clearly shows that as compared to scalelength of the disk, scalelength of pseudo bulges are always larger than scalelength of classical bulges at a fixed value of the bulge-to-total luminosity ratio. This figure also shows that bulge to disk scalelength ratios are correlated to bulge-to-total luminosity ratios thus suggesting that the Hubble sequence is not scale-free, if it is a bulge-to-total sequence. Incidentally the petrosian concentration index, defined as the ratio R90/R50, where R90 and R50 are, respectively, the radii enclosing 90 and 50 per cent of the galaxy luminosity, was reported a better proxy for the bulge-to-total luminosity ratio than the S´ersic index. Actually the petrosian concentration index was shown by these authors to correlate even better with a bulge-and-bar-to-total luminosity ratio.
Figure 4: Figure 14 from Gadotti (2008) plotting ratio between the scale-lengths of bulges and disks against B/T for pseudo-bulges and classical bulges. Interestingly, pseudo-bulges and classical bulges seem to follow offset relations. Bigger, white-filled circles with similar colour coding are pseudo-bulges and classical bulges in galaxies with 0.5 < b/a < 0.7 (b/a being the ratio of minor to major axis), and portray similar patterns.
Indeed in graphs of S´ersic bulge radius against I band surface brightness, classical bulges seem to be related to elliptical galaxies whereas pseudo bulges have only broadly similar surface brightnesses as elliptical galaxies (see figure 5).
But it seems also worth noting that classical bulges are on a slightly steeper mass-size relation than pseudo bulges: for the same increase in mass, size increases more for classical bulges, though classical bulges are definitely more massive than pseudo bulges. On the contrary classical bulges and ellipticals follow heavily offset mass-size relations (for the same increase in mass, size increases much more for ellipticals) suggesting that high-mass bulges cannot be considered as high-mass ellipticals that happen to be surrounded by a disk.
Figure 5: Figure 8 from Gadotti (2008). This figure represents one criterion to distinguish classical and pseudo-bulges. It shows the mean effective surface brightness within the effective radius of the bulge plotted against the logarithm of the effective radius of the bulge. It displays elliptical galaxies and, separately, bulges with Sersic index above and below 2. Barred and unbarred galaxies are indicated. The solid line is a fit to the elliptical galaxies and the two dashed lines point out its ±3σ boundaries. Bulges that lie below the lower dashed line are classified as pseudo-bulges, independently of their Sersic index. Bigger, white-filled circles represent systems with 0.5 < b/a < 0.7 (b/a being the ratio of minor to major axis), with similar colour coding. While the threshold in Sersic index (n = 2) can be considered as an approximation to identify pseudo bulges, it is clear that it can generate many misclassifications.