DOI: 10.1351/pac200577030631 © 2005 IUPAC
Solubility equilibria and geochemical modeling
in the field of radioactive waste disposal*
W. Hummel
‡Paul Scherrer Institut, 5232 Villigen PSI, Switzerland
Abstract: If a true thermodynamic equilibrium with a well-known solid is expected to
estab-lish, chemical equilibrium thermodynamics allows estimation of the maximum concentration of a given radionuclide in a specified pore fluid of an underground repository. However, in the course of the review process for the Nagra/PSI Chemical Thermodynamic Data Base 01/01, important cases of insufficient chemical knowledge were identified, leading to gaps in the database. First, experimental data for the ThO2–H2O and UO2–H2O systems cannot be interpreted by a unique set of thermodynamic constants. There, a pragmatic approach was chosen by including parameters in the database that are not thermodynamic constants in a strict sense, but that reproduced relevant experimental observations. Second, potentially im-portant thermodynamic constants are missing because of insufficient experimental data. Estimations of these missing constants led to problem-specific database extensions. Especially constants for ternary mixed carbonato-hydroxo complexes of tetravalent actinides have been estimated by the “backdoor approach”, i.e., by adjusting thermodynamic constants to maximum feasible values that are still consistent with all available experimental solubility data.
Keywords: radionuclide solubility; chemical thermodynamics; radioactive waste disposal;
geochemical modeling; thorium.
INTRODUCTION
The safety of radioactive waste disposal is one of the most debated topics in the field of environmental hazards. Most countries nowadays favor a geological repository, and the related scientific work is fo-cused on the long-term behavior of radioactive waste disposed of in such an underground repository.
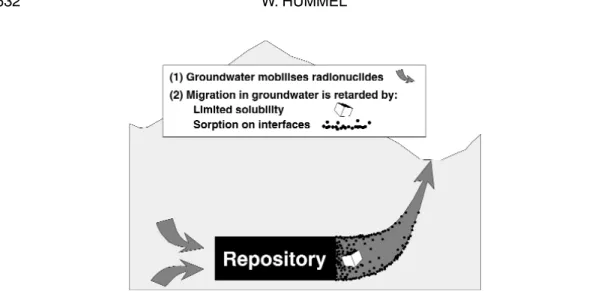
Figure 1 is a simplified sketch of a geological repository showing the main geochemical processes concerning radionuclide mobilization and retardation. Although the site of an underground repository will be chosen as “dry” as possible, groundwater intruding the repository cannot be excluded in safety analyses of planned repositories. Even an extremely low flow of groundwater will mobilize some radio-nuclides in the waste, and there is the possibility that these dissolved radioradio-nuclides will migrate to the surface over long periods of time.
From a scientific point of view, to be convincing, evaluations of any waste disposal project must be based on sound theories and methods. One of these sound and well-established scientific theories is chemical equilibrium thermodynamics. Heavy metals (i.e., most radionuclides) will not dissolve with-out limits in the pore fluids of an underground repository owing to the precipitation of sparingly
solu-*Paper based on a presentation at the 11thInternational Symposium on Solubility Phenomena (11thISSP), Aveiro, Portugal, 25–29 July 2004. Other presentations are published in this issue, pp. 513–665.
ble solids. Chemical equilibrium thermodynamics allows estimation of the maximum concentration of a given radionuclide in a specified pore fluid. This concept of solubility limits on radionuclide concen-trations constitutes one of the pillars of safety of most radioactive waste disposal concepts [1].
A second pillar of safety is depicted in Fig. 1, the retardation of dissolved radionuclides owing to sorption at the solid/water interface. However, a detailed discussion of this also very important process is outside the scope of the present contribution.
If for a given radionuclide a true thermodynamic equilibrium with a well-known solid is expected to establish, and all thermodynamic data related to this equilibrium solid phase are available, chemical equilibrium calculations straightforwardly result in an estimation of the maximum concentration of the radionuclide of interest in a specified pore fluid of an underground repository. However, in the course of the review process for the Nagra/PSI Chemical Thermodynamic Data Base 01/01 [2], which served as the basis for such chemical equilibrium calculations [3,4] for a recent Swiss safety study [5], impor-tant cases of insufficient chemical knowledge were identified, leading to gaps in the database [6,7].
First, experimental data for the ThO2–H2O and UO2–H2O systems cannot be interpreted by a unique set of thermodynamic constants. There, a pragmatic approach was chosen by including param-eters in the database that are not thermodynamic constants in a strict sense, but that reproduced relevant experimental observations. Second, potentially important thermodynamic constants are missing be-cause of insufficient experimental data. Estimations of these missing constants led to problem-specific database extensions. Especially constants for mixed carbonato-hydroxo complexes of tetravalent ac-tinides have been estimated by the “backdoor approach”, i.e., by adjusting thermodynamic constants to maximum feasible values that are still consistent with all available experimental solubility data [8].
Both cases of insufficient chemical knowledge of actinides in the tetravalent state, An(IV), and the pragmatic remedies of the resulting gaps in the thermodynamic database are discussed in some de-tail in the following.
THE An(IV)–H2O SYSTEM: THE ENIGMA OF ThO2AND UO2SOLUBILITY
The solubility of ThO2and UO2as a function of pH has been studied extensively by several groups with the aim of providing basic data for the safety assessments of planned underground repositories. The growing number of published experimental solubility data reveals a consistent, but puzzling picture of the ThO2–H2O (Fig. 2) and UO2–H2O systems (Fig. 3).
Fig. 1 Simplified sketch of a geological repository showing the main geochemical processes concerning
At low pH, the solubility of ThO2 and UO2 strongly depends on the crystallinity of the solid. Differences in solubility of several orders of magnitude have been found between freshly precipitated amorphous and well-crystalline solids (Figs. 2 and 3). However, with increasing pH the measured con-centrations converge, and at neutral and alkaline pH the ThO2and UO2solubility is found to be inde-pendent of (bulk) crystallinity (Figs. 2 and 3). The solution always seems to “see” the same solid in neu-tral and alkaline solutions. The following problems were encountered by the attempt to describe all these experimental data by a unique set of thermodynamic constants.
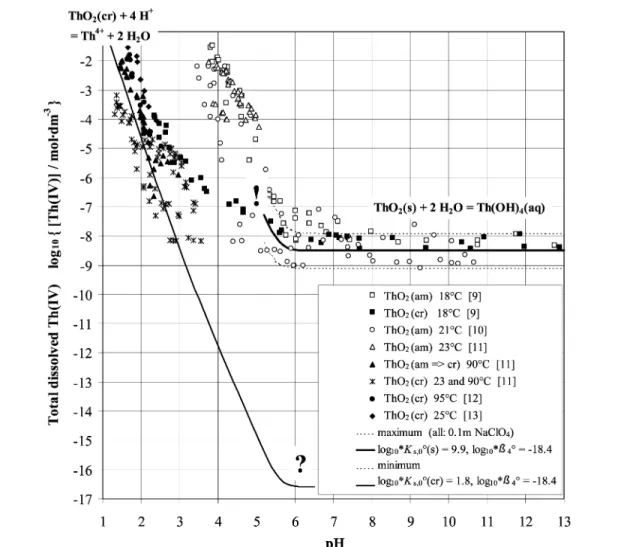
Solubility data for ThO2(cr) agree fairly well with the solubility predicted by calorimetric data in the range pH < 3 (line in Fig. 2). However, combining the solubility product log10*Ks,0°(cr) with the independently determined hydrolysis constant log10*β4° = –18.4 [2] of Th(OH)4(aq) results in pre-dicted Th concentrations far from any measured values in neutral and alkaline solutions. The concen-tration of dissolved Th(IV) should fall below any detection limit to [Th] < 10–16M (see question mark in Fig. 2).
Fig. 2 The enigma of ThO2 solubility: Data derived from the solubility of crystalline ThO2at low pH cannot describe ThO2(s) solubility above pH 6 when using independent Th(OH)4(aq) formation data (question mark). Vice versa, measured solubilities in alkaline solutions do not point back to the behavior of ThO2(cr) at acidic conditions (exclamation mark).
All ThO2(s) solubility data measured in the laboratory at pH > 6 have been found in the range 10–7M > [Th] > 10–9M. A mean value of 10–8.5±0.6M represents *Ks,4°(s) for ThO2(s) + 2H2O ⇔ Th(OH)4(aq). If we combine this constant with the hydrolysis constant log10*β4° of Th(OH)4(aq), a solubility product for ThO2(s) is calculated, which produces a solubility curve somewhere in the “cloud” of solubility data for ThO2(am) and ThO2(cr) (Fig. 2). This set of parameters now describes the measured solubilities at pH > 6, but cannot account for the solubility variation of more than 10 orders of magnitude at lower pH (see exclamation mark in Fig. 2).
The same behavior is found in the U(IV)–H2O system (Fig. 3). At pH < 3, the solubility meas-ured for freshly precipitated UO2(am) and the solubility of UO2(cr) derived from calorimetric data dif-fer by 9 orders of magnitude. All measured solubility data for UO2(s) at pH > 5 have been found in the range 10–7 M > [U(IV)] > 10–10M. A mean value of 10–9±1M represents *Ks,4°(s) for UO2(s) + 2H2O⇔U(OH)4(aq).
Furthermore, this behavior is not restricted to Th(IV) and U(IV). Similar patterns have also been found for Np(IV) and Pu(IV). In all cases, the constant values measured for tetravalent actinides, An(IV), in experimental studies at neutral and alkaline pH are ascribed to the equilibrium AnO2(s) +
Fig. 3 The enigma of UO2solubility: Thermochemical data of crystalline UO2at low pH cannot describe UO2(s) solubility above pH 4 (question mark). Vice versa, measured solubilities in alkaline solutions do not point back to the behavior of UO2(cr) at acidic conditions (exclamation mark).
H2O ⇔An(OH)4(aq), but at present, the solubilities of the entire systems cannot be described by a unique set of thermodynamic constants. Since the hydrolysis constant log10*β4is independent of the solid, we can either account for the strong variation of solubility with crystallinity at low pH by vary-ing the solubility product from log10*Ks,0(am) to log10*Ks,0(cr), or we can describe the constant solu-bility at neutral and alkaline pH by an adapted log10*Ks,0(s), representing a nonspecified solid with the composition AnO2(s). In both cases, inconsistencies arise by extrapolating to the opposite pH range.
A more detailed discussion and comparison of An(IV) solubility and hydrolysis is given by Neck and Kim [19]. These authors conclude from the solubility data measured for ThO2(cr) and UO2(cr) that the crystalline dioxide is the solubility-limiting solid only at very low pH, where An4+is the predomi-nant aqueous species. They postulate that the bulk crystalline dioxide must be covered with an amor-phous surface layer as soon as the An4+ion undergoes hydrolysis reactions, and the dissolution of AnO2(cr) seems to become quasi-irreversible. Further investigations are needed to verify this hypothe-sis and to ascertain the chemical form of the solubility-limiting solid (or surface) in natural systems [19]. Despite this promising qualitative model, at present, the ThO2–H2O and UO2–H2O systems are NOT understood in terms of quantitative equilibrium thermodynamics. The experimental data sets can-not be described by a consistent quantitative model without ad hoc assumptions.
As a pragmatic approach suited for performance assessment of radioactive waste repositories, we decided to rely on measured solubilities of Th(IV) and U(IV) in neutral and alkaline solutions. Hence, the equilibrium constants selected for the Nagra/PSI TDB [2] do not refer to well-defined thorianite, ThO2(cr), and uraninite, UO2(cr), used in calorimetric measurements, but to the still poorly defined solids ThO2(s) and UO2(s) encountered in solubility studies. Furthermore, we considered independently determined hydrolysis constants in the case of Th, and adjusted the missing hydrolysis constant of U(OH)4(aq) in such a way that it is compatible with all experimental solubility measurements in the UO2(s)–H2O–CO2system above pH 4 [2]. Consequently, the equilibrium constants in the Nagra/PSI TDB [2] cannot be used to represent the widely varying solubilities of ThO2and UO2at low pH.
THE An(IV)–H2O–CO2SYSTEM: MISSING TERNARY SPECIES
Extending the An(IV)–H2O system, which is represented in neutral and alkaline solutions by one solid phase, AnO2(s), and one aqueous complex, An(OH)4(aq), to the An(IV)–H2O–CO2system means to add at least three more aqueous complexes, AnCO3(OH)3–, An(CO3)44–, and An(CO3)56–. In the fol-lowing, the origin and the reliability of these complex formation constants are discussed, and methods to estimate missing constants are evaluated.
The An(IV)–H2O–CO2system has been explored by solubility and potentiometric studies mainly at high carbonate concentrations in the pH range 9–12. However, this case study focuses on the few sol-ubility studies carried out at near neutral pH close to the pCO2and pH values of the reference bentonite pore water used in the Swiss safety case [5]. Two different experimental set-ups have been reported: (1) In the Th solubility experiments of Östhols et al. [20], the pH was varied at constant CO2partial
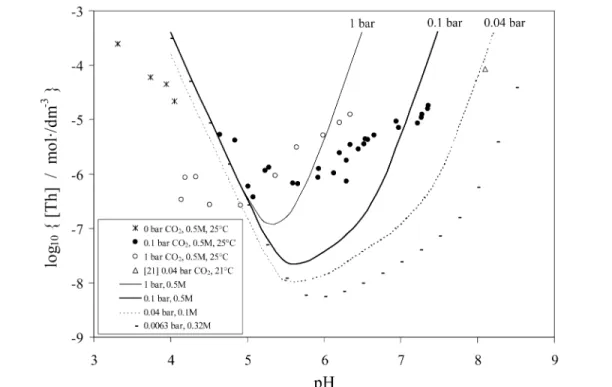
pressures of 0.1 and 1 bar. All experiments were carried out in 0.5 M NaClO4in order to keep the ionic strength constant. This experimental set-up, i.e., constant CO2partial pressure and constant ionic strength, provides the most reliable experimental data for deducing equilibrium constants. However, only the pH range below 8 is available for experimental investigations using CO2(g) as component (Fig. 4). At higher pH, the partial pressure of CO2is very low and the time for equi-librium to be attained becomes very long. Note that data similar to those in [20] do not exist for U, Np, or Pu.
(2) In the solubility experiments of Rai and coworkers [21–24], the concentration of NaHCO3 or KHCO3in solution was varied. This leads to a pH-buffered system (pH ≈8), whereas the CO2 partial pressure varies concomitantly with the bicarbonate concentration. Note that Rai and coworkers did not use a medium of constant ionic strength. They rather tried to estimate the
re-sulting activity factor variations using the Pitzer model. This introduces additional fitting para-meters in the process of deducing stoichiometry and equilibrium constants from experimental sol-ubility data and, thus, makes a complicated solution chemical problem even more difficult. The experimental results and the model curves interpreting these two different set-ups cannot be visualized in one simple 2D graph because each line in one set-up projects to a single point in the other representation. Therefore, the experimental data are shown in two different representations. However, using the same thermodynamic constants in the calculations links the model curves of both representa-tions.
Figure 4 shows the experimental data of Östhols et al. [20] at varying pH and constant pCO2, in-cluding the model curves as obtained using data of the Nagra/PSI TDB 01/01 [2]. There is one data point (pH ≈8, pCO2= 0.04 bar), which links the Östhols data to the Th solubility data of Felmy et al. [21]. The model curve corresponding to the reference bentonite pore water conditions (pCO2= 0.0063 bar) is given for completeness.
In addition to the Th data [21], Fig. 5 shows data for U(IV), Np(IV), and Pu(IV), also measured by Rai and coworkers [22–24] at pH ≈8 as a function of HCO3–concentration. The model curves given in Fig. 5 are calculated using the data provided in the Nagra/PSI TDB 01/01 [2]. Note that the data for Np and Pu in [2] have been taken from the NEA TDB Np and Pu review [25].
Fig. 4 Experimental ThO2solubility data of Östhols et al. [20] (crosses and circles). The lines are calculated using thermodynamic data recommended in the Nagra/PSI TDB 01/01 [2]. The solid lines visualize the conditions of 1 bar and 0.1 bar CO2 partial pressure at 0.5 M NaClO4. The dotted line corresponds to one data point (open triangle) of Felmy et al. [21 ] at 0.038 bar CO2and ionic strength 0.1 M. The solubility corresponding to the conditions of the reference bentonite pore water (10–2.2bar = 0.0063 bar CO2and I = 0.32 M) are represented by small black bars (note that the reference pH is at 7.25).
Note the difference in the speciation model for thorium, which includes the dominant ternary complex ThCO3(OH)3–. In fact, the absence of this complex in the case of U(IV), Np(IV), and Pu(IV), as well as the possible consequences thereof initiated the present case study.
THE BACKDOOR APPROACH: MAXIMUM FEASIBLE VALUES OF TERNARY COMPLEXES
As a first step in the quest for missing values of mixed carbonato-hydroxo complexes a method is ap-plied called “the backdoor approach” [26]. It is assumed that AnCO3(OH)3–complexes exist and are the most important mixed carbonato-hydroxo complexes for all tetravalent actinides in the region of low bicarbonate concentration. Now a special variant of the much more general “backdoor approach” con-sists in adjusting the formation constants of AnCO3(OH)3–complexes to maximum feasible values that are still consistent with the available experimental solubility data. These adjustments were done on the basis of a “visual” fit to the data of Rai and coworkers [21–24].
A comparison of Figs. 5 and 6 reveals that the calculated solubility curves of U, Np, and Pu are solely affected below about 0.1 mol kg–1(Na,K)HCO3. At higher carbonate concentrations, the com-plexes An(CO3)44– and An(CO3)56–still dominate, even if we include maximum feasible values for AnCO3(OH)3–complexes in our speciation model. The calculated lines for U and Pu remain below the
Fig. 5 Experimental solubility data of Rai and coworkers [21–24]. The solid lines are calculated considering the
varying CO2partial pressure and ionic strength along the x-axis using thermodynamic data recommended in the Nagra/PSI TDB 01/01 [2]. In the case of Th, the aqueous species Th(OH)4(aq), ThCO3(OH)3–, and Th(CO3)56– have been included, whereas for U, Np, and Pu, the aqueous species An(OH)4(aq), An(CO3)44–, and An(CO3)56– have been considered.
experimental solubility data at high carbonate concentrations (Fig. 6). However, the pH–pCO2region of interest in this case study is located at the lower end of the experimental range studied by Rai and coworkers [21–24] (Fig. 5). Hence, the maximum feasible values of AnCO3(OH)3–complex stability are of importance in our case study, and the actual stability constants of the complexes An(CO3)44–and An(CO3)56–cause second-order effects only.
The choice of AnCO3(OH)3–as the most important complex is somewhat arbitrary. However, re-peating the “backdoor” exercise using mixed complexes with more than one CO32–group would lead to solubility curves with slopes > 1 in the region of low bicarbonate concentration, and, hence, lower U, Np, and Pu solubility values would be estimated for the bentonite pore water of the Swiss safety case [5]. The complex AnCO3(OH)3–chosen here ensures that maximum values for actinide solubilities are estimated in our specific case study [8], which are still compatible with the experimental data of Rai and coworkers [21–24].
As an attempt to remedy the shortcomings of the “backdoor approach” a visual “best fit” to the data of Rai and coworkers [21–24] is the second step in this exercise of data estimation. The formation constants for An(CO3)44–, An(CO3)56, and AnCO3(OH)3–were varied simultaneously to obtain the best representation of the experimental data. Thereby, the complexes An(CO3)44–and An(CO3)56–were varied by preserving the difference in reported stabilities for An(CO3)44–and An(CO3)56–(about 1.0 log10-units). A similar difference was used to invent a formation constant for the missing Th(CO3)44– complex. The results of this “best fit” are shown in Fig. 7.
Fig. 6 Experimental solubility data of Rai and coworkers [21–24]. The solid lines are calculated considering the
varying CO2partial pressure and ionic strength along the x-axis using thermodynamic data recommended in the Nagra/PSI TDB 01/01 [2]. In the case of U, Np, and Pu, an additional aqueous species, AnCO3(OH)3–, is included in the speciation model. Its stability constant has been adjusted in all cases to a maximum value still compatible with the experimental data of Rai and coworkers [21–24].
This “best fit” model, using a consistent set of relevant complexes for all nuclides, very well rep-resents the Th, U, Np, and Pu data from Rai and coworkers at moderate carbonate concentrations. With the exception of Th, which is an order of magnitude lower, calculated total solubilities are very similar to the original model at log10pCO2= –2.2.
However, going back to the data of Östhols et al. [20], we immediately recognize that the “best fit” model for Th does no more represent these experiments (Fig. 8; see also Fig. 4)! This poses a seri-ous dilemma, because the mixed complex ThCO3(OH)3–and particularly its stability was substantiated using exactly these experimental data. The mixed complexes of U(IV), Np(IV), and Pu(IV) were de-rived thereof using analogy principles, but the data of Rai and coworkers are not sufficiently conclusive to confirm them, and independent additional data are not available.
In addition, it should be noted that the formation constants for An(CO3)44– and An(CO3)56– (An = U, Pu) in the “best fit” model strongly deviate from those selected in [2] on the basis of the NEA review [25]. This is not the case for the corresponding Np carbonate constants, since those were derived by NEA [25] using the data of Rai et al. [23].
In summary, the only remedy of the shortcomings of the “backdoor approach” would be a plete re-analysis of all experimental data, simultaneously for all tetravalent actinides, but this is com-pletely out of the scope of this case study.
Fig. 7 Experimental solubility data of Rai and coworkers [21–24]. Solid lines are calculated considering the varying
CO2partial pressure and ionic strength along the x-axis. In all cases, the same speciation model comprising the aqueous species An(OH)4(aq), AnCO3(OH)3–, An(CO
3)44–, and An(CO3)56–, has been used and two constants
have been adjusted to reach a “best fit”. The stability constant of AnCO3(OH)3–has been adjusted in all cases. The constants of Th(CO3)44–, U(CO
3)44–, and Pu(CO3)44–have been adjusted/invented, preserving reported differences
The “backdoor approach”, i.e., adjusting constants for AnIVCO
3(OH)3–complexes to maximum feasible values that are still consistent with all available experimental solubility data, turned out to be the method of choice in our case study [8]. The estimated constants have no significant effects on the total solubility of U, Np, and Pu in the Swiss safety assessment [5]. Introducing new complexes has, however, a remarkable effect on the speciation in solution.
ACKNOWLEDGMENTS
Partial financial support by the Swiss National Co-operative for the Disposal of Radioactive Waste (Nagra) is gratefully acknowledged.
REFERENCES
1. J. Hadermann. In Modelling in Aquatic Chemistry, I. Grenthe and I. Puigdomènech (Eds.), pp. 577–591, OECD Nuclear Energy Agency, Paris (1997).
2. W. Hummel, U. Berner, E. Curti, F. J. Pearson, T. Thoenen. Nagra/PSI Chemical Thermodynamic
Data Base 01/01, p. 542, Universal Publishers/uPublish.com, Parkland, FL (2002).
3. U. Berner. Project Opalinus Clay: Radionuclide Concentration Limits in the Near-Field of a
Repository for Spent Fuel and Vitrified High-Level Waste, p. 70. PSI Bericht Nr. 02-22, Paul
Scherrer Institut, Villigen, Switzerland (2002).
4. U. Berner. Project Opalinus Clay: Radionuclide Concentration Limits in the Cementitious
Near-Field of an ILW Repository, p. 48, Nagra Technical Report NTB 93-22, Nagra, Wettingen,
Switzerland (2003).
Fig. 8 Consequence of the “best fit” of the ThCO3(OH)3–and Th(CO3)44–constants to the experimental Th data of Felmy et al. [21 ] (Fig. 7): The experimental solubility data of Östhols et al. [20] are no more represented by this speciation model.
5. Nagra. Project Opalinus Clay: Safety Report, p. 360, Nagra Technical Report NTB 02-05, Nagra, Wettingen, Switzerland (2002).
6. W. Hummel, U. Berner, E. Curti, F. J. Pearson, T. Thoenen. Radiochim. Acta 90, 805–813 (2002). 7. W. Hummel and E. Curti. Monatsh. Chem. 134, 941–973 (2003).
8. W. Hummel and U. Berner. Application of the Nagra/PSI TDB 01/01: Solubility of Th, U, Np and
Pu, p. 39, Nagra Technical Report NTB 02-12, Nagra, Wettingen, Switzerland (2002).
9. H. C. Moon. Bull. Korean Chem. Soc. 10, 270–272 (1989).
10. A. R. Felmy, D. Rai, M. J. Mason. Radiochim. Acta 55, 177–185 (1991). 11. D. Rai, D. A. Moore, C. S. Oakes, M. Yui. Radiochim. Acta 88, 297–306 (2000). 12. C. F. Baes Jr., N. J. Meyer, C. E. Roberts. Inorg. Chem. 4, 518 (1965).
13. T. Bundschuh, R. Knopp, R. Müller, J. I. Kim, V. Neck, T. Fanghänel. Radiochim. Acta 88, 625–629 (2000).
14. T. Yajima, Y. Kawamura, S. Ueta. Mater. Res. Soc. Symp. Proc. 353, 1137–1142 (1995). 15. D. Rai, A. R. Felmy, J. L. Ryan. Inorg. Chem. 29, 7852–7865 (1990).
16. D. Rai, A. R. Felmy, S. M. Sterner, D. A. Moore, M. J. Mason, C. F. Novak. Radiochim. Acta 79, 239–247 (1997).
17. J. L. Ryan and D. Rai. Polyhedron 2, 947–952 (1983).
18. G. A. Parks and D. C. Pohl. Geochim. Cosmochim. Acta 52, 863–875 (1988). 19. V. Neck and J. I. Kim. Radiochim. Acta 89, 1–16 (2001).
20. E. Östhols, J. Bruno, I. Grenthe. Geochim. Cosmochim. Acta 58, 613–623 (1994).
21. A. R. Felmy, D. Rai, S. M. Sterner, M. J. Mason, A. J. Hess, S. D. Conradson. J. Solution Chem. 26, 233–248 (1997).
22. D. Rai, A. R. Felmy, N. J. Hess, D. A. Moore. Radiochim. Acta 82, 17–25 (1998).
23. D. Rai, N. J. Hess, A. R. Felmy, D. A. Moore, M. Yui. Radiochim. Acta 84, 159–169 (1999). 24. D. Rai, N. J. Hess, A. R. Felmy, D. A. Moore, M. Yui, P. Vitorge. Radiochim. Acta 86, 89–99
(1999).
25. L. R. Lemire, J. Fuger, H. Nitsche, P. Potter, M. H. Rand, J. Rydberg, K. Spahiu, J. C. Sullivan, W. J. Ullman, P. Vitorge, H. Wanner. Chemical Thermodynamics of Neptunium & Plutonium, p. 845, Elsevier, Amsterdam (2001).
![Figure 4 shows the experimental data of Östhols et al. [20] at varying pH and constant pCO 2 , in- in-cluding the model curves as obtained using data of the Nagra/PSI TDB 01/01 [2]](https://thumb-eu.123doks.com/thumbv2/123doknet/14925649.663880/6.810.97.712.387.780/figure-experimental-östhols-varying-constant-cluding-curves-obtained.webp)
![Fig. 6 Experimental solubility data of Rai and coworkers [21–24]. The solid lines are calculated considering the varying CO 2 partial pressure and ionic strength along the x-axis using thermodynamic data recommended in the Nagra/PSI TDB 01/01 [2]](https://thumb-eu.123doks.com/thumbv2/123doknet/14925649.663880/8.810.96.715.117.577/experimental-solubility-coworkers-calculated-considering-pressure-thermodynamic-recommended.webp)
![Fig. 7 Experimental solubility data of Rai and coworkers [21–24]. Solid lines are calculated considering the varying CO 2 partial pressure and ionic strength along the x-axis](https://thumb-eu.123doks.com/thumbv2/123doknet/14925649.663880/9.810.97.715.122.575/experimental-solubility-coworkers-calculated-considering-varying-pressure-strength.webp)