Growth and Aggregation Regulate Clusters Structural Properties and
Gel Time
Stefano Lazzari
*
,†and Marco Lattuada
*
,‡†Department of Chemical Engineering, Massachusetts Institute of Technology, 77, Massachusetts Avenue, Cambridge, Massachusetts
02139, United States
‡Department of Chemistry, Université de Fribourg, Chemin du Musée 9, 1700 Fribourg, Switzerland
*
S Supporting InformationABSTRACT: When particles undergo aggregation, very often they form structures that can be described with fractal geometry concepts. The spatial organization of the particles embedded in these aggregates, quantified by means of their fractal dimension, plays a key role in the clusters’ diffusion and aggregation process. Fractal dimensions are typically known for some specific, ideal aggregation scenarios, such as for diluted diffusion limited cluster aggregation (DLCA) or reaction limited cluster aggregation (RLCA). The situation becomes significantly more complicated as soon as the initial particle concentration increases and fractal-dimension changing phenomena, such as particle growth, occur. In this frame, the aim of the present work is twofold: (i) to investigate the clusters’ spatial organization in a scenario where growth and aggregation occur simultaneously and (ii) to assess the corresponding aggregation kinetics. To this end, an ad hoc Monte Carlo model has been developed. Both DLCA and RLCA regimes have been
explored at several initial primary particle concentrations and for different growth rates. The results were discussed in terms of the characteristic times of growth (τG) and aggregation (τA), as well as the rate at which the structural properties change, vR. It
was then possible to propose empirical correlations in the form dm= dm(vR) and tgel= tgel(τA,τG) to relate the evolution of the
mass mobility exponent dmand the gel times to the simultaneously occurring processes of growth and aggregation.
1. INTRODUCTION
The formation and growth of crystals in suspensions are central in many applications, ranging from imaging to photovoltaics, to drug formulation.1,2 For a crystal-based product to be useful, effective, and safe, characteristics such as crystal size, shape, and polymorphism have to be well controlled.3−5 In the past few decades, experimental and modeling investigations have clarified how to tune the aforementioned properties relying on variables such as temperature, solvents, surface tension, and supersaturation.3,5−7 The gathered knowledge allowed the development of deterministic models, describing the time-evolution of the crystal size distributions, opening up the possibility to better control and optimize their production processes.1,8,9
Typically, when modeling crystal formation, a complex number of phenomena need to be included, such as crystal nucleation, growth, agglomeration, and breakage.1,10As a result of the agglomeration of particles, clusters with highly irregular structures are often produced. The geometrical features of these clusters cannot be described by means of conventional Euclidean geometry. Thanks to the pioneering work of Mandelbrot, it was discovered that fractal geometry concepts could be applied to the description of particle agglomerates. The fractal dimension, in particular, is the parameter defining the compactness of clusters. To describe the kinetics of
agglomeration and breakage using a population balance equations framework, the fractal dimension (df) of the clusters
is typically required, as it appears in the kinetic expressions describing these events.11,12The fractal dimension describes the spatial organization of the clusters and is typically between one (linear clusters) and three (homogeneous assemblies).12Note that in the following discussion, the terms aggregation and agglomeration will be employed to describe the clustering process of primary particles. Aggregation refers to clusters held together by van der Waals forces, and agglomeration refers to structures whose particles are cemented by crystalline bridges. In the most general sense, dfis a function of the aggregation
regime considered. For instance, in diffusion limited cluster aggregation (DLCA) df= 1.8, whereas larger values of about df
= 2.1 have been reported in reaction limited cluster aggregation
(RLCA).13 As has been recently pointed out, however,
discrepancies arise from these values when the colloidal system
undergoes df changing phenomena whilst aggregation or
breakage occur.12 For instance, if restructuring occurs during aggregation, significant deviations in fractal dimensions are observed both experimentally, as well as computationally.14,15A
http://doc.rero.ch
Published in "The Journal of Physical Chemistry B 121(11): 2511–2524, 2017"
which should be cited to refer to this work.
further example is aggregating particles that simultaneously coalesce. In this case, the fractal dimension shifts toward larger values, as compared to that of the noncoalescing cases.16It has been shown that for both aerosols and polymeric particles the ratio of aggregation and coalescence characteristic times regulates the fractal dimension and therefore the aggregation process.16,17 A similar reasoning can be applied to systems where agglomeration and growth occur simultaneously, such as crystals. If growth occurs at a much larger rate as compared to that of agglomeration, crystals will become compact, with a df≈
3. Conversely, when the growth process is slow compared to that of agglomeration events, fractal-like crystals with df≈ 2 are
observed. These two limiting cases have been shown to be strongly dependent on the supersaturation (S), that is, the ratio between the available solute concentration and the solubility limit of the same substance.18 Supersaturation is strongly connected to the growth process; the larger the S, the faster the growth rate of crystals.3,18In fact, it was shown that at higher supersaturation ratios, one obtains a faster growth and more compact crystals, as compared to lower supersaturation, which leads to open structures.18
As opposed to growth models, no universally accepted mathematical framework exists to describe crystal agglomer-ation; therefore, the employed kernels remain empirical in nature.19To attempt a more fundamental description, knowl-edge of the dfof growing and agglomerating clusters would be
beneficial. Most crystallization processes occur at high values of supersaturation, and the dfof the crystals may be assumed to be
equal to 3, given that crystals grow quickly at high S, and potential voids of the forming clusters are rapidly filled. Although this condition is often fulfilled, situations exist where agglomeration prevails over, or at least competes with, growth, for example, in the undesired formation of crystals in flow reactors, often resulting in clogging.20 When crystals are the undesired side-product of a reaction, their supersaturation might be low, resulting in ramified crystals, which, after nucleating and growing, may deposit in the reactor and clog it upon agglomeration, as has been shown in the case of amination and cross-coupling reactions.20,21 Moreover, the interplay of growth and agglomeration is relevant in the formation of inorganic nanocrystals (e.g., gold, silver, iron, or silica-based particles). Although such particles are being synthesized with quite reasonable control over their size and polydispersity, their formation mechanism has not been yet unraveled.22Moreover, several interesting structures consisting of inorganic nanocrystals have significant application potential in thefields of catalytic supports and insulators.23,12
Different methodologies, relying on either experimental and/ or modeling approaches allow the determination of the fractal dimension.12,24 Among the modeling approaches, the most successful technique in this sense, is the Monte Carlo (MC) simulation.11,25,26Such a methodology allows simulation of a
predefined number of particles moving in a box and
agglomerating with one another according to a given set of rules (e.g., particles stick upon contact, mimicking a DLCA case). During the simulation, the clustering process is followed, tracking both the size of the clusters and the positions of the particles that comprise them. This allows calculation of the hydrodynamic radii of any i-sized cluster. Although this is, in general, a highly complex task, approximate approaches, such as the Kirkwood−Rieseman method, permit estimation of RH,i if all primary particles have the same size, as
= +1 ∑≠ N R R N i j r 1 1 i ij p p,0 H, p2
, where Np is the number of particles
in a cluster, Rp,0 is the primary particle radius, and rij is the
distance between the centers of particles i and j. From RH,i, the
so-called mass mobility exponent, dmcan be obtained from the
following expression, defining the fractal scaling of the cluster
= ⎛ ⎝ ⎜⎜ ⎞ ⎠ ⎟⎟ i k R R i d H, p,0 m (1)
where i is the cluster mass (i.e., the number of particles constituting a cluster) and k is the fractal prefactor. Note that dm is strictly related to df, as both quantities reflect the
structural properties of colloidal clusters. The main difference is that dfis computed from the gyration radius, and dmfrom the
hydrodynamic radius. This methodology has been validated and successfully applied for more than 30 years.11,24,25,27−29
In this frame, a MC model able to describe the simultaneous growth and aggregation of particles has been developed to (i) evaluate the dmof the growing/aggregating particles in different
conditions and (ii) assess the corresponding kinetics. In particular, a growth mechanism has been implemented in a MC code able to describe DLCA and RLCA.27,28The clusters’ mass-mobility exponent is evaluated as a function of parameters such as the growth rate, the initial occupied volume fraction, and the particles sticking probability. The present model represents an interesting tool able to provide the kinetic evolution, as well as the fractal properties, of clusters undergoing simultaneous growth and aggregation/agglomer-ation processes.
2. MC SIMULATIONS
2.1. The MC Algorithm. The employed MC model has been developed starting from a previously validated model.27,28 The main difference is the existence of a growth step. In particular, the MC algorithm proceeds as follows:
(i) a number N of equally sized particles (radius Rp,0) are
randomly placed in a box of size L avoiding super-impositions, once the desired initial occupied volume fractionϕ0is selected ϕ = πR N L 4 3 0 p,03 3 (2)
(ii) at every iteration, a particle (or a cluster) is randomly selected with a probability PD,i, proportional to its
diffusion coefficient Diff,i, which is a function of the
hydrodynamic radius RH,i, according to the Stokes−
Einstein law11 πη = D k T R 6 i i iff, B H, (3)
where kBis the Boltzmann constant, T is the temperature, andη
is the viscosity of the continuous phase. The resulting probability PD,ithat a cluster is selected is then
= ∑= = ∑ − = − P D D R R i i i N i i i N i D, iff, 1 iff, H,1 1 H,1 c c (4)
where NC is the total number of clusters in the box. The
randomly selected cluster is moved by a fractionα of the initial primary particle radius. In the case of a collision between two
particles (or clusters), a new cluster is formed with a given sticking probability, PS. In the DLCA case, PS= 1, whereas PS
≪ 1 under RLCA conditions. In the case of RLCA, whenever a collision is ineffective, the clusters do not fully bounce back, but are moved by 80% of the distance necessary to have a collision; (iii) at every iteration, a random particle is selected (hence with probability 1/N) and its dimension is increased by a quantity ΔR, which is proportional to a fraction of the initial particle radius, gR, corrected by a factor
corresponding to the length of the time step as will be detailed later on;
(iv) every time a new cluster is formed, or a particle grows, the corresponding hydrodynamic radius is recalculated, as well as the volume and the surface area of the aggregate. The two latter quantities are calculated using the ARVO package, which was integrated into the MC code.30All of these quantities account for the particles’ partial superimposition;
(v) the simulation ends either when either (a) a maximum number of iterations is reached, (b) only a few clusters are left in the box (e.g., 20), or (c) a“super-cluster” (the so-called gel) arises, spanning the whole box, connecting all of its surfaces.
Note that when two particles are adjacent in a cluster, if one grows substantially, it will incorporate the other one. The growth of the particles is assumed to be constant throughout the simulation, implying a constant supersaturation, a condition that has also been explored experimentally.31,32 Moreover, all particles possess the same growth rate, whatever their size. Although these assumptions can be straightforwardly changed in the code, they have been made for the sake of simplicity, as
this work represents the very first attempt to describe
simultaneous growth and aggregation with a MC code. A further point worth mentioning is that the initial particle radii, Rp,0, is equal to√3/2L. Therefore, eq 2allows calculation of
the size of the employed box, once the occupied volume fraction ϕ0is selected.
From the description of the MC algorithm, it is clear that the calculation of the cluster hydrodynamic radius is of crucial importance. Because clusters are comprised of partially overlapping spheres with different radii, due to the growth process, the calculation of the cluster hydrodynamic radius has been carried out using an extension of the method presented in a previous work.17The details are presented in the electronic Supporting Information.
2.2. MC Time and Physical Time. During a MC simulation, the time increment at each step is given by the time a particle requires to diffuse a distance equal to its diameter (or a fractionα thereof), divided by the total number of clusters present, NC α Δ = ∑= t i N R R MC 2 1 i C P,0 H, (5)
Note that all radii are normalized by RP,0. To link the MC time,
ΔtMC, to the physical time, one needs to multiply it with the
timeτDfor a particle to diffuse by a quantity corresponding to
its diameter (cf. eq 3) τ α α πη Δ = Δ = ∑= · = ∑= · t t R D R k T (2 ) 6 4 i N R R i N R R MC D 2 1 P,0 2 iff,1 2 1 P,03 B i i C P,0 H, C P,0 H, (6)
When describing the MC algorithm, in step (iii), a time-correction for the radius growth rateΔR, was mentioned. This is described by
Δ =R R g N tP,0 R ΔMC (7)
Note that N is the number of particles in the system. Multiplying by N implies that at the beginning of the simulation, where ΔtMC = 1/N for α = 1 (cf. eq 5), ΔR =
RP,0gR. Hence, the growth of a primary particle is proportional
to a fraction gRof its radius RP,0. Having already linked the MC
time tMC to the physical time t (cf. eq 6), it is possible to
compute the physical growth time. Note that α = 1 has been used in all of our simulations, which is consistent with previously validated MC models.27,28
3. RESULTS AND DISCUSSION
Before illustrating the results, it is worth introducing some useful quantities, which represent the features of the cluster mass distribution obtained from the MC simulations. In particular, given the cluster mass distribution Ni, it is possible to calculate the k-th moments of the distribution, μk, and the
average occupied volume fractionϕ
∑
μ = = i N k i N k i 1 C (8)∑
ϕ= π = L NR 4 3 1 i N i i 3 1 H,3 C (9)To extract the dmand the fractal prefactor k,eq 1is employed.
At different times, the cluster mass distribution is reported on a log−log plot in terms of i versus RH,i. The resulting slope and
intercept represent dm and k, respectively. Further details, in
this sense, are found in the Supporting Information, in particular Figure S1.
A further useful tool to discuss the simulation results is the characteristic time of aggregation,τA, and growthτG
τ β = C 1 A 11 P,0 (10) τ = k 1 G G (11)
where kG(s−1) is the rate of growth, CP,0is the primary particle
concentration at time zero, and β11 is the aggregation rate
between two primary particles β η = k T W 8 3 11 B (12)
Note that W is the Fuchs stability factor, equal to 1 in DLCA and larger than 1 in the RLCA case. These characteristic times need to be redefined in the frame of the MC simulations, given that the aggregation and growth processes are linked to probabilities, particle numbers, and their mobility in the box, and indirectly comprising more physical parameters (e.g., temperature, viscosity)
τ β η ϕ ε ϕ = = = ε C V k T W P 1 3 8 1 p A 11 P,0 ,0 B 0 S 0 (13) τ = ∝ k g 1 1 G G R (14)
where ϕ0is the occupied volume fraction at time zero (cf.eq
2), Vp,0is the primary particle volume at time zero, and Cp,0=
ϕ0/Vp,0. PSis the sticking probability, assumed to be equal for
any i-sized cluster, and gRis the aforementioned % growth rate
increase of a primary particle. It has been assumed that W = PS−1
and that kG∝ gR. Note that for gR→ 0 the characteristic time of
growth becomes infinite. Defining the ratio between the
aggregation and growth characteristic times, ψ, one has
ψ τ τ ϕ = ∝ g P A G R S 0 (15)
The ratioψ can take values between 0 (no growth occurs) and potentially infinity, for very small amounts of particles or a very small sticking probability. ψ offers the possibility to combine the relevant parameters in the interplay of aggregation and growth, and to assess their relative importance.
As a matter of fact, the parameter values employed in the DLCA and RLCA simulations (reported inTable 1) have been varied to explore values ofψ between 10−2and 101.
Note that the employed box size L changes to accommodate different initial occupied volume fractions ϕ0, whilst keeping a
constant number of particles N (cf.eq 2). In particular, L = 239,
190, 140, and 111 when ϕ0 was equal to 1, 2, 5, and 10%,
respectively. All simulation results reported were averaged over 100 repetitions. The length of each simulation increases with growth rate, as particle overlapping has to be accounted for. Running 100 repetitions with our nonparallelized code required about 4 h on a 12 core machine with 2.40 GHz CPU.
Note that the cluster masses used to compute the dm fall
between two values, iMINand iMAX. iMIN = 10 was selected as
suggested in the literature,33whereas iMAX= 5000 was selected
through numerical experiments (cf. Figure S1) to avoid biases due to the selected box size in which the particles“move”. All other average properties reported (e.g., moments and occupied volume fractions) were computed considering the whole cluster mass distribution. To avoid further“box effects” the simulations were considered only until the gel time, that is, the moment where a “super-cluster” spans the box, connecting all of its sides.
To properly compare the simulation results, which take place on different time scales given the range of ϕ0 explored, a
normalized time, τNis employed τ
τ
= t N
A (16)
Recalling that t = tMCτD(cf.eq 6), W = PS−1, and usingeq 13
one gets τ τ τ πη τ ϕ η τ ϕ = = = − t t R k T k T V W t P 4 8 3 8 N MC D A MC P,03 B D B 0 p,0 A1 MC 0 S (17)
A further advantage of discussing the simulation results as a function ofτNis that such a characteristic time is often used to
rationalize experimental results in the frame of colloid aggregation.17
3.1. DLCA. In the DLCA regime, clusters stick upon contact; therefore, the sole parameters affecting the cluster Table 1. Parameter Values Employed in the Simulations
N (−) ϕ0(%) PS(−) gR(%)
DLCA 5× 10⁴ 1/2/5/10 1 0.00/0.25/0.50/0.75/1.00
RLCA 5× 10⁴ 1/2/5/10 0.1 0.00/0.25/0.50/0.75/1.00
Figure 1.Examples of DLCA clusters retrieved atτN= 10, with mass i between 70 < i < 90. Clusters are generated at different initial occupied
volume fractions (ϕ0= 1, 2, 5, and 10%) and growth rates gR. Color code: violet, gR= 0.00%; blue, gR= 0.25%; green, gR= 0.50%; orange, gR=
0.75%; red, gR= 1.00%.
structure are the growth rate, gR, and the initial occupied
volume fraction, ϕ0. To qualitatively appreciate the impact of
these quantities on the cluster structures formed, aggregates of a comparable mass (70 < i < 90) extracted at the same timeτN
= 10 are reported inFigure 1.
Two effects can be appreciated when inspecting Figure 1. When ϕ0 increases, more compact clusters are observed.
Although this effect is observed at any value of gR, it is most
evident when considering the nongrowing clusters, with gR =
0.00% (cf. violet clusters inFigure 1). This result is expected as the higher particle concentration progressively drives the system away from the ideal DLCA conditions, where more open clusters are formed.11,12,33,34 In terms of characteristic times, compact clusters arise for smallerτA(given by largeϕ0)
and therefore a smallerψ, when τGis constant. The other effect
inferred from Figure 1 is linked to the growth rate gR. The
larger gR, the higher the likelihood offinding particles with a
larger radius (cf. the size of the primary particles increase from the violet ones toward the red ones inFigure 1). Larger values of gRlead to compact clusters and imply smallerτG, and larger
ψ values. Such an effect is more pronounced at smaller particles concentrations, for example, ϕ0 = 1% versus ϕ0 = 10%. At
smallerϕ0, and at afixed gR(e.g., gR= 1.00%), the aggregation
characteristic timeτAincreases (compared to that for situations
where ϕ0 is larger) (cf. eq 13); however, the growth
characteristic time τG remains unaffected. In other words,
growth becomes increasingly dominant when the aggregation rate decreases, as is best appreciated when considering the ratio of the two characteristic times,ψ (cf.eq 15).
Summarizing, compact clusters are formed by a significant growth rate and by a larger occupied volume fraction. Therefore, dm is expected to increase for both larger and
smallerψ values. To appreciate the fractal nature of the clusters, the cluster mass i is plotted against the hydrodynamic radius RH,ifor the casesϕ0= 1% with gR= 0.00 and 0.50% inFigure 2.
InFigure 2, it can be seen that larger clusters remain on the continuous lines. Therefore, biases from the selected number of particles can be excluded for the range of cluster masses
selected, namely, 10 ≤ i ≤ 5000. From these plots and
linearizingeq 1, the mass-mobility exponent dmand the fractal
prefactor were computed. Figure 2 allows qualitative insights into the relevance of the growth process on the cluster mass distribution and the structural properties of the clusters to be gained. At comparableτN, larger clusters are formed if growth is
present (cf.Figure 2c,d with a,b). Moreover, a larger degree of scatter is present in the data when growth occurs, especially at
Figure 2.RH,iagainst cluster mass i at different τNfor the DLCA case atϕ0= 1% with gR= 0.00% (a, b) and with gR= 0.50% (c, d). The reported
cluster masses fall between iMIN= 10 and iMAX= 5000. The squares represent RH,iat a given cluster mass i, and the continuous lines are obtained
using the equation RH,i= Rp(i/k)(1/dm), where k and dmarefitted against the reported data points.
smaller sizes. This is due to the fact that growth introduces a further degree of variability in the cluster structure, by modifying the size of single particles belonging to a cluster. Such a difference is less significant for larger clusters, as the impact of single particle growth affects a large cluster less than a small one.
For a more quantitative assessment of the role ofψ on the clusters’ compactness, the mass-mobility exponent dm
(esti-mated through eq 1), is reported against the normalized time τN inFigure 3.
Note that no error bars are reported inFigure 3because the standard error computed was found to be negligible (around 0.3%). The trends of dm versus τN in Figure 3 confirm the
qualitative observations made when inspecting Figure 1. The larger the initial occupied volume fraction, the larger the compactness (i.e., the larger dm) of the clusters (cf.Figure 3a
and d). Also, the effect of the growth rate is confirmed: the larger the gR, the more compact the formed clusters become, as
indicated by the arrows in Figure 3a−d. This latter effect becomes more pronounced for lowerϕ0. For instance, the dm
versus τNset of curves at ϕ0 = 10% exhibits similar trends in
shape and absolute values, as compared to those of theϕ0= 1%
case. In other words, an increase of gRhas a more pronounced
effect on the results, as ϕ0decreases.
Notably, as the growth of the different particles occurs continuously throughout the simulation, the dm steadily
increases over time. Such an increase is also observed for the zero growth case (cf. violet curves in Figure 3). This can be rationalized recalling the aforementioned discrepancies arising at high concentration as compared to those at the ideal diluted DLCA regime.33−36,12 Notably, the dm values observed (well
above 2.0) significantly exceed the ones reported for ideal DLCA aggregation, which lie around 1.8.37This is in agreement with existing modeling studies, which reported larger dfvalues
at large ϕ0.33,34 In particular, when computing the fractal
dimension in the zero growth case at ϕ0 = 1%, we obtain a
value of 1.906, as opposed to 1.885, proposed by González et al.34This slight discrepancy could be related to the fact that González et al. employed an on-lattice MC, as opposed to our off-lattice simulations.
If sufficient simulation time was given, the mass-mobility exponents would reach values of dm ≈ 3, once the cluster
concentration decreased to such an extent that aggregation could be neglected and growth dominates, that is, ψ increases (cf.eq 15).
As the clusters’ dmchanges over time, it is expected that the
aggregation kinetics will be affected as well.11,38To prove this latter point and quantify the extent of such variation as a function of the growth rate, the 0th order momentμ0(cf.eq 8) Figure 3.dmvsτNin DLCA at different ϕ0and gR. (a)ϕ0= 1%, (b)ϕ0= 2%, (c)ϕ0= 5%, and (d)ϕ0= 10%. Color code: violet, gR= 0.00%; blue, gR
= 0.25%; green, gR= 0.50%; yellow, gR= 0.75%; red, gR= 1.00%.
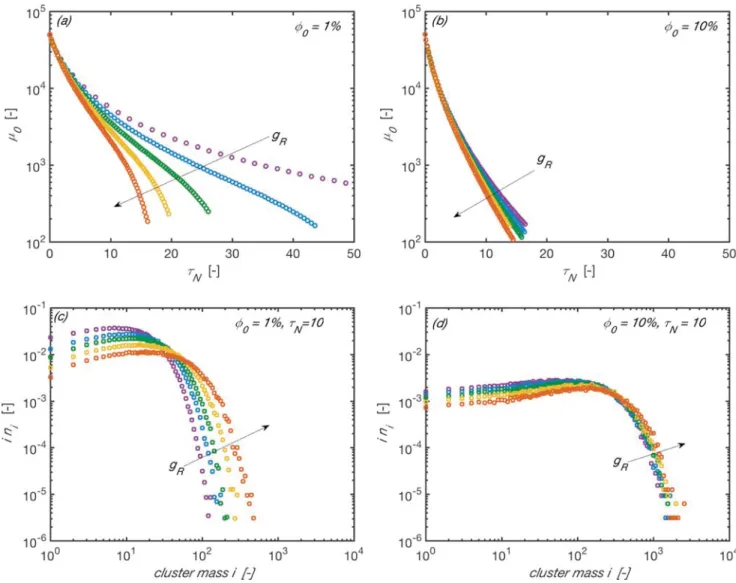
is reported against τN inFigure 4a,b for the cases ϕ0= 1 and
10%.
ComparingFigure 4a,b, it is evident that increasing the initial occupied volume fraction (i.e., the particle concentration) speeds up the aggregation rate.35,36This is due to the fact that aggregation is a second-order event, whose rate scales with the square of the concentration. This increase in aggregation rate is more pronounced for larger gR, as can be observed in both
Figure 4a,b. This can be ascribed to the fact that the more the clusters grow, the larger the space they occupy and the larger the probability that they will further continue their aggregation. Notably, the influence of gRis more significant at lower values
of occupied fraction ϕ0, as can be seen by comparing the
difference between the purple and the red curves (zero and maximum growth, respectively) in Figure 4a where ϕ0 = 1%,
and Figure 4b, where ϕ0 = 10%. This is due to the fact that
aggregation is dominating the rate of aggregation at the larger occupied volume fraction and growth cannot fully unravel its influence, as instead happens in the case at lower concentration (cf.Figure 4a).
Further insights into the impact of a change in dmon the
aggregation kinetics can be observed inFigure 4c,d, where the normalized cluster mass distributions, defined as ni= Ni/N, are
reported forϕ0= 1 and 10% at different growth rates in their
weighted form i ni.
Figure 4c,d shows another facet of the aggregation kinetics in the presence of simultaneous growth and aggregation. The faster the clusters grow, the more space they occupy and the faster they will aggregate. As a result, a right-shift in the distributions is observed for faster growing clusters (cf.Figure 4c). Such an effect holds for all the occupied volume fractions under investigation, but its significance diminishes at larger ϕ0
(cf.Figure 4d). This can be explained recalling how the impact of growth on cluster compactness is particularly significant at a lower occupied volume fraction, as already discussed when introducing Figure 3and the ratio of growth and aggregation characteristic time,ψ (cf. eq 15).
Note that a larger gRalso implies clusters with a larger dm(cf.
Figure 3). This result might look counterintuitive, given that clusters consisting of the same number of particles agglomerate faster the more open they are, that is, the lower their dm.
However, in the present case, the size of the primary particles building up the clusters increases with gR. As a result, the
clusters will have, at the same time, a larger degree of compactness and a larger spatial extension, agglomerating, thus, with other clusters with a larger probability, as compared to the nongrowing clusters. Therefore, the growth process indirectly
Figure 4.a, b)μ0vsτNin DLCA at different ϕ0and gR. (a)ϕ0= 1%, (b)ϕ0= 10%. (c, d) DLCA distributions atτN= 10 at different ϕ0and gR. (c)
ϕ0= 1%, (d)ϕ0= 10%. Color code: violet, gR= 0.00%; blue, gR= 0.25%; green, gR= 0.50%; yellow, gR= 0.75%; red, gR= 1.00%.
Figure 5.Examples of RLCA clusters retrieved atτN= 2, with mass i between 30 < i < 50. Clusters are generated at different initial occupied volume
fractions (ϕ0= 1, 2, 5, and 10%) and growth rates gR. Color code: violet, gR= 0.00%; blue, gR= 0.25%; green, gR= 0.50%; orange, gR= 0.75%; red, gR
= 1.00%.
Figure 6.dmvsτNin RLCA with pS= 0.1 at different ϕ0and gR. (a)ϕ0= 1%, (b)ϕ0= 2%, (c)ϕ0= 5%, (d)ϕ0= 10%. Color code: violet, gR=
0.00%; blue, gR= 0.25%; green, gR= 0.50%; yellow, gR= 0.75%; red, gR= 1.00%.
affects the agglomerating one, through the modification of the clusters’ structure.
Further average quantities againstτNwere computed for the
explored set of gRandϕ0, such as the occupied volume fraction
ϕ, the particle volume fraction ϕP, and the average number of
particles per cluster, NAVE=μ1/μ0. For the sake of brevity, these
results are reported in theSupporting Information(cf.Figures S2−S4). The observed trends can be rationalized along the same principles discussed in the frame of the cluster concentration μ0versusτN.
3.2. RLCA. In RLCA, the aggregation between clusters occurs only with a certain likelihood, the aforementioned sticking probability, PS. In this set of simulations, PSwas set to
equal 0.1 (cf.Table 1). Due to the lower value of PSin RLCA as
compared to that in the DLCA case (where PS = 1), the
resulting clusters are typically more compact in RLCA. In fact, clusters tend to interpenetrate more with one another before aggregation occurs in RLCA, leading to the observed larger dm.
11,39
The degree of compactness of the clusters, or their dm,
is also affected in this aggregation regime by the interplay of the characteristic times of aggregation and growth, or rather by their ratio, ψ (cf.eq 15). To appreciate the cluster structures
observed in this case, agglomerates at timeτN= 2 with masses
between 30 < i < 50 are reported inFigure 5.
As in the DLCA case (cf. Figure 1), a pattern emerges. Clusters formed under concentrated conditions (large ϕ0) are
denser (higher dm) compared to the ones formed under dilute
conditions (cf. clusters infirst and fourth row inFigure 5). This also happens when the particles do not grow (cf. violet clusters in Figure 5), as increasing the initial particle concentration is known to cause clusters to become denser.33,34,40Moreover, as observed already in the DLCA case, increasing gR causes the
clusters to become more compact (cf. red clusters vs violet or blue clusters in Figure 5). Once more, this effect is more pronounced at low ϕ0, as the growth process dominates over
the aggregation one for large values of gRand low values of the
product PSϕ0(cf.eq 15). Despite the similarities between the
clusters observed in DLCA (cf.Figure 1) and RLCA (cf.Figure 5), it is expected that the clusters’ fractal dimensions are larger in RLCA. This effect is known to happen at zero growth11,38 and should be present when primary particles grow. Notably, such a higher degree of compactness can be rationalized by considering the definition of ψ (cf. eq 15). In particular, the sticking probability PS at the denominator is 1 in the DLCA
case but equals 0.1 in the RLCA case. Therefore, as the
Figure 7.(a, b)μ0vsτNin RLCA with PS= 0.1 at different ϕ0and gR. (a)ϕ0= 1%, (b)ϕ0= 10%; (c, d) RLCA distributions with PS= 0.1 atτN= 2
at different ϕ0and gR. (c)ϕ0= 1%, (d)ϕ0= 10%. Color code: violet, gR= 0.00%; blue, gR= 0.25%; green, gR= 0.50%; yellow, gR= 0.75%; red, gR=
1.00%.
remaining parameters defining ψ (namely, ϕ0 and gR) were
varied in the same range for the two simulation sets (cf.Table 1), it is expected that the explored ψ values are larger in the RLCA case. Larger values ofψ mean a more dominant role of growth over aggregation, which leads to larger values of dm, or a
higher degree of compactness. A quantitative perspective of this reasoning is offered inFigure 6, where dmis reported againstτN
in RLCA conditions for the different parameter values explored. Note that no error bars were reported inFigure 6because the standard error computed was found to be negligible (around 0.3%). Although the trends reported inFigure 6 are very similar to the corresponding ones in DLCA conditions (cf. Figure 3), it can be seen that larger values of dmare reached in
the RLCA case. It should be noticed that the typical dmvalue of
RLCA aggregation (dm,RLCA ≈ 2.1) is largely overshot, with
values reaching almost dm≈ 2.4. The rate of increase is more
pronounced for larger gRand lowerϕ0, as previously discussed.
In particular, the differences among a set of curves (at fixed ϕ0)
are more pronounced for smaller ϕ0, as the growth process
dominates with more ease in diluted conditions. When the concentration of particles increases beyond a certain point, the role of growth gets increasingly small and little difference among the results is observed. In this respect, it is interesting to compare Figures 3d and 6d, both reporting the case of high concentration aggregation,ϕ0= 10%, for the same set of gR, but
with different sticking probabilities. It can be seen that the difference among the curves is more pronounced in the RLCA case (cf. Figure 6d) than that in the DLCA case (Figure 3d). This can be rationalized as follows. As the sticking probability is smaller in the RLCA case (0.1 vs 1.0 in DLCA), the aggregation takes a longer time, which allows the growth process to still play a role, even at such a high particle concentration. As a result, different gRvalues significantly impact the average cluster
compactness in the RLCA case at high ϕ0, whereas they play
less of a role in the DLCA case.
To appreciate the impact of the fractal dimension, and of the interplay between growth and aggregation, on the kinetics in the RLCA case, the cluster concentration μ0 is reported in
Figure 7a,b.
Figure 7a,b shows how the cluster concentration decreases faster at higher concentration (atfixed gR) and at larger growth
(at fixed ϕ0). The same observation can be made when
considering the normalized cluster mass distributions in the RLCA case, as shown in Figure 7c,d. These observations are analogous to those described for the DLCA case (cf.Figure 4) and will therefore not be discussed in further depth. Further, average quantities of the cluster mass distribution, such as ϕ, ϕP, and NAVE=μ1/μ0, were computed for the RLCA case and
are reported in the Supporting Information for the sake of brevity (cf.Figures S5−S7).
3.3. dm Evolution. In the previous sections it was shown
that the dmactually increases in time for both the DLCA and
RLCA regimes, during the aggregation process (cf. Figures 3 and6). Therefore, it would be desirable tofind an expression quantifying the dm time-evolution for the cases where both
aggregation and growth occur simultaneously. Note that the case at zero growth is not being considered, as González et al.33,34already proposed a correlation for dmas a function of the
initial occupied volume fraction, ϕ0.
Given the underlying approximations necessary to relate the MC time to the physical time (cf.Section 2.2), we decided to seek a correlation based on the occupied volume fraction,ϕ (cf. eq 9). Notably, the occupied volume fraction ϕ increases during the clustering process for two reasons: (i) growth occurs and the already present clusters“expand”, occupying even more space, and (ii) clustering leads to the formation of porous structures, whose voids are inaccessible to the other clusters, thus increasing the available occupied volume. ϕ is, hence, a quantity affected by growth and aggregation throughout the clustering process.Figure 8shows the trends of dmagainstϕ for
both the DLCA and RLCA cases for gR> 0.
The trends of dm against ϕ can be rationalized along the
same lines as the other quantities previously discussed (cf. Sections 3.1and3.2). The curves with nonzero growth werefit employing the following correlation
κϕ
= γ
dm (18)
whereκ and γ are fitting parameters. Note that the dmincreases
for both largerκ and γ. The selected power law (cf.eq 18) was able to satisfactorily describe the trends both in the DLCA and the RLCA cases (cf. continuous lines inFigure 8). Note that thefit usingeq 18was performed considering only the central
Figure 8.dmvalues againstϕ in DLCA (a−d) and RLCA (e−h) with PS= 0.1 at different ϕ0and gR. (a, e)ϕ0= 1%; (b, f)ϕ0= 2%; (c, g)ϕ0= 5%;
(d, h):ϕ0= 10%. Color code: blue, gR= 0.25%; green, gR= 0.50%; yellow, gR= 0.75%; red, gR= 1.00%. Circles represent the MC simulations; the
continuous lines arefits using the correlation dm=κϕγ.
portion of the data dm versus ϕ. The initial dm increase was
neglected, as it is due to the first cluster formation, where a
proper dm value cannot be strictly defined as too few
“developed” clusters are present. The final part of the data dm
versus ϕ was neglected as the observed sharp dm increase is
ascribed to the incipient gelation. Considering those data points would bias the estimation of a scaling, accounting for phenomena which occur at a stage where the aggregation process is basically fully completed. Although the resulting fitting curves are reasonable (cf. Figure 8), it must be stressed that a different set of κ and γ was used to describe the evolution of each single dmversusϕ trend. However, it would be desirable
to have a function predicting which values ofκ and γ were to be used in each case, possibly as a function of the growth and aggregation parameters. Tofind an appropriate scaling law, one could attempt to write a differential equation quantifying the fractal-dimension evolution as a function of the occupied volume fraction where
ϕ = ϕ d d t t d d d d d d m m (19)
Note that dt/dϕ can be obtained by deriving the definition of occupied volume fraction (cf.eq 9) and inverting it. Given that
ϕ= π ∑= NR L i N i i 4 3 1 1 H,3
3 C is a function of the entire cluster mass
distribution, Ni, which in turn changes, due to both aggregation
and growth, it is clear that no simple expression can be derived for dϕ/dt. Focusing on ddm/dt instead, and recalling that dmis
bounded between its initial value, dm,0, and 3, its maximum
value, a simple expression could be employed, following similar examples already present in the literature16,17,41,42
τ = − d t d d d 1 (3 ) m R m (20)
where τR represents the characteristic time of restructuring,
which is, in the present case, affected by both aggregation and growth. Although no explicit expression is known for τR, one
can infer at least some dependencies on growth and aggregation parameters, based on the literature and the results in the present work. In particular, the mass-mobility exponent is known to increase for (i) larger initial occupied volume fraction
ϕ0, (ii) larger growth rates (see ref18and this work), and (iii)
smaller sticking probabilities.41On the basis of these results and hypothesizing a simple linear dependency on the above-mentioned parameters, one could write
τ ϕ =v ∝ g P 1 R R R 0 S (21)
where vRis the rate of the restructuring (i.e., of dmincrease),
defined as the inverse of the characteristic time of restructuring. Overall, although this analysis does not lead to an analytical expression of ddm/dϕ, it suggests that the fractal dimension
should change, during the clustering process, as a function of the rate of restructuring, vR. Therefore, it is reasonable to expect
that correlations in the form κ = κ(vR) and γ = γ(vR) allow
generalization of the fitting function of eq 18 to describe the DLCA and RLCA evolution of dmagainstϕ. As a matter of fact,
it turns out that thefitted parameters γ and κ do scale with vR,
as shown inFigure 9.
Figure 9 shows how both κ and γ increase with vR in a
logarithmic fashion with an R2 = 0.89. Note that such an increase in prefactor and exponent with vR implies a larger dm
and reflects the occurring physical processes. A larger vR
implies, as suggested by its definition (cf. eq 21), a larger growth, a larger initial particle concentration, or a larger stability toward aggregation (i.e., a smaller sticking probability). As already seen in the literature18,33,41 and in this work, the larger these quantities, the more compact the resulting clusters and therefore the larger the values ofκ and γ.
The reported empirical dependencies among γ and vR, and
amongκ and vR, allow relation of the mass-mobility exponent
to the clustering process through relevant physical quantities of the process (cf.eq 21). Notably, the found dependencies could be used in population balance equation models describing the simultaneous occurrence of growth and aggregation.
3.4. Gel Time. Similar to what has been done inSection 3.3, it would be desirable to establish a relation between the gel time (tgel) and the growth and aggregation processes. The
gelation of a suspension is related to its viscosity, which, in turn, is a function of the occupied volume fractionϕ, and it is known that tgel = tgel(ϕ). In particular, a larger occupied volume
fraction speeds up the gelation of a colloid suspension.43,44
Figure 9.(a) Squares:fitted γ (cf.eq 18) against vR(cf.eq 21). The continuous line is a logarithmic function, whereγ = 0.0143[ln(vR)] + 0.1648,
with R2= 0.89. (b) Fittedκ (cf.eq 18) against v
R(cf.eq 21). The continuous line is a logarithmic function, whereκ = 0.056[ln(vR)] + 2.6382, with
R2= 0.89. Whenever multipleγ or κ values were present for the same v
Rvalue, an average thereof was obtained and an error bar was included.
When analyzing the factors affecting the occupied volume fraction (cf.Section 3.3), to find an expression describing dϕ/ dt, a complex pattern emerged, suggesting thatϕ changes as a function of both growth and aggregation. The faster any of these two processes (for which τG ∝ gR−1, τA ∝ (PSϕ0)−1)
becomes, the faster the increase in occupied volume fraction (cf.Figures S2 and S4); therefore, a faster gelation is expected to occur. To test this hypothesis, the gel times of the DLCA simulations are plotted inFigure 10against the productτAτG.
InFigure 10, it is possible to see how the gel time increases
for both a slower growth rate (larger τG) and slower
aggregation (larger τA). Note that only DLCA simulations
were considered, given that no gelation was observed in the explored RLCA cases. Therefore, a full validation of the observed scaling tgel∝ τAτGis not yet possible, but an indication
for its validity exists. Fitting the gel times in the functional form tgel = a(τAτG)b further corroborates the aforementioned
correlation, cf. the continuous line inFigure 10. The retrieved exponent, b = 0.987, is very close to 1, with an R2 = 0.89,
indicating the reliability of the proposed scaling. Such scaling, that is, tgel∝ τAτG, could be of help when trying to predict the
gelation onset in systems where growth and aggregation occur simultaneously.
3.5. Impact on Aggregation Kinetics. The previously introduced correlation, tgel ∝ τAτG, stresses the impact of the
growth and aggregation interplay on the aggregation kinetics. In fact, it was shown (cf.Figures 4and7) that in both the DLCA and RLCA regimes, the aggregation process is faster; the total concentration decreases faster and the cluster mass distribu-tions ni are progressively right-shifted, at larger growth rates.
Interestingly, when plotting the scaled distribution, fiis defined
as34 = f n N W i i 0 AVE2 (22)
against i/WAVE, where WAVE=μ2/μ1(cf. moments definition in
eq 8), it turns out that the distributions overlap, revealing a self-preserving character, as shown inFigure 11.
The same scaling has been used by González et al.34 to analyze the cluster mass distributions at different concen-trations. The observed superimposition in Figure 11 suggests that although the aggregation rate is affected by the growth rate the same scaling applies, which means that from the point of view of cluster aggregation kinetics, the effect of growth has a similar effect to that of concentration. This is an additional confirmation of the behavior discussed in the previous sections of the work.
3.6. Overview of the Model Features. The cluster shapes that can be formed under the explored conditions of aggregation and growth are summarized inFigure 12.
Monodisperse particles can aggregate in the presence (cf. red clusters in Figure 12) or in the absence (cf. blue clusters in Figure 12) of growth phenomena. In dilute conditions, where ϕ0 = 1%, with a sticking probability PS = 1, open clusters,
reflecting the DLCA aggregation mechanism, are obtained (Figure 12a). By reducing the sticking probability to PS= 0.1,
more compact clusters typical of the RLCA regime are formed (Figure 12b). Increasing the initial particle concentration toϕ0
= 10% further increases the cluster compactness (Figure 12c). These very same observations hold also in the presence of
Figure 10.tgelagainstτAτGfor the DLCA simulations (symbols). The
continuous line represents a fitting curve in the form tgel =
0.0192(τAτG)0.987, with R2= 0.89.
Figure 11.(a) Scaled DLCA distributions atτN= 10 forϕ0= 1, 10%, (b) scaled RLCA distributions with PS= 0.1 atτN= 2 forϕ0= 1, 10%. The
differently colored symbols, partially overlapped, represent the different growth rates. Color code: violet, gR= 0.00%; blue, gR= 0.25%; green, gR=
0.50%; yellow, gR= 0.75%; red, gR= 1.00%.
growth (Figure 12d−f). Once more, it can be appreciated how the aggregating and growing clusters present a larger dm, as
compared to that of their nongrowing counterparts. Growth has, indeed, a strong reshaping effect.
4. CONCLUSIONS
In the present work, an off-lattice MC model accounting for simultaneous particle growth and aggregation was developed. By varying the growth rate (gR), the initial occupied volume
fraction (ϕ0), and the cluster sticking probability (PS), the
model features were explored in the DLCA and RLCA regimes. It turned out that the mass-mobility exponent dmincreases
during the clustering process for (i) larger values of the occupied volume fraction ϕ0, (ii) larger growth rates gR, and
(iii) lower sticking probabilities PS(cf.Figures 3and6). These
findings can be rationalized as follows. A large occupied volume fraction implies that clusters agglomerate with each other not only through their “tips”, as they do in dilute conditions, but also through their cores, therefore forming denser structures. Large growth rates, gR, fill the “voids” of aggregating clusters,
and lower sticking probabilities allow clusters to rearrange and interpenetrate more before aggregation occurs, again increasing dm.
To quantify these findings, a correlation relating dm to the
occupied volume of the system, in the form of dm=κϕγ, was
shown to effectively describe the evolution of the fractal dimension during the clustering process (cf. Figure 8). The fitting parameters κ and γ were proven to scale with the rate of change of the fractal dimension, vR∝ gRϕ0/PS, and correlations
in the formκ = κ(vR) andγ = γ(vR) were proposed to generalize
the relation dm= κϕγ(cf.Figure 9). The obtained correlation
could be employed in population balance equations based models studying growth and aggregation, possibly improving their kinetic predictions.
In fact, the impact of the fractal dimension on the aggregation kinetics could be appreciated from the present MC study. Notably, increasing initial occupied volume fractions and growth rates resulted in a faster decrease of the total cluster
population, and a right-shift in the cluster mass distribution (cf. Figures 4and7). These results were observed for both DLCA and RLCA simulations. Moreover, it was shown that growth affects time-evolution in a similar manner to an increase in concentration. Cluster mass distributions obtained at different growth rates overlap when using a scaling developed for aggregation under concentrated conditions, revealing the typical self-preserving nature of DLCA and RLCA mechanisms (cf.Figure 11).
Interestingly, a correlation between the gel time and the characteristic times of growth (τG) and aggregation (τA) was
found in the DLCA case, suggesting that tgel∝ τAτG(cf.Figure
10). The latter correlation could be of help when trying to predict gelation and clogging onset in reactors and crystallizers. Despite the underlying simplifying assumptions (e.g., constant growth over time), the provided MC model, along with the proposed correlations, could be of help in the development of a universal agglomeration kernel in crystal-lization, where typically both growth and agglomeration occur.
■
ASSOCIATED CONTENT*
S Supporting InformationThe Supporting Information is available free of charge on the ACS Publications websiteat DOI:10.1021/acs.jpcb.6b12682.
Calculation of the hydrodynamic radius of a cluster made of interpenetrating particles having different sizes; convergence of dm with NMAX; kinetic information,
further graphs (ϕ, ϕP, NAVEagainst τN) for the DLCA
and RLCA case (PDF)
■
AUTHOR INFORMATION Corresponding Authors *E-mail:[email protected](S.L.). *E-mail:[email protected] (M.L.). ORCID Stefano Lazzari: 0000-0002-6688-1467 NotesThe authors declare no competingfinancial interest.
■
ACKNOWLEDGMENTSBoth S.L. and M.L. gratefully acknowledge the Swiss National Science Foundation (SNSF) for financial support (S.L. grant numbers P2EZP2_159128 and P300P2_167683, M.L. grant number PP00P2_159258).
■
REFERENCES(1) Ochsenbein, D. R.; Schorsch, S.; Vetter, T.; Mazzotti, M.; Morari, M. Growth Rate Estimation of βl-Glutamic Acid from Online Measurements of Multidimensional Particle Size Distributions and Concentration. Ind. Eng. Chem. Res. 2014, 53, 9136−9148.
(2) van Embden, J.; Chesman, A. S. R.; Jasieniak, J. J. The Heat-Up Synthesis of Colloidal Nanocrystals. Chem. Mater. 2015, 27, 2246− 2285.
(3) Kashchiev, D. Nucleation: Basic Theory With Applications; Butterworth Heinemann: Oxford, 2000; p 529.
(4) Chen, J.; Sarma, B.; Evans, J. M. B.; Myerson, A. S. Pharmaceutical Crystallization. Cryst. Growth Des. 2011, 11, 887−895. (5) Lee, A. Y.; Erdemir, D.; Myerson, A. S. Crystal Polymorphism in Chemical Process Development. Annu. Rev. Chem. Biomol. Eng. 2011, 2, 259−280.
(6) Mura, F.; Zaccone, A. Effects of shear flow on phase nucleation and crystallization. Phys. Rev. E 2016, 93, No. 042803.
Figure 12.Overview of the structures that can be obtained by the MC model. Blue clusters are obtained by aggregation only (gR = 0%),
whereas red clusters are obtained by aggregation and growth (gR =
1%). (a, f) DLCA withϕ0= 1%; (b, e) RLCA withϕ0= 1% and PS=
0.1; (c, d) RLCA withϕ0= 10% and PS= 0.1.
(7) Salvalaglio, M.; Vetter, T.; Giberti, F.; Mazzotti, M.; Parrinello, M. Uncovering Molecular Details of Urea Crystal Growth in the Presence of Additives. J. Am. Chem. Soc. 2012, 134, 17221−17233.
(8) Marchisio, D. L.; Barresi, A. A.; Garbero, M. Nucleation, growth, and agglomeration in barium sulfate turbulent precipitation. AIChE J. 2002, 48, 2039−2050.
(9) Schöll, J.; Lindenberg, C.; Vicum, L.; Brozio, J.; Mazzotti, M. Precipitation of alpha L-glutamic acid: determination of growth kinetics. Faraday Discuss. 2007, 136, 247−264.
(10) Lindenberg, C.; Scholl, J.; Vicum, L.; Mazzotti, M.; Brozio, J. L-glutamic acid precipitation: Agglomeration effects. Cryst. Growth Des. 2008, 8, 224−237.
(11) Friedlander, S. K. Smoke, Dust, and Haze Fundamentals of Aerosol Dynamics, 2nd ed.; Oxford University Press: New York, 2000; p 407. (12) Lazzari, S.; Nicoud, L.; Jaquet, B.; Lattuada, M.; Morbidelli, M. Fractal-like structures in colloid science. Adv. Colloid Interface Sci. 2016, 235, 1−13.
(13) Weitz, D. A.; Huang, J. S.; Lin, M. Y.; Sung, J. Limits of the fractal dimension for irreversible kinetic aggregation of gold colloids. Phys. Rev. Lett. 1985, 54, 1416−1419.
(14) Chakraborti, R. K.; Gardner, K. H.; Atkinson, J. F.; Van Benschoten, J. E. Changes in fractal dimension during aggregation. Water Res. 2003, 37, 873−883.
(15) Kostoglou, M.; Konstandopoulos, A. G. Evolution of aggregate size and fractal dimension during Brownian coagulation. J. Aerosol Sci. 2001, 32, 1399−1420.
(16) Eggersdorfer, M. L.; Kadau, D.; Herrmann, H. J.; Pratsinis, S. E. Multiparticle Sintering Dynamics: From Fractal-Like Aggregates to Compact Structures. Langmuir 2011, 27, 6358−6367.
(17) Lazzari, S.; Jaquet, B.; Colonna, L.; Storti, G.; Lattuada, M.; Morbidelli, M. Interplay between Aggregation and Coalescence of Polymeric Particles: Experimental and Modeling Insights. Langmuir 2015, 31, 9296−9305.
(18) Baldyga, J.; Jasinska, M.; Orciuch, W. Barium sulphate agglomeration in a pipe - An experimental study and CFD modeling. Chem. Eng. Technol. 2003, 26, 334−340.
(19) Besenhard, M. O.; Chaudhury, A.; Vetter, T.; Ramachandran, R.; Khinast, J. G. Evaluation of Parameter Estimation Methods for Crystallization Processes Modeled via Population Balance Equations. Chem. Eng. Res. Des. 2015, 94, 275−289.
(20) Hartman, R. L.; Naber, J. R.; Zaborenko, N.; Buchwald, S. L.; Jensen, K. F. Overcoming the Challenges of Solid Bridging and Constriction during Pd-Catalyzed C−N Bond Formation in Micro-reactors. Org. Process Res. Dev. 2010, 14, 1347−1357.
(21) Hartman, R. L. Managing Solids in Microreactors for the Upstream Continuous Processing of Fine Chemicals. Org. Process Res. Dev. 2012, 16, 870−887.
(22) Thanh, N. T. K.; Maclean, N.; Mahiddine, S. Mechanisms of Nucleation and Growth of Nanoparticles in Solution. Chem. Rev. 2014, 114, 7610−7630.
(23) Coppens, M. O.; Froment, G. F. Diffusion and Reaction in a Fractal Catalyst Pore .1. Geometrical Aspects. Chem. Eng. Sci. 1995, 50, 1013−1026.
(24) Sorensen, C. M. Light Scattering by Fractal Aggregates: A Review. Aerosol Sci. Technol. 2001, 35, 648−687.
(25) Meakin, P. Models for Colloidal Aggregation. Annu. Rev. Phys. Chem. 1988, 39, 237−267.
(26) Meakin, P. Formation of Fractal Clusters and Networks by Irreversible Diffusion-Limited Aggregation. Phys. Rev. Lett. 1983, 51, 1119−1122.
(27) Lattuada, M.; Wu, H.; Morbidelli, M. A simple model for the structure of fractal aggregates. J. Colloid Interface Sci. 2003, 268, 106− 120.
(28) Lattuada, M.; Wu, H.; Morbidelli, M. Radial density distribution of fractal clusters. Chem. Eng. Sci. 2004, 59, 4401−4413.
(29) Weitz, D. A.; Oliveria, M. Fractal Structures Formed by Kinetic Aggregation of Aqueous Gold Colloids. Phys. Rev. Lett. 1984, 52, 1433−1436.
(30) Busa, J.; Dzurina, J.; Hayryan, E.; Hayryan, S.; Hu, C. K.; Plavka, J.; Pokorny, I.; Skrivanek, J.; Wu, M. C. ARVO: A Fortran package for computing the solvent accessible surface area and the excluded volume of overlapping spheres via analytic equations. Comput. Phys. Commun. 2005, 165, 59−96.
(31) Kowacz, M.; Putnis, C.; Putnis, A. The effect of cation: anion ratio in solution on the mechanism of barite growth at constant supersaturation: Role of the desolvation process on the growth kinetics. Geochim. Cosmochim. Acta 2007, 71, 5168−5179.
(32) Spanos, N.; Koutsoukos, P. G. Kinetics of precipitation of calcium carbonate in alkaline pH at constant supersaturation. Spontaneous and seeded growth. J. Phys. Chem. B 1998, 102, 6679− 6684.
(33) González, A. E.; Martínez-López, F.; Moncho-Jordá, A.; Hidalgo-Alvarez, R. Two-dimensional colloidal aggregation: Concen-tration effects. J. Colloid Interface Sci. 2002, 246, 227−234.
(34) González, A. E.; Martínez-López, F.; Moncho-Jordá, A.; Hidalgo-Alvarez, R. Concentration effects on two- and three-dimensional colloidal aggregation. Physica A 2002, 314, 235−245.
(35) Heine, M. C.; Pratsinis, S. E. Brownian coagulation at high concentration. Langmuir 2007, 23, 9882−9890.
(36) Lattuada, M. Predictive Model for Diffusion-Limited Aggrega-tion Kinetics of Nanocolloids under High ConcentraAggrega-tion. J. Phys. Chem. B 2012, 116, 120−129.
(37) Lin, M. Y.; Lindsay, H. M.; Weitz, D. A.; Klein, R.; Ball, R. C.; Meakin, P. Universal Diffusion-Limited Colloid Aggregation.J. Phys.: Condens. Matter 1990, 2, 3093−3113.
(38) Lin, M. Y.; Lindsay, H. M.; Weitz, D. A.; Ball, R. C.; Klein, R.; Meakin, P. Universality in Colloid Aggregation. Nature 1989, 339, 360−362.
(39) Lin, M. Y.; Lindsay, H. M.; Weitz, D. A.; Ball, R. C.; Klein, R.; Meakin, P. Universal reaction-limited colloid aggregation. Phys. Rev. A 1990, 41, 2005−2020.
(40) Nicoud, L.; Lattuada, M.; Yates, A.; Morbidelli, M. Impact of aggregate formation on the viscosity of protein solutions. Soft Matter 2015, 11, 5513−5522.
(41) Kim, A. Y.; Berg, J. C. Fractal aggregation: Scaling of fractal dimension with stability ratio. Langmuir 2000, 16, 2101−2104.
(42) Gruy, F. Modelling of aggregate restructuring in a weakly turbulent flow (vol 395, pg 54, 2012). Colloids Surf., A 2012, 403, 169. (43) Lazzari, S.; Maggioni, G. M.; Soos, M.; Wu, H.; Morbidelli, M. Shear-stability and gelation of inverse latexes. Soft Matter 2013, 9, 10866−10876.
(44) Zaccone, A.; Gentili, D.; Wu, H.; Morbidelli, M. Shear-induced reaction-limited aggregation kinetics of Brownian particles at arbitrary concentrations. J. Chem. Phys. 2010, 132, No. 134903.