v ReseaRch PaPeR
Soil H
2
18
O labelling reveals the effect of drought on C
18
OO
fluxes to the atmosphere
Matti Barthel1,2,†, Patrick Sturm2,*, Albin Hammerle2,3, Nina Buchmann2, Lydia Gentsch2,5,
Rolf Siegwolf4 and Alexander Knohl2,5
1 Ecosystems and Global Change, Landcare Research, P.O. Box 69040, Lincoln 7640, New Zealand 2 Institute of Agricultural Sciences, ETH Zürich, Universitätsstrasse 2, 8092 Zurich, Switzerland 3 Institute of Ecology, University of Innsbruck, Sternwartestrasse 15, 6020 Innsbruck, Austria
4 Laboratory for Atmospheric Chemistry/Stable Isotopes & Ecosystem Fluxes, PSI – Paul Scherrer Institute, 5232 Villigen, Switzerland 5 Chair of Bioclimatology, Georg-August University of Göttingen, Büsgenweg 2, D-37077 Göttingen, Germany
*Present address: TOFWERK AG, Uttigenstrasse 22, 3600 Thun, Switzerland. † To whom correspondence should be addressed. E-mail: [email protected]
Received 20 June 2014; Revised 20 June 2014; Accepted 23 June 2014
Abstract
Above- and belowground processes in plants are tightly coupled via carbon and water fluxes through the soil–plant–atmos-phere system. The oxygen isotopic composition of atmospheric CO2 and water vapour (H2Ov) provides a valuable tool for investigating the transport and cycling of carbon and water within this system. However, detailed studies on the coupling between ecosystem components and environmental drivers are sparse. Therefore, we conducted a H218O-labelling experi-ment to investigate the effect of drought on the speed of the link between below- and aboveground processes and its subsequent effect on C18OO released by leaves and soils. A custom-made chamber system, separating shoot from soil compartments, allowed separate measurements of shoot- and soil-related processes under controlled conditions. Gas exchange of oxygen stable isotopes in CO2 and H2Ov served as the main tool of investigation and was monitored in real time on Fagus sylvatica saplings using laser spectroscopy. H218O-labelling showed that drought caused a slower transport of water molecules from soil to shoot, which was indicated by its direct derivation from independently measured concen-trations and 18O/16O ratios of CO
2 and H2Ov, respectively. Furthermore, drought reduced the 18O equilibrium between H2O and CO2 at the shoot level, resulting in less-enriched C18OO fluxes from leaf to atmosphere compared with control plants. Compared with the shoot, 18O equilibrium was not instantaneous in the soil and no drought effect was apparent.
Key words: Above/belowground, C18OO, coupling, drought, Fagus sylvatica, H
218O, laser spectroscopy.
© The Author 2014. Published by Oxford University Press on behalf of the Society for Experimental Biology. All rights reserved. For permissions, please email: [email protected]
Abbreviations: 18Δ
mea, measured discrimination against C18OO; 18Δmod-simple, modelled discrimination against C18OO without varying θ; 18Δmod-extended, modelled discrimination against C18OO including varying θ; δ
A, δ18O of CO2 in atmosphere, equivalent to δOUT-C; δE, δ18O of water at the leaf evaporative front; δES, δ18O of water at the soil evaporative front; δEV, δ18O of soil evaporation; δL, δ18O of CO2 dissolved in leaf water (assuming 100% equilibrium with δE); δSR, measured δ18O of CO2 flux from soil to atmosphere; δSR-mod, modelled δ18O of CO2 flux from soil to atmosphere; δIN-C, δ18O of CO2 at chamber inlet; δIN-W, δ18O of H2Ov at chamber inlet; δOUT-C, δ18O of CO2 at chamber outlet; δOUT-W, δ18O of H2Ov at chamber outlet; δT, δ18O carried by leaf transpiration; δV, δ18O of water vapour in atmosphere, equivalent to δOUT-W; ε*, ε*soil, equilibrium fractionation between liquid water and water vapour at the air–water interfaces, for leaves and soil respectively; εk, kinetic fractionation during H2Ov diffusion from the leaf intercellular airspaces to the atmosphere; εk-soil, kinetic fractionation during H2Ov diffusion from the soil airspaces to the atmosphere; εw, equilibrium fractionation between H2O and CO2; θ, extent of 18O equilibrium between H2O and CO2; ξ, ratio of CO2 entering the chamber compared with the photosynthetic flux; AN, net photosynthesis; ā, diffusive 18O fractionation from atmosphere to leaf evaporative front; ās, diffusive 18O fractionation from soil evaporative front to atmosphere; CA, carbonic anhydrase; Ca, atmospheric CO2 concentration; Cc, CO2 concentration at the site of carboxylation; CIN, CO2 mole fraction at chamber inlet; COUT, CO2 mole fraction at chamber outlet, equal to Ca; E, leaf transpiration; Es, soil evaporation; gb, leaf boundary layer con-ductance to H2Ov; gs, stomatal conductance to H2Ov; ea, water vapour pressure in the atmosphere; el, water vapour pressure in the leaf, assuming water vapour saturation in the leaf; es,water vapour pressure in the soil, assuming water vapour saturation in the soil; H218O, water enriched in 18O (label); H2Ov, water vapour; r, retroflux factor, i.e. factor by which leaf CO2 retroflux exceeds photosynthetic flux AN; Rs, soil respiration; SWC, soil water content; Ta, air temperature; Tl, leaf tem-perature; Ts, soil temperature; VPD, vapour pressure deficit; WVIA, water vapour isotope analyser; WOUT, water vapour mole fraction at chamber outlet, equivalent to atmospheric H2Ov; WIN, water vapour mole fraction at chamber inlet.
Introduction
The biogeochemical cycling of carbon and water vapour between the terrestrial biosphere and the atmosphere makes terrestrial ecosystems a major player in Earth’s climate sys-tem. The predicted higher probability/frequency of climate extremes (Schär et al., 2004), such as droughts, has the poten-tial to alter biogeochemical cycling in terrestrial ecosystems and hence to generate feedback within the climate system. In particular, soil drought is a major factor determining carbon and water fluxes through the soil–plant–atmosphere system (Granier et al., 2007). Among other factors, soil drought con-trols stomata regulation (e.g. Gollan et al., 1986), which in turn influences photosynthesis and transpiration. Soil drought also reduces the speed of link of carbohydrate allocation from above- to belowground ecosystem compartments, probably being limited by stomata-mediated carbon uptake and trans-fer (Rühr et al., 2009; Barthel et al., 2011a). Since soil drought affects the carbon-related speed of link from above- to below-ground (phloem), soil drought might also affect the plant–soil coupling in the opposite direction, i.e. affecting the water-related speed of the link from below- to aboveground (xylem). Analogous to 13C (Kayler et al., 2010), 18O in water can
serve as a tool to investigate plant physiology and soil–plant coupling, i.e. the speed of the link from below- to above-ground. Moreover, the 18O-composition of soil or leaf water
should immediately be passed on to CO2, as dissolved CO2
exchanges its oxygen isotopic signature with water. In leaves, the equilibrium reaction between CO2 and H2O is catalysed by
the enzyme carbonic anhydrase (CA) (Silverman 1982; Gillon and Yakir 2000a, 2001), whereas in soils such CA activity is still under debate (Tans, 1998; Seibt et al. 2006; Wingate
et al., 2008). As water concentrations are usually much higher than those of CO2, water will always impose its oxygen
iso-topic ratio upon the dissolved CO2, irrespective of the initial
isotopic signature of CO2 (Miller et al., 1999). Consequently,
CO2 molecules that diffuse from leaves or soils should carry
the oxygen isotopic signature of leaf or soil water, respectively. Thus, any change in the soil water oxygen isotopic composi-tion will propagate within the soil–plant–atmosphere system, and eventually affect the oxygen stable isotope composition of atmospheric CO2 (δA). δA in turn is one of the few tools
to separate the major terrestrial ecosystem CO2 gross fluxes,
photosynthesis and respiration, into their net components at global (Ciais et al., 1997) or local (Kato et al., 2004; Sturm
et al., 2012) scales. Similarly, Bowling et al. (2003) utilized the oxygen stable isotope difference between soil and leaves to quantify the relative contribution of soil and foliar respira-tion to total nocturnal ecosystem respirarespira-tion. However, using
δA in order to separate assimilatory from respiratory fluxes
at subdaily time scales requires a detailed understanding of how rapid changes of soil or leaf water 18O (for instance due
to rain events or strong evaporative enrichment) translate to C18OO fluxes from individual ecosystem components—
especially under different environmental conditions such as drought. Yakir (2003) stated that the δ18O value of
precipita-tion is the single most important environmental control on
δA, as it translates to soil water and feeds plants. He further
pointed out that, at the global scale, it is the leaf and soil components that dominate the uncertainty of the global 18O
mass balance. Although there are a considerable number of studies on C18OO fluxes in terrestrial ecosystems where
indi-vidual components were investigated, such as the soil atmos-phere C18OO flux (Miller et al., 1999; Wingate et al., 2008) or
the canopy-to-atmosphere flux (Griffis et al., 2011), research on the link between components has so far been neglected.
Thus, we conducted a H218O-labelling experiment to
investi-gate the effect of drought on the speed of the link between below- and aboveground processes and its subsequent effect on C18OO
released by leaves and soils. We hypothesized that 18O-labelling
(watering) would result in a continuous enrichment of soil and leaf waters, which in turn would change the 18O composition of
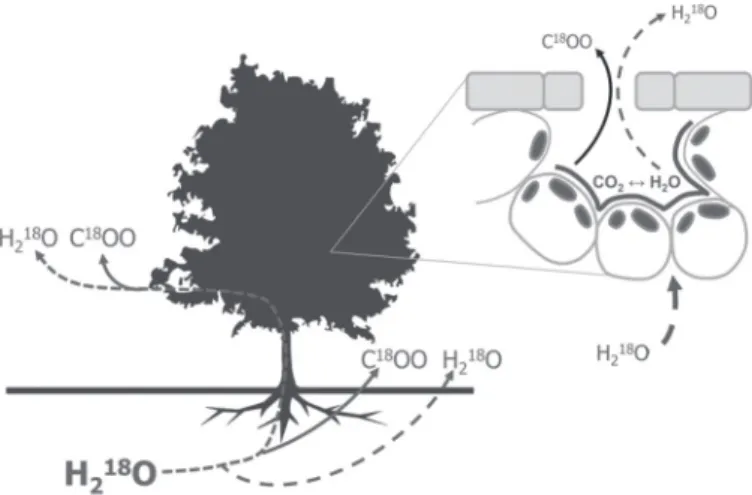
CO2 released to the atmosphere (Fig. 1). We expected that H218O
label-induced enrichment in the shoot compartment would be time lagged, given the transport times within the plant. As sto-matal conductance is generally downregulated during drought, we further hypothesized that water molecule transport from soil to shoot would be reduced under drought conditions, hence also delaying the enrichment of 18O in CO
2. In order to trace the 18O
flux on an hourly timescale, gas exchange in the soil and shoot was measured in real time using online laser spectroscopy. To our knowledge, this is the first study reporting on measuring, concurrently and continuously, the 18O/16O ratio in CO
2 and
water vapour (H2Ov) of shoot and soil gas exchange after
irriga-tion of the soil surface with 18O-labelled water.
Materials and methods
Experimental design and set-up
The experiment was carried out in a growth cabinet using small beech saplings (Fagus sylvatica L., height approx. 1 m, n=6). The
Fig. 1. Schematic overview of the methodological approach. H218O
labelling enabled us to investigate the effect of drought on the speed of the link between below- and aboveground processes by tracing 18O from soil
to leaf water, and to investigate its subsequent effect on C18OO released
by leaves and soils. Insert: Schematic traverse section of the substomatal cavity in a deciduous leaf: CA facilitates the exchange of oxygen isotopes between water and dissolved CO2 at the evaporative front in leaves.
Therefore, CO2 which retrodiffuses from the leaf back to the atmosphere
(the proportion of CO2 that has not been used for photosynthesis) is
naturally enriched in 18O compared with atmospheric CO 2.
growth cabinet was set to a constant day/night cycle (18–22 °C) with a light period of 15 h. The highest light intensity was programmed between 10 a.m. and 6 p.m. with a maximal photosynthetic active radiation of 600 μmol m–2 s–1. Gas exchange was monitored using six custom-made soil/shoot chambers, which entirely enclosed the shoot and soil compartment of each beech sapling (soil cham-ber cylinder: length=250 mm, diameter=297mm, volume=17.7 l; shoot chamber cylinder: length=800 mm, diameter=292 mm, vol-ume=56.6 l). A gas-tight separation between both chamber com-partments enabled an independent measurement of above- and belowground gas exchange. Each combined soil/shoot chamber was equipped with sensors for relative humidity, soil moisture, and air, leaf, and soil temperature. Two fans inside each shoot chamber ensured air mixing within the respective canopy. Soil and shoot chambers were continuously flushed in order to maintain steady-state conditions. Air subsamples were taken from the chamber outlets and directed to laser spectrometers, which quantified mix-ing ratios and the isotopic composition of CO2 and H2Ov at a rate of 0.5 Hz. The respective chamber inlets and outlets were measured alternately for 140 s each, of which the average was used for further calculations. All chambers were measured successively within a continuous measurement sequence. Three replicates were subjected to drought, and the remaining three replicates served as controls. The measurement set-up resulted in a temporal resolu-tion of one measurement h–1 of each soil and shoot subdivision of all six chambers. Real-time data acquisition/processing as well as the control of instruments, calibration units, chambers, valves and sensors was accomplished with a custom-written LabVIEW program (LabVIEW, National Instruments, Austin, TX, USA). For more details on the entire measurement set-up, see Barthel et al. (2011b). Gas-exchange parameters such as photosynthesis and transpiration were calculated according to von Caemmerer and Farquhar (1981).
Instrumentation
Oxygen stable isotope ratios are reported relative to the Vienna Standard Mean Ocean Water scale (V-SMOW) using the δ notation (‰):
δ18O sample 1 V-SMOW
= R −
R (1)
where Rsample and RV-SMOW denote the 18O/16O ratio of the sample and the standard, respectively.
CO2 isotope analyser A commercially available pulsed quantum cas-cade laser absorption spectrometer (Aerodyne Research, Billerica, MA, USA) was used to simultaneously measure the CO2 isotopo-logues 12C16O2, 13C16O2, and 12C16O18O at a rate of 0.5 Hz by scanning across three spectral lines near 4.3 μm (2310 cm–1). The measure-ment was based on two optical multiple pass absorption cells with stabilized pressure and temperature using a spectral ratio method (Nelson et al., 2008). Furthermore, the laser system was equipped with an infrared detector cooled with liquid nitrogen. System opera-tion was fully automated using an automated liquid nitrogen refill-ing device (liquid N2 Microdosrefill-ing system #905; Norhof, Maarssen, The Netherlands) and a self-made calibration unit. Throughout the measurement sequence, calibration was done approximately once h–1 for 6 min in three consecutive steps. First, a dilution calibration was performed to correct for the instrument’s non-linear CO2 con-centration dependence of isotope ratio measurements. Secondly, two calibration gases with known mixing ratios were measured for a two-point calibration. Thirdly, a quality-control standard gas was measured to check the long-term stability of the calibrated instru-ment. The 1σ standard deviation of repeated quality-control stand-ard measurements was ±0.23‰ for δ18O and ±0.09 ppm for CO2 concentrations. A detailed description of the quantum cascade laser absorption spectrometer calibration strategy and system operation can be found in Sturm et al. (2012).
Water vapour isotope analyser A commercially available water vapour isotope analyser (WVIA; DLT-100, Los Gatos Research, Mountain View, CA, USA), based on off-axis integrated cavity out-put spectroscopy, was used for the simultaneous measurement of the three water isotopologues H216O, H218O, and 2H1H16O. The laser scanned over three nearby absorption lines at a wavelength of ~1.389 μm. The WVIA was calibrated using a self-made calibration system involving a piezoelectric droplet generator. The 1σ standard deviation of repeated quality-control standard measurements was ±0.23‰ for δ18O and ±92 ppm for H2Ov concentrations. For more information on the WVIA, see Sturm and Knohl (2010).
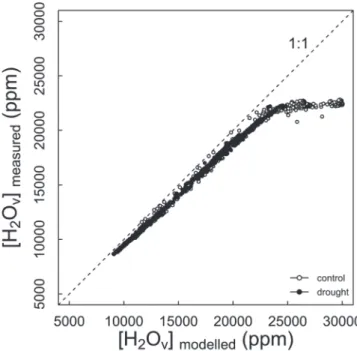
As H2Ov concentration measurements are prone to condensation events, WVIA measurements at the shoot chamber outlets were verified by modelling H2Ov concentrations within the shoot cham-ber using sensors for air temperature and relative humidity (Buck, 1981). In general, very good agreement between both approaches was observed (Fig. 2). However, at very high H2Ov concentrations (>22 000 ppm), the linear relationship was lost, which may point to condensation events during these measurements. The effect of condensation on the 18O measurements would have underestimated the enrichment by a maximal 2‰, which is minor considering the strong label intensity (see Supplementary information at JXB online for derived error estimation). Note that this error affected mainly control measurements, since transpiration and thus relative humid-ity inside the shoot chambers were higher. As air temperature and relative humidity were only measured in the shoot chambers, such independent verification could not be done for soil chamber H2Ov measurements.
Watering with labelled water (H218O)
Prior to H218O application, soils of three replicates were gradually dried during approximately 20 d before the start of the experiment. Once plants achieved the desired stress level, about 30 ml of water was added daily to maintain the stress and prevent mortality. At the label day, all soils were simultaneously irrigated with 400 ml of 18O-labelled water (δ18O=449 ± 7‰) at 11 a.m. to induce a sudden change in δ18O value of soil water. For comparison, the δ18O of
Fig. 2. Relationship between water vapour concentrations modelled from air temperature and the relative humidity sensor inside the shoot chamber and directly measured water vapour concentrations. Control treatment is shown by open symbols, drought treatment by closed symbols, and x=y by a dashed line.
local tap water used for regular daily irrigation was –11.05 ± 0.24‰. Subsequent to the H218O watering, the change in 18O/16O of CO2 and H2Ov fluxes was monitored in shoot and soil compartments of each replicate using the isotope gas-exchange data from both the WVIA and the CO2 isotope analyser.
Data processing
Since replicates were measured successively, the data were half-hourly linearly gap filled in order to achieve consistent time intervals for averaging. By averaging the gap-filled data, a single timeline could be obtained. Because of disturbance effects dur-ing label application, isotope data for this time period (1 h) was removed from further analysis. H2Ov measurements were filtered according to plausibility (WOUT – WIN>0 must be true, where WOUT is water vapour mole fraction at the chamber outlet, equiva-lent to atmospheric H2Ov, and WIN is the water vapour mole frac-tion at the chamber inlet). Moreover, isotope data were filtered for daytime values only, as night-time measurements were prone to condensation in the tubing because of lower temperatures in the growth cabinets. All data were analysed and processed using the statistical software R 2.15.1 (R Development Core Team, 2011). Results are always shown as the mean±standard error (SE) (n=3) per treatment.
Isotope modelling
In order to assess the 18O equilibrium at leaf and soil levels, directly measured 18O in CO2 was compared with the theoretically expected values, which can be modelled from 18O measurements in H2Ov.
Leaf component The isotopic composition of leaf water 18O at the evaporative front (δE) is generally enriched compared with the source water (Gonfiantini et al., 1965), depending on the gradient between atmospheric water vapour pressure (ea) and the water vapour pres-sure within the leaf (el). Assuming non-steady-state conditions, leaf water enrichment at the evaporative front can be modelled as:
δE δT ε εK δV δT εK a l
= + *+ +( − − )e
e (2)
The equation is based on a model of evaporative enrichment by
Craig and Gordon (1965), originally developed for free water sur-faces, where δT and δV are the isotopic composition of the transpira-tional flux and of atmospheric water vapour, respectively. Replacing source water δ18O with δT allows the assessment of δE under non-steady-state conditions (Harwood et al., 1998; Gillon and Yakir, 2000b). This assumption is essential for our set-up as the isotopic composition of source water is constantly changing after labelling with H218O. Modelling leaf water enrichment at the evaporative front usually also accounts for the Péclet effect. The Péclet effect describes the convection of unenriched leaf vein water towards the evapora-tive sites, hence counteracting evaporaevapora-tive enrichment (Farquhar and Lloyd, 1993; Cernusak and Kahmen, 2013). However, since a strong 18O label was used for watering, we assumed the Péclet effect to be negligible in modelling δE. The parameter εK in Eqn (2) denotes the kinetic fractionation during water vapour diffusion from the leaf intercellular airspaces to the atmosphere, and is obtained from the relative contributions of leaf stomatal (gs) and leaf boundary layer conductance to H2Ov (gb, set constant to 1.42 mol m–2 s–1; Luz et al.,
2009): εk s b s b = + + − − − − 28 1 22 1 1 1 g g g g . (3)
The equilibrium fractionation ε* between liquid water and water vapour at the air–water interfaces is expressed as a function of leaf temperature (Tl, in Kelvin) according to Horita and Wesolowski (1994): ε *= −. + . . . − + 7 685 6 7123 103 1 6664 1026 0 3 Tl Tl 55041 1039 Tl . (4) The δ18O signal of transpiration fluxes (δT) was calculated using an isotopic mass balance equation:
δT δOUT W OUT δIN W IN OUT IN = − − − W − W W W , (5)
where WIN and WOUT denote the respective mole fractions at cham-ber inlet and outlet. Similarly, δIN-W and δOUT-W denote the respec-tive 18O isotopic compositions of H2Ov at chamber inlet and outlet. According to theory, leaf or soil water 18O composition is passed on to CO2 due to the following isotopic equilibrium reaction of CO2 with H2O:
H O218 ( )l +CO2(g)↔H++ HCO O218 (aq)↔H O2 (l)+CO O18 (g). −
In leaves, the reaction is catalysed by the enzyme CA, which facili-tates CO2 hydration and 18O exchange. Assuming full CA-catalysed isotopic equilibrium of CO2 with leaf water, the water oxygen iso-topic composition at the evaporative front (δE) should correspond directly to that of dissolved CO2, when accounting for the equilib-rium fractionation between H2O and CO2. This oxygen isotopic equilibrium is expressed by: δL=δE+εW, (6) with εW l =17604−17 93 T . , (7)
where δL is the oxygen stable isotope composition of CO2 at the evaporative front and εW is the equilibrium fractionation between H2O and CO2 (Brenninkmeijer et al., 1983). Based on this assump-tion, the theoretical discrimination (18Δmod-simple) can be modelled by accounting for the weighed mean of diffusive 18O fractionations occurring during CO2 diffusion out of the leaf (ā=7.4‰) and the retroflux r following Farquhar et al. (1993):
18∆
mod simple− = +a r
(
δL−δA)
(8)Farquhar et al. (1993) described the retroflux factor r math-ematically as r=Cc/(Ca – Cc), where Ca and Cc denote the CO2 concentration in the atmosphere and at the site of carboxyla-tion, respectively. This equation illustrates that an estimation of r is challenging, as it requires a very good estimate of stomata as well as mesophyll conductance to CO2, since they determine the magnitude of Cc and hence r. However, a precise estimate of Cc was not possible with this experimental set-up. Therefore, a sensitivity analysis was done across a range of different r val-ues. The r sensitivity analysis was based on the general assump-tion that only one-third of the CO2 that diffuses into the leaf is consumed by photosynthesis (Ciais et al., 1997; Tans, 1998;
Yakir and Sternberg, 2000; Yakir, 2003). Therefore, the range of r was chosen to be between 1.9 and 2.1. In addition, a sec-ond sensitivity analysis was csec-onducted where the original model from Farquhar et al. (1993) was extended to account for θ, the extent of 18O equilibrium between H2O and CO2, which can range between 0 and 1, implying a 0–100% isotopic equilibrium, respectively (Yakir, 2003):
18∆ Θ 1 Θ 1
mod extended− = +a r eq
(
δL−δA)
− −(
eq)
a r/( )
+ (9) Finally, 18Δ can be also obtained from direct measurements of 18O in CO2 following Evans et al. (1986):18 1000 ∆mea OUT C IN C OUT C OUT C IN C = − + − − − − − − − ξ δ δ δ ξ δ δ ( ) ( ), (10) with ξ = − C C C IN IN OUT ( ), (11)
where ξ is the ratio of CO2 entering the chamber compared with the photosynthetic flux with CIN and COUT denoting the respective CO2 mole fractions at chamber inlet and outlet and δIN-C and δOUT-C the corresponding 18O isotopic compositions of CO2 at chamber inlet and outlet.
Soil component The isotopic composition of soil water at the evapo-rative surface (δES) was calculated in accordance with Eqn (2). To calculate the soil equilibrium fractionation factor (ε*soil) and the saturation water vapour pressure in the soil (es), leaf temperature was substituted by soil temperature. Soil kinetic fractionation, εk soil was set constant at 28.5‰ after Merlivat (1978). The δ value of soil respiration (δSR-mod) was modelled assuming a 100% equilibration of 18O between soil H2O and CO2 using δES and a soil kinetic fractiona-tion (ās) of 8.8‰ according to Miller et al. (1999):
δSR mod− =δES+εws− as (12) with εws calculated according to Eqn (7) using soil temperature. Finally, soil evaporation (δEV) and soil respiration fluxes (δSR) were calculated according to Eqn (5) using data from H2Ov and CO2, respectively.
Results
Experimental pre-requisites and conditions before water addition
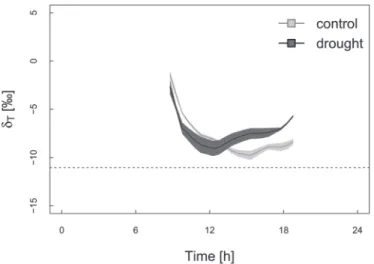
The analysis presented here is based upon the assumption that
δT reflects the δ value of source water, which should hence be
close to the δ value used for daily irrigation. Figure 3 shows the diurnal cycle of δT for control and drought treatment dur-ing the pre-label day. Durdur-ing the period of highest light inten-sity (10 a.m. to 6 p.m.), δT was slightly more enriched than tap water (11.05 ± 0.24‰) with marginally more enrichment
in drought treatments during the afternoon. This relatively small deviation of measured δT from tap water values showed that δT approximately reflected source water values. The slightly more enriched δT value under drought conditions was probably caused by a stronger evaporative enrichment of soil water (source water).
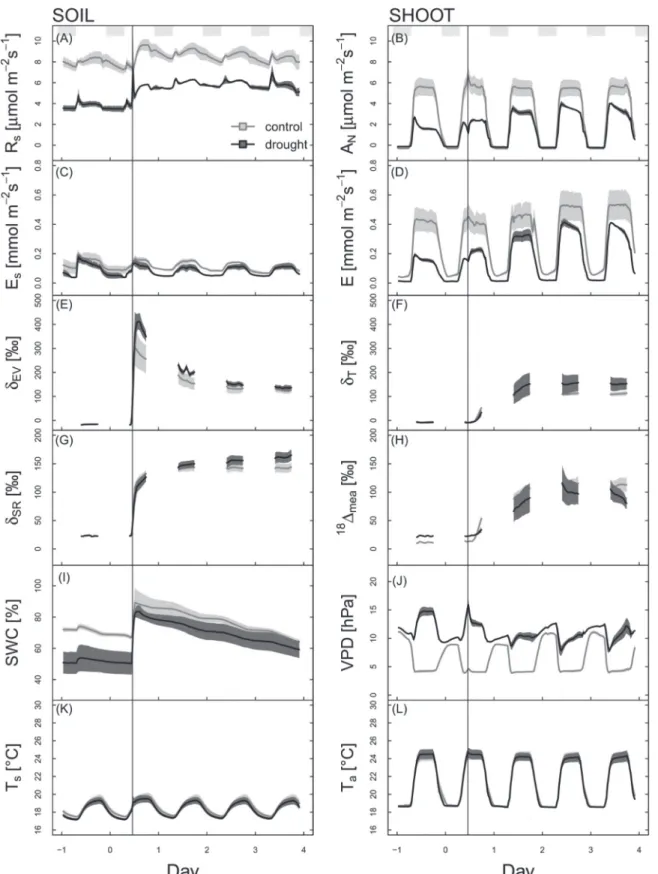
Programmed diel cycles for the growth cabinets resulted in comparable diel cycles for soil and air temperatures across treatments (Fig. 4K, L). Before adding H218O to the soil, soil
water content (SWC) of drought treatments was approximately 25% lower than that of control treatments. Withholding water reduced soil respiration (Rs) to 48%, photosynthesis (AN) to
30%, evaporation (Es) to 83%, and transpiration (E) to 37%
compared with control values during the period of highest light intensity (Fig. 4A–D). Vapour pressure deficit (VPD) remained constantly higher in drought treatment, even after watering, but the diel cycle became less resolved (Fig. 4J).
Effect of drought on the speed of link between below- and aboveground processes
H218O labelling resulted in an immediate increase in SWC
(Fig. 4I). Concurrently, a distinct enrichment in δ18O values of
soil evaporation (δEV; Fig. 4E) and soil respiration (δSR; Fig. 4G) was observed across treatments. The δEV of drought treatments increased rapidly to 412‰, which closely mirrors the δ value of
the water used for labelling (δ18O=449 ± 7‰). In contrast, the
maximum δEV of control treatments reached only ~304‰, prob-ably due to dilution effects caused by the higher SWC. Over the course of the experiment, δEV decreased to about 122‰ (con-trol) and 134‰ (drought), probably due to mixing effects with non-labelled soil water. Furthermore, soil respiration increased above pre-labelling levels in both treatments (Fig. 4A).
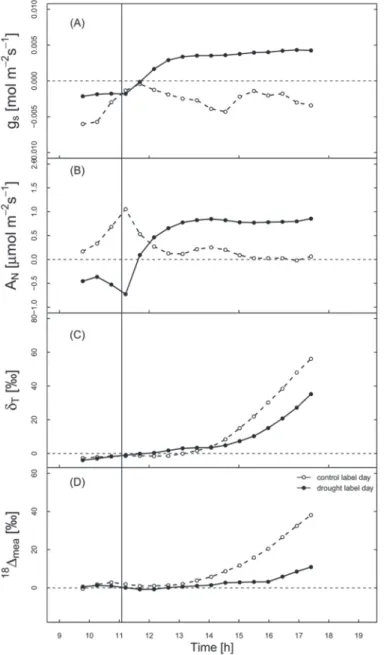
In the shoot, a coincident increase in AN and gs was
appar-ent in drought treatmappar-ents instantly after labelling, whereas the control showed no consistent response (Fig. 5A, B). However, this initial watering response of AN and gs levelled
out after 1.5 h and accounted only for a 12% (AN) and 16%
(gs) increase compared with the control. To quantify the speed
of the link between above- and belowground, 18Δmea and δT
were used as independent proxies, taking advantage of their direct derivation from independently measured concentra-tions and 18O/16O ratios of CO
2 and H2Ov, respectively (Eqns
5 and 10). Both treatments displayed a delayed but exponen-tial label-induced 18O enrichment in the transpirational flux
(δT), with a faster increase in control compared with drought treatments (Fig. 5C). Likewise, shoot discrimination against C18OO (18Δ
mea) showed a faster exponential increase in
con-trol compared with drought after labelling (Fig. 5D).
Effect of H218O labelling on C18OO released by soils
and leaves
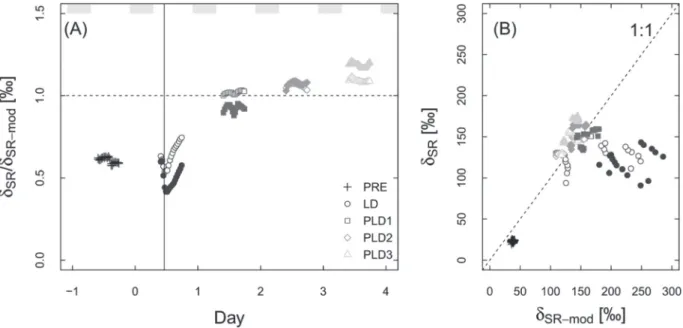
Figure 6A shows that the modelled δ value of soil respiration
(δSR-mod) was mostly overestimating measured δSR, especially during the pre-label and label day. During the pre-label day,
δSR was only 61 ± 2% of δSR-mod in both treatments. During the label day, exchange constantly increased, which resulted Fig. 3. Mean diurnal cycle of δ18O in the transpirational flux (δ
T) during
the pre-label day; means for control and drought treatments are shown by grey and black lines, respectively. Uncertainty is given as ±SE of the mean (shaded areas). For comparison, the δ18O of local tap water used for
in a better agreement between δSR-mod and δSR from post-label d 1–3. However, also at post-label d 1–3, substantial varia-tions around the 1:1 line were still observed, either under- or overestimating δSR by about 50‰ (Fig. 6B).
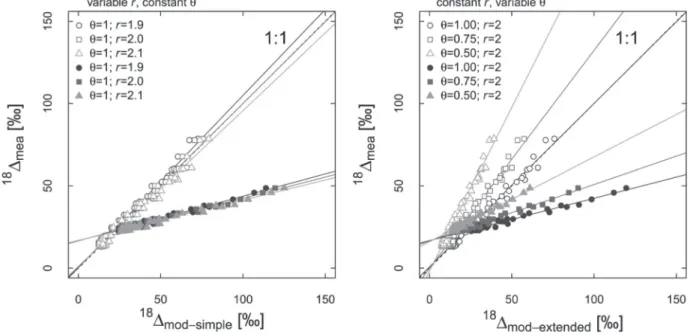
In the shoot, modelled discrimination against C18OO,
based on leaf water enrichment (18Δ
mod-simple; 18Δmod-extended)
predicted very well the measured discrimination against C18OO (18Δ
mea). A strong linear relationship between 18Δmod
Fig. 4. Mean diel cycles of soil-related parameters (left panels) and shoot-related parameters (right panels) during the H218O-labelling (vertical black line)
experiment for (A) soil respiration (Rs); (B) photosynthesis (AN); (C) evaporation from soil (Es); (D) transpiration from shoot (E); (E) δ18O of soil evaporation (δEV); (F)
δ18O of the transpirational flux (δ
T); (G) δ18O of soil respiration (δSR); (H) discrimination against C18OO at the shoot (18Δmea); (I) relative volumetric soil water content
(SWC); (J) vapour pressure deficit (VPD); (K) soil temperature (Ts); and (L) air temperature in shoot chamber (Ta). Means for control and drought treatments are
and 18Δ
mea was found for both treatments during the label day
(Fig. 7). The slopes between 18Δ
mod and 18Δmea gave an
indica-tion of the extent of 18O equilibrium at the shoot level. The
data suggested that drought reduced the 18O exchange between
CO2 and H2O, as the relationship between 18Δmod and 18Δmea
showed steeper slopes for the control across a given range of r or θ. Choosing r=1.9, 2.0, and 2.1 and θ=1 resulted in
respec-tive slopes of 1.04, 0.99, and 0.95 in the control treatment and 0.27, 0.26, and 0.24 in the drought treatment (Fig. 7A). On the other hand, choosing θ=1, 0.75, and 0.5 and r=2.0
resulted in respective slopes of 0.99, 1.32, and 1.99 in the con-trol treatment and 0.26, 0.34, and 0.51 in the drought treat-ment (Fig. 7B). Hence, reducing θ to 0.5 with r=2.0 caused
a doubling in slope. All regressions showed R2>0.97 and
P<0.001. Note that a decrease of r under drought conditions
would produce an increase in the slope but also unrealistic results, as a certain proportion of the values would fall above the 1:1 line, hence implying an unrealistic exchange of more than 100%. On the other hand, increasing r would result in even smaller slopes under drought conditions. In conclusion, under realistic conditions, slopes were always lower in the drought compared with the control treatment at any given
r or θ.
Discussion
In soils, the increased 18O signal caused by labelling was not
transferred instantaneously from H2O to CO2, which was
reflected in the poor agreement between the modelled and measured isotopic signature of soil respiration. This discrep-ancy between modelled and measured values is most likely due to the simple model approach used assuming instantane-ous exchange and constant kinetic fractionation. In the fol-lowing, we will discuss the importance of these two model parameters on our results.
We assumed an instantaneous exchange at the soil level since recent field studies found a considerable CA activity in soils, evidenced by instantaneous 18O exchange in soils (Seibt
et al., 2006; Wingate et al., 2008) and carbonyl sulfide uptake from soils (Kesselmeier et al., 1999; Kesselmeier and Hubert, 2002). Such instantaneous equilibrium in soils would be in line with the common instantaneous exchange in plant leaves. However, this subject is far from settled. In principle, 18O
exchange between CO2 and H2O is just a function of
temper-ature (Tans, 1998) and occurs only after hydration of the dis-solved CO2 to carbonic acid (Mills and Urey, 1940) with a rate
constant of 0.012 s–1 (Skirrow, 1975; Tans, 1998). Apart from
soil water, Stern et al. (1999) found that the isotopic signature of soil CO2 is mainly influenced by the rate constant of the
isotopic exchange but also by soil-filled pore space and tor-tuosity. The latter two are mainly interfering with the kinetic fractionation from diffusion, and thus dry soils are likely to produce different kinetic fractionation compared with wet soils. To avoid underestimation of this effect, we assumed a maximal theoretical value of 8.8‰ (Miller et al., 1999) in both treatments. Several earlier works have elaborated on the correct prediction of the isotopic signature of soil CO2
including effects related to the invasion flux from atmosphere to soil (Stern et al., 2001), effects from the soil water bound to soil surfaces (Miller et al., 1999), or effects from the near sur-face gradient of soil water 18O (Riley, 2005). Thus, predicting δSR under different environmental conditions is complex as it involves a number of physical and chemical uncertainties that are hard to quantify. The labelling approach did not result in significant differences between dry and wet soils, although a strong isotopic shift was induced. Considering the time it took until a new isotopic equilibrium was established let us suggest that 18O equilibrium was not instantaneous in soils,
which in turn points to a reduced CA activity. However, the extent of CA reduction within soils cannot be deduced from the data, and additional experiments are needed.
Fig. 5. Immediate response during the label day in quantitative differential to the preceding non-label day for: (A) stomatal conductance (gs); (B)
photosynthesis (AN); (C) δ18O of the transpirational flux (δT); and (D)
measured discrimination against C18OO at the shoot level (18Δ
mea). H218O
labelling is shown by a vertical black line, control treatment by open symbols, drought by closed symbols, and zero by a horizontal dashed line.
In the shoot, H218O labelling caused a rapid increase of AN and gs of drought treatments within 30 min. Such a fast
ecophysiological response is in strong accordance with an irrigation experiment done in a Swiss forest with 115-year-old beech trees, where a rapid response (within 6 min) of the xylem sap flow rate was measured upon irrigation of previ-ously drought-stressed trees (Cermak et al., 1993). A simi-lar response has been also described for 3- to 6-month-old
Eucalyptus pauciflora saplings, where a fast response of AN
and gs to rewatering within 5–60 min was identified after
drought (Kirschbaum, 1988). Moreover, our observed rapid reaction of AN and gs was not accompanied by the arrival of
labelled water molecules, which occurred later. Furthermore,
δT and 18Δ showed independently that drought also delayed
the transport of water from below- to aboveground, thus affecting the 18O signal propagation from soil to shoot. The
observed, slightly higher stomatal conductance after H218O
labelling could therefore not compensate for the slower movement of molecules through the xylem. A reduced sap flow under drought conditions has also been confirmed in field studies for Fraxinus excelsior L. (Stöhr and Lösch, 2004), Betula pendula, and Picea abies (Gartner et al., 2009). According to Nadezhdina (1999), sap flow can even be used as a proxy for whole-plant water status.
Upon arrival of labelled H2O molecules in the shoot,
almost instantaneous 18O exchange between H
2O and CO2
was found in both treatments as had been indicated by a strong relationship between 18Δ
mod and 18Δmea. According
to the theory, instantaneous 18O equilibrium between H 2O
and CO2 is facilitated by CA. CA is ubiquitous in leaves
and found predominantly in leaf chloroplasts, which are generally located (to facilitate gas exchange) close to the sites of evaporative enrichment (Yakir, 2003). Furthermore, CA has a turnover rate of up to 106 s–1, which is one of
the fastest known enzymatic reactions (Silverman, 1982). In the 1990s, studies on δA generally assumed a full isotopic equilibrium between CO2 and H2O for both leaves and soil
(Francey and Tans, 1987; Farquhar et al., 1993; Yakir and Wang, 1996; Ciais et al., 1997), which was then fundamen-tally refuted by Gillon and Yakir (2001). They showed marked differences among different plant taxa and physio-logical groups, resulting in an overall global weighed mean with θ=0.78. Among groups, C3 plants showed the highest equilibrium rates with θ>0.95 in 26 out of 39 species. This
was contrasted by a θ of only 0.38 in C4 grasses (Gillon and Yakir, 2000a, 2001). In C3 trees, an average θ was estimated
at 0.93, which is similar to the range observed in this study under control conditions for beech (0.93–0.98). After the paper by Gillon and Yakir (2001), a number of papers con-firmed these findings. For instance, Cernusak et al. (2004) estimated θ in Ricinus communis during leaf dark
respira-tion and photosynthesis at 0.8 and 1, respectively. However, Edwards et al. (2007) showed that the low CA activity in C4 grasses could also be a characteristic physiological trait
of the PACCAD clade of grasses, which also include C3
grasses.
The data presented here suggest that drought reduces the 18O exchange between CO
2 and H2O at the shoot level
across a range of different retroflux intensities and θ values.
The reduced extent of 18O equilibrium under drought is in
accordance with Guliyev et al. (2008), who found a reduction in CA activity after a long drought period in wheat. Among potential environmental influences on CA activity, so far only irradiation has been shown to have an effect on the hydra-tion efficiency in leaves, as shown by Cousins et al. (2006). Since an integrated shoot approach was chosen in our study for estimating the extent of 18O equilibrium at the shoot level,
intraleaf variations of CA activity as observed in Zea mays Fig. 6. (A) Ratio between the δ18O of modelled soil respiration (δ
SR-mod) based on δEV and the measured δ18O of soil respiration (δSR) over the course of
the experiment. Data shown are mean half-hourly values from each treatment. (B) Corresponding relationship between δSR-mod and δSR. Control treatment
is shown by open symbols, drought treatment by closed symbols, and x=y by a dashed line. PRE, pre-label day; LD, label day; PLD, post-label day. Data shown are individual measurements from each treatment.
can be dismissed (Affek et al., 2006; Griffis et al., 2011). It should be noted that the 18O equilibrium presented here is
rather an apparent equilibrium, which also summarizes effects that result from measuring an entire shoot. Thus, the measurements include effects from stem respiration, shading, etc., which are not present when measuring single leaves as done in most other laboratory studies.
In a model approach, Xiao et al. (2010) pointed out the need for a better understanding of environmental controls on CO2
hydration efficiency, as they concluded that only θ=0.46 was
able to logically explain the disagreement between simulated and observed 18O isoforcing for a soybean field. Low θ values
have been confirmed during other field measurements in C3
ecosystems (F. sylvatica) with a chamber approach (θ=0.7;
A. Hammerle, L. Gentsch, P. Sturm, M. Barthel, R. Siegwolf, N. Buchmann, and A. Knohl, unpublished data). Using eddy covariance measurements, Griffis et al. (2011) further showed for a C4 ecosystem that θ can markedly differ when estimating θ for the canopy scale (θ=0.2) compared with the leaf scale
(θ=0.7).
Overall, we showed that H218O labelling in combination
with laser spectroscopy can be used to investigate the speed of the link between below- and aboveground processes under drought conditions by measuring the 18O/16O ratio in CO
2
and H2Ov. We conclude that drought impairs the 18O signal
propagation from below- to aboveground and reduces the
18O equilibrium between CO
2 and H2O at the shoot level.
An instantaneous 18O exchange as observed in the shoot was
not present in the soil. To summarize, drought stress affects C18OO fluxes within the soil–plant–atmosphere system at
different temporal and spatial scales, highlighting complex interactions between different components. Despite the existing published research body, there is need for further
experimental work to constrain model approaches such as those of Riley et al. (2002, 2003). With the fast develop-ment of optical measuredevelop-ment techniques for isotope research (reviewed by Griffis, 2013), there is a promising basis for extended research in this area.
Supplementary data
Supplementary data are available at JXB online.
Supplementary information. Potential error estimation on
δ value from condensation.
Acknowledgements
The authors thank P. Plüss, P. Flütsch, and T. Baur for their outstand-ing technical support and help concernoutstand-ing the measurement set-up. The authors also acknowledge R.A. Werner for liquid water laser measurements, A. Ackermann for IRMS measurements at the Isolab of the Grassland Sciences Group at ETH Zurich, and four anonymous reviewers improving the overall quality of the manuscript. This work was supported by a ‘Marie Curie Excellence Grant’ granted by the European Commission to AK (MEXT-CT-2006–042268) and by a start-up grant from ETH Zurich to AK. The Crown Research Institute (CRI) Landcare Research is acknowledged for salary for MB to finalize this manuscript.
References
Affek HP, Krisch MJ, Yakir D. 2006. Effects of intraleaf variations in carbonic anhydrase activity and gas-exchange on leaf C18OO isoflux in Zea
mays. New Phytologist 169, 321–329.
Barthel M, Hammerle A, Sturm P, Gentsch L, Baur T, Knohl A. 2011a. The diel imprint of leaf metabolism on the δ13C signal of soil
respiration under control and drought conditions. New Phytologist 192, 925–938.
Barthel M, Sturm P, Knohl A. 2011b. Soil matrix contamination and canopy recycling did not impair 13CO
2 plant-soil pulse labeling
experiments. Isotopes in Environment and Health Studies 47, 1–13. Fig. 7. Left: Relationship between simple modelled discrimination against C18OO (18Δ
mod-simple) versus measured discrimination against C18OO (18Δmea) in
the shoot. Right: Relationship between extended modelled discrimination against C18OO (18Δ
mod-extended) versus measured discrimination against C18OO
(18Δ
mea) in the shoot. Control treatment is shown by open symbols, drought treatment by closed symbols, and x=y by dashed lines. θ, 18O equilibrium;
r, retroflux factor. Results are shown as least squares linear regressions (solid lines, all R2>0.97 and P<0.001). Data shown are individual measurements
Bowling DR, McDowell NG, Welker JM, Bond BJ, Law BE, Ehleringer JR. 2003. Oxygen isotope content of CO2 in nocturnal
ecosystem respiration: 2. Short-term dynamics of foliar and soil component fluxes in an old-growth ponderosa pine forest. Global Biochemical Cycles 17, 1124.
Brenninkmeijer CAM, Kraft P, Mook WG. 1983. Oxygen isotope fractionation between CO2 and H2O. Isotope Geoscience 1, 181–190.
Buck AL. 1981. New equations for computing vapor-pressure and enhancement factor. Journal of Applied Meteorology 20, 1527–1532. Cermak J, Matyssek R, Kucera J. 1993. Rapid response of large, drought-stressed beech trees to irrigation. Tree Physiology 12, 281–290. Cernusak LA, Farquhar GD, Wong SC, Stuart-Williams H. 2004. Measurement and interpretation of the oxygen isotope composition of carbon dioxide respired by leaves in the dark. Plant Physiology 136, 3350–3363.
Cernusak LA, Kahmen A. 2013. The multifaceted relationship between leaf water 18O enrichment and transpiration rate. Plant, Cell & Environment
36, 1239–1241.
Ciais P, Denning AS, Tans PP, et al. 1997. A three-dimensional synthesis study of δ18O in atmospheric CO
2 1. surface fluxes. Journal of
Geophysical Research 102, 5857–5872.
Cousins AB, Badger MR, von Caemmerer S. 2006. A transgenic approach to understanding the influence of carbonic anhydrase on C18OO discrimination during C
4 photosynthesis. Plant Physiology 142,
662–672.
Craig H, Gordon LI. 1965. Deuterium and 18O variations in the ocean
and marine atmosphere. Pisa, Italy: Consiglio Nationale Delle Ricerche Laboratorio Di Geologia Nucleare.
Edwards EJ, Still CJ, Donoghue J. 2007. The relevance of phylogeny to studies of global change. Trends in Ecology and Evolution 22, 243–249. Evans JR, Sharkey TD, Berry JA, Farquhar GD. 1986. Carbon isotope discrimination measuered concurrently with gas exchange to investigate CO2 diffusion in leaves of higher plants. Australian Journal for Plant
Physiology 13, 281–292.
Farquhar G, Lloyd J. 1993. Carbon and oxygen isotope effects in the exchange of carbon dioxide between terrestrial plants and the atmosphere. In: Ehleringer JR, Hall AE, Farquhar G, eds. Stable isotopes and plant carbon–water relations., San Diego, CA: Academic Press, 47–70. Farquhar GD, Lloyd J, Taylor JA, Flanagan LB, Syvertsen JP, Hubick KT, Wong SC, Ehleringer JR. 1993. Vegetation effects on the isotope composition of oxygen in atmospheric CO2. Nature 363,
439–442.
Francey RJ, Tans PP. 1987. Latitudinal variation in oxygen-18 of atmospheric CO2. Nature 327, 495–497.
Gartner K, Nadezhdina N, Englisch M, Cermack J, Leitgeb E. 2009. Sap flow of birch and Norway spruce during the European heat and drought in summer 2003. Forest Ecology and Management 258, 590–599. Gillon J, Yakir D. 2000a. Naturally low carbonic anhydrase activity in C4
and C3 plants limits discrimination against C18OO during photosynthesis.
Plant, Cell & Environment 23, 903–915.
Gillon J, Yakir D. 2000b. Internal conductance to CO2 diffusion and
C18OO discrimination in C
3 leaves. Plant Physiology 123, 201–213.
Gillon J, Yakir D. 2001. Influence of carbonic anhydrase activity in terrestrial vegetation on the 18O content of atmospheric CO
2. Science 291,
2584–2587.
Gollan T, Passioura JB, Munns R. 1986. Soil water status affects the stomatal conductance of fully turgid wheat and sunflower leaves. Australian Journal of Plant Physiology 13, 459–464.
Gonfiantini R, Gratziu S, Tongiorgi E 1965. Oxygen isotope composition of water in leaves. In Isotopes and radiation in soil–plant nutrition studies. Vienna, Austria: International Atomic Energy Agency, 405–410.
Granier A, Reichstein M, Breda N, et al. 2007. Evidence for soil water control on carbon and water dynamics in European forests during the extremely dry year: 2003. Agricultural and Forest Meteorology 143, 123–145.
Griffis TJ. 2013. Tracing the flow of carbon dioxide and water vapor between the biosphere and atmosphere: A review of optical isotope techniques and their application. Agricultural and Forest Meteorology 174–175, 85–109.
Griffis TJ, Lee X, Baker JM, Billmark K, Schultz N, Erickson M, Zhang X, Fassbinder J, Xiao W, Hu N. 2011. Oxygen isotope composition of evapotranspiration and its relation to C4 photosynthetic discrimination.
Journal of Geophysical Research-Biogeosciences 116, 1–21.
Guliyev N, Bayramov S, Babayev H. 2008. Effect of water deficit on RUBISCO and carbonic anhydrase activities in different wheat genotypes. Photosynthesis. Energy from the Sun: 14th International Congress on Photosynthesis 91, 1465–1468.
Harwood KG, Gillon JS, Griffiths H, Broadmeadow MSJ. 1998. Diurnal variation of Δ13CO
2, ΔC18O16O and evaporative site enrichment of
δH218O in Piper aduncum under field conditions in Trinidad. Plant, Cell &
Environment 21, 269–283.
Horita J, Wesolowski DJ. 1994, Liquid-vapor fractionation of oxygen and hydrogen isotopes of water from the freezing to the critical temperature. Geochimica et Cosmochimica Acta 58, 3425–3437. Kato T, Nakazawa T, Aoki S. 2004. Seasonal variation of the oxygen isotopic ratio of atmospheric carbon dioxide in a temperate forest, Japan. Global Biochemical Cycles 18, GB2020.
Kayler Z, Gessler A, Buchmann N. 2010. What is the speed of link between aboveground and belowground processes? New Phytologist 187, 886–888.
Kesselmeier J, Hubert A. 2002. Exchange of reduced volatile sulfur compounds between leaf litter and the atmosphere. Atmospheric Environment 36, 4679–4686.
Kesselmeier J, Teusch N, Kuhn U. 1999. Controlling variables for the uptake of atmospheric carbonyl sulfide by soil. Journal of Geophysical Research 104, 11577–11584.
Kirschbaum MUF. 1988. Recovery of photosynthesis from water stress in Eucalyptus pauciflora—a process in two stages. Plant, Cell & Environment 11, 685–694.
Luz B, Barkan E, Yam R, Shemesh A. 2009. Fractionation of oxygen and hydrogen isotopes in evaporating water. Geochimica et Cosmochimica Acta 73, 6697–6703.
Merlivat L. 1978. Molecular diffusitivities of H218O in gases. Journal of
Chemical Physics 69, 2864–2871.
Miller JB, Yakir D, White JWC, Tans PP. 1999. Measurement of
18O/16O in the soil-atmosphere CO
2 flux. Global Biochemical Cycles 13,
761–774.
Mills GA, Urey HC. 1940. The kinetics of isotopic exchange between carbon dioxide, bicarbonate ion, carbonate ion and water. Journal of the American Chemical Society 62, 1019–1026.
Nadezhdina N. 1999. Sap flow index as an indicator of plant water status. Tree Physiology 19, 885–891.
Nelson DD, McManus JB, Herndon SC, Zahniser MS, Tuzson B, Emmenegger L. 2008. New method for isotopic ratio measurements of atmospheric carbon dioxide using a 4.3 µm pulsed quantum cascade laser. Applied Physics B—Lasers and Optics 90, 301–309. R Development Core Team. 2011. R: A language and environment for statistical computing. R Foundation for Statistical Computing, Vienna, Austria. http://www.r-project.org.
Riley WJ. 2005. A modeling study of the impact of the δ18O value of
near-surface soil water on the δ18O value of the soil-surface CO 2 flux.
Geochimica et Cosmochimica Acta 69, 1939–1946.
Riley WJ, Still CJ, Helliker BR, Ribas-Carbo M, Berry JA. 2003. 18O
composition of CO2 and H2O ecosystem pools and fluxes in a tallgrass
prairie: simulations and comparisons to measurements. Global Change Biology 9, 1567–1581.
Riley WJ, Still CJ, Torn MS, Berry JA. 2002. A mechanistic model of H218O and C18OO fluxes between ecosystems and the atmosphere:
model description and sensitivity analyses. Global Biochemical Cycles 16, 1095.
Rühr NK, Offermann CA, Gessler A, Winkler JB, Ferrio JP, Buchmann N, Barnard RL. 2009. Drought effects on allocation of recent carbon: from beech leaves to soil CO2 efflux. New Phytologist 184(4): 950–961.
Schär C, Vidale PL, Lüthi D, Frei C, Häberli C, Liniger MA, Appenzeller C. 2004. The role of increasing temperature variability in European summer heatwaves. Nature 427, 332–335.
Seibt U, Wingate L, Lloyd J, Berry JA. 2006. Diurnally variable δ18O
signatures of soil CO2 fluxes indicate carbonic anhydrase activity in forest
Silverman DN. 1982. Carbonic anhydrase: 18O-exchange catalyzed
by an enzyme with rate contributing proton-transfer steps. Methods in Enzymology 87, 732–752.
Skirrow G. 1975. The dissolved gases-carbon dioxide. In Riley JP, Skirrow G, eds. Chemical oceanography. San Diego, CA: Academic Press, 1–92.
Stern L, Baisden WT, Amundson R. 1999. Processes controlling the oxygen isotope ratio of soil CO2, Analytic and numerical modeling.
Geochimica et Cosmochimica Acta 63, 799–814.
Stern LA, Amundson R, Baisden WT. 2001. Influence of soils on oxygen isotope ratio of atmospheric CO2. Global Biochemical Cycles 15,
753–759.
Stöhr A, Lösch R. 2004. Xylem sap flow and drought stress of Fraxinus excelsior saplings. Tree Physiology 24, 169–180.
Sturm P, Eugster W, Knohl A. 2012. Eddy covariance measurements of CO2 isotopologues with a quantum cascade absorption spectrometer.
Agricultural and Forest Meteorology 152, 73–82.
Sturm P, Knohl A. 2010. Water vapor δ2H and δ18O measurements using
off-axis integrated cavity output spectroscopy. Atmospheric Measurement Techniques 3, 67–77.
Tans PP. 1998. Oxygen isotopic equilibrium between carbon dioxide and water in soils. Tellus 50B: 163–178.
von Caemmerer S and Farquhar GD. 1981. Some relationships between the biochemistry of photosynthesis and the gas-exchange of leaves. Planta 153, 376–387.
Wingate L, Seibt U, Maseyk K, Ogee, J, Almeida P, Yakir D, Pereira JS. 2008. Evaporation and carbonic anhydrase activity recorded in oxygen isotope signatures of net CO2 fluxes from a Mediterranean soil. Global
Change Biology 14, 2178–2193.
Xiao W, Lee X, Griffis TJ, Kim K, Welp LR, Yu Q. 2010. A modeling investigation of canopy-air oxygen isotopic exchange of water vapor and carbon dioxide in a soybean field. Journal of Geophysical Research 115, G01004. Yakir D. 2003. The stable isotopic composition of atmospheric CO2. In:
Keeling RF, ed. Treatise on Geochemistry, Vol. 4. The Atmosphere. Oxford: Elsevier, 175–205.
Yakir D, Sternberg LSL 2000. The use of stable isotopes to study ecosystem gas-exchange. Oecologia 123, 297–311.
Yakir D, Wang XF. 1996. Fluxes of CO2 and water between terrestrial
vegetation and the atmosphere estimated from isotope measurements. Nature 380, 515–517.