Early Moderate Malnutrition and the
Development of Sensori-Motor Intelligence
by
P. R. DASEN, PhD, M. LAVALLEE, PhD, J. RETSCHITZKI, PhD
University of Geneva, Switzerland
and
M. REINHARDT, MD
Nestle Foundation, Lausanne, Switzerland
Early Moderate Malnutrition and the
Development of Sensori-Motor Intelligence
by P. R. DASEN,* PhD, M. LAVALLEE, PhD, J. RETSCHITZKI, PhD,University of Geneva, Switzerland and'
M. REINHARDT, MD,
Nestle Foundation, Lausanne, Switzerland
Is there a relationship between the nutritional status of a child and his cognitive development? Many studies have already attempted to answer this deceivingly simple question; as our knowledge increases, the problem appears to be more and more complex. We do not wish to add another summary of the area to an already long list (e.g. Segall, 1970; Cravioto, 1970; Latham & Cobos, 1971; Kaplan, 1972; Ricciuti, 1973; Klein, Habicht & Yarborough, in press; and three conference proceedings edited by Scrimshaw & Gordon, 1968; Kallen, 1973; Cravioto, Hambraeus & Vahlquist, 1974; Brazier, 1975).
Even though no single study conforms to all the methodological criteria proposed by Kaplan (1972), there has been a sufficient accumulation of data to form the consensus of opinion that severe malnutrition affects intellectual development, especially if it occurs during the first six months of life, or possibly in the first two years. In this case, the detrimental effects seem to be irreversible (Monckeberg, 1968), whereas the effects of malnutrition occurring later in life seem to be less permanent. The mechanisms of these effects are not yet clearly established. Two contrasting models are generally proposed (Cravioto, 1970; Kaplan, 1972; Latham & Cobos, 1971; Warren,
1970):
1) malnutrition could directly affect the maturation of the brain, especially during its period of maximum growth;
2) malnutrition could affect the intellectual development indirectly, by producing a deprivation of stimulation and activity. Furthermore, malnutrition is usually associated with socio-economic variables, and *Now at the University of Nairobi, Bureau of Educational Research, P.O. Box 30197, Nairobi, Kenya.
This paper was first presented at the Second Pan-African Conference on Psychology of the International Association for Cross-Cultural Psychology, Nairobi, Kenya, Dec. 29,
1975-Jan. 2, 1976.
This investigation was supported by a grant from the Fonds National Suisse de la Recherche Scientifique (grant No. 1.7640.72/1.1550.74 to Prof. B. Inhelder) and by the Nestle Foundation for the Study of the Problems of Nutrition in the World. It was carried out in collaboration with Prof. B. Inhelder, University of Geneva,- and with the staff of the Nestle Foundation, in the village of Kpouebo, at the Centre d'Etude d'Adiopodoume (Ivory Coast) and in Lausanne (Switzerland); special thanks are due to Ba-Samba Sylla who contributed to the nutritional survey, and to Claudine Meylan, scientific assistant of the Nestle Foundation, who was helpful throughout the project in many ways.
it is often difficult to separate the causative factors. What are the effects of moderate malnutrition, which, because of its wide extension, is potentially a very important problem? Among the more recent studies, Mora, et al. (1974) have found a correlation between moderate malnutrition and the Griffiths General D.Q., and the same group of researchers in Bogota (Christiansen, et al, 1974) reports that malnutrition reduces the child's activity level, thus limiting its ability to utilize and respond to its environment. They propose a model of reciprocal relationship between malnutrition and environment in which "social structural variables lead to infant malnutrition, which in turn lowers caretaker responsiveness due to apathy or hyperexcitability of the infant" (p. 195). Cobos (1972) and Christiansen, et al. (1974) briefly report "indications of retarded stage acquisition" in moderately malnourished subjects, using the Corman & Escalona (1969) scale of sensori-motor intelligence.
Klein, et al. (1974) report a few statistically significant correlations between nutritional status (assessed by anthropometric measurements of height and head circumference) and infant/caretaker interaction in 8 to 16 month-old rural Guatemalan infants. But these measures were also related to an index of socio-economic status (the quality of the family's house). An inconsistent pattern of correlation was also found between these three variables and mental and motor development test scores. The authors conclude that "the association between mild to moderate protein-calorie malnutrition and mental and motor development is not particularly strong. . . . However, the pattern of association for all variables considered suggests that family socio-economic status, infant/caretaker interaction and nutritional status are related in important ways, and that this complex of variables may have an increasingly important role to play in psychological test performance with increasing age".
As a general rule, the results of the few studies of moderate malnutrition are rather ambiguous: some statistically significant correlations appear, but not in any systematic way, Furthermore, other variables, such as socio-economic factors, seem to play a more important role than nutrition per se. It thus seemed important to carry out a study in a socio-economically homogenous population.
The choice of the dependent variables also warrants
some discussion. For many years, most of the studies used Gesell-type infant tests and I.Q. tests for older children. However, D.Q.'s obtained in infants under three years show little correlation with later psychological development (Rutter, 1970; Lewis & McGurk, 1972) and I.Q. tests are of little theoretical value. Additional difficulties of interpretation arise when these tests are applied to populations for which they were not designed and are therefore culturally irrelevant. More recently, the need has been recognized to use more specific psychological measurements. Numerous studies have investigated inter-sensory integration, short and long-term memory, and the most recent studies tend to use a large variety of dependent variables.
One area which has been almost completely neglected in the choice of dependent variables is the developmental psychology of" Jean Piaget, possibly because of the complexity of the theory or because the results of Piagetian tasks (usually ordinal stages) cannot be adequately analyzed with parametric statistics. There are nevertheless some advantages to using tasks or scales derived from Piaget's theory (Tuddenham, 1974), not the least being that they deal with basic intellectual processes.
In this context, the present investigation deals with the possible effects of moderate malnutrition in rural Baoule infants (Ivory Coast), aged 5 to 33 months. The two dependent variables are sensori-motor intelligence and the emergence of the semiotic function. In Piaget's theory, the sensori-motor period is seen as the basis of subsequent cognitive development, and the semiotic function, which enables mental representation (including language), is rooted in sensori-motor activities.
Attention will be paid not only to the cognitive levels reached by the children, but also to their attitude towards the testing situation in view of the fact that malnourished children are often described as passive, apathetic or unresponsive (e.g. DeLicardie & Cravioto, 1974; Christiansen, et al, 1974).
The Samples
The study took place in three villages about 200 km N.W. of Abidjan, Ivory Coast, in an area where the tropical forest gives way to the savannah. The inhabitants of the region are from the Baoule tribe (Akan group) and live mainly from subsistence-level agriculture (yam, plantain, cassava) and from the production of some cash crops (coffee, cocoa). The daily life and customs of the Baoule have been described by Guerry (1970).
Sampling and anthropometric measurements
Initially 66 infants aged 5 to 21 months were selected to form two samples matched for age, but differing in nutritional status; only infants whose date of birth was accurately known were included. Anthropometric measurements were obtained every three months over a period of one year.
Weight/height/age (McLaren & Read, 1972) was used as the determinant indicator of nutritional status; this index is considered to be normal between 90-100%, and to indicate a mild state of malnutrition between 85-90%, moderate malnutrition between 75-85% and severe malnutrition below 75%. Infants having an index below or equal to 85% on all successive measurements (or all but one) were included in sample 1, and infants having index above 85% on all successive measurements (or all but one) were included in sample 2. Seven subjects were discarded from the final analysis because they did not conform to this criterion, and three dropped out for other reasons (illness, departure from the area), leaving final samples of 29 (sample 1) and 27 (sample 2) subjects. Of these, 23 pairs matched on age remain for the final analysis.
The means and standard deviations of the W/H/A index over the five successive measurements are presented in Figure 1. The differences between the means of the two samples are statistically significant at the .001 level. Normal Mild 2 Moderate 5 S W/H.A IOO- 95-- 8595-- 85- 8O- 75-1 2 3 4 5
Means and standard deviations of Weight/height/age (observed weight in percent of ideal weight/height/age) of the two samples over the five successive measurements.
In addition to weight and height, the following anthropometric measurements were used: mid-arm circumference, head circumference, arm/head ratio and chest circumference (Jelliffe, 1966; Kanawati & McLaren, 1970; Waterlow, 1972; Waterlow & Rutishauser, 1974). The means are all significantly different between the two samples at the .001 level for the five successive measurements. A more detailed analysis of the anthropometric data will be published elsewhere.
There is no doubt that the two samples are clearly different as far as the anthropometric measurements are concerned; for sample 1 they all indicate a state of moderate malnutrition, and for sample 2 a normal nutritional status, although the means are still slightly below the 50th percentile of the Harvard standards (Nelson, et al., 1969). Although the difference in nutritional status seems to be clearly established on the basis of these measurements, its causes are not known but are probably multifactorial. For example the equilibrium ofthe body metabolism
and the use of nutritional intake could be different because of individual biological difference, or because of a differential incidence of or response to diseases. The weight at birth and a detailed medical history could not be obtained for our subjects, but some information is available on body metabolism through biochemical tests and a nutritional survey gives some indications of food intake.
Interpretation of biochemical results
The biochemical determinations to be performed are difficult to select properly. In recent years, many attempts were made to establish an international standardization of the biochemical tests for the evaluation of malnutrition (von Muralt, 1969; Jelliffe, 1969; Committee Report, 1970). Previous studies in the same area of the Ivory Coast have indicated the necessity to select a limited number of determinations
easy to perform in the bush, and the methodology of which has already been extensively explored (Ravelli,
1972;Gabbude/a/.. 1975).
Since it was important to establish a good relationship with the mothers and the infants, it was decided to take blood and urine samples only once, in the middle of the study. The samples were taken in children spontaneously presented by their mothers after our explanations, which accounts for the collection of 35 samples only.
Finger-prick blood was taken in the early morning but without guarantee of a fasting state. Urine was collected at random. All the samples were stored at 4°C, and then at - 2 0 ° C within 12 hours, until the analyses were performed. Hemoglobin was determined on the spot with an American Optical Hb-meter.
The results are presented in Table I (means, standard deviation, t test between the 2 means).
Table I
Biochemical results (means and + standard deviation) Biochemical Determinations N Hemoglobin g/100ml • Total proteins g/lOOml Albumin g/lOOml Albumin % Globulin % Albumin/ . globulin . Alpha,-glob. g/lOOml Alpha2-glob. g/lOOml Beta-glob, g/100ml Gamma-glob. g/lOOml Urea-N (blood) mg/lOOml OH-Proline Samples 1 17 7.259 ± 1.240 6.828 ± 0.453 3.939 ± 0.358 57.691 ± 4.248 42.309 ± 4.248 1.388 • ± 0.244 0.210 ± 0.056 0.459 ± 0.106 0.640 ± 0.125 1.521 ± 0.387 5.688 ± 2.536 2.171 ± 1.275 2 18 8.433 ± 1.349 6.829 ± 0.538 3.988 ± 0.399 58.511 ± 4.945 41.489 ± 4.945 1.450 ± 0.330 0.200 ± 0.062 0.467 ± 0.154 0.647 ± 0.143 1.465 ± 0.457 7.367 ± 1.736 1.981 + 1.258 t -2.678 -0.007 -0.386 -0.524 0.524 -0.626 1.260 -1.271 0.071 0.633 -2.296 0.444 P .01 NS NS NS NS NS NS NS NS NS .025 NS
In general some small differences exist between the two samples, but they are not statistically significant with the exception of hemoglobin and urea-N.
Hemoglobin
The values of sample 1 are significantly lower than those of sample 2. However, all the children except 3 present a moderate to severe anaemia (hemoglobin below lOg/100 ml). The origin of these anaemias is certainly multifactorial: repeated infections, multiple parasite infestations (malaria and ankylostomiasis especially), as well as various protein, vitamin and iron deficiencies the proportion of which are difficult to appreciate individually (Loiselet, personal communication).
Total protein and albumin
Values are quite normal and comparable to Western ones.
The gammaglobulin values are increased in both groups without a significant difference between them. This observation confirms a previous study which reflects the heavy parasite infestation of these children, and is in good correlation with the low hemoglobin level present in anaemia (Ravelli, 1972; Gabbud, et al, 1975).
Urea-N in the blood is low and significantly lower in sample 1. This reflects a low protein intake (Arroyave, et al., 1966).
Hydroxyproline index is at the lower limit. By measuring the collagen metabolism, this index contributes to the evaluation of the rate of growth of the child at the time of sampling. The difference between the two groups is not significant but both are at the limit between moderate malnutrition and the normal state (Whitehead, 1965; Arroyave, 1969).
In summary, the biochemical determinations did not present statistically significant differences between the two samples, with the exception of hemoglobin and urea-N. A general finding which is suggested by the biochemical results, is that all the children were probably subjected to heavy and repeated infections and parasite infestations.
The protein metabolism of these children is not apparently severely impaired in spite of their low protein intake. But further metabolic consequences of severe anaemia, infections, and parasite infestations should be investigated in more detail. According to the biochemical determinations, many of the children in both samples seem to suffer from marginal malnutrition because several parameters are situated at the lower limit of normality, which means that the nutritional balance of these children is precarious and any interfering disease (measles, diarrhoea, etc.) could' precipitate them into severe malnutrition.
In any case, the biochemical determinations used in this study did not improve the accuracy of the appreciation of the nutritional status given by anthropometry.
Food intake survey
Since all subjects were breast-fed during all or most of the period of our study, the main source of protein and calorie intake could not be measured directly (because feeding on demand throughout the day and night makes weighing after each feeding impracticable). But after the age of 5 to 6 months, the infants receive progressively more and more adult food: first some boiled yam, then other starchy food, and finally also fish and meat. Weaning usually occurs between 18 and 24 months of age, after which they participate in the family meal but do not always receive a full share of the fish or meat.
A food intake survey was conducted in one of the three villages, and complete results were obtained for 26 subjects (13 in each sample). The food intake of each infant (except breast milk) and of its family was investigated over three full days, at intervals of three days, and a retrospective enquiry was conducted for six other days. The following data were analyzed for the purpose of this study: total protein intake of the infant, calorie intake of the infant, total protein and calorie intake of the family group (in each case averaged over three days), and the number of times animal proteins were part of the meal in one week. The two samples presented no significant difference on any of these measures.
Socio-economic survey
Usually malnutrition is linked to socio-economic factors, which produces great difficulties in the interpretation of psychological studies. However, the population in which this study took place seemed to be socio-economically and socio-culturally very homogenous. A survey was undertaken to check the hypothesis, and complete results were obtained on the families of 42 subjects in all three villages (22 in sample 1 and 20 in sample 2). The cross-cultural level-of-living scale developed by Belcher (1972), slightly adapted to local conditions, was used as the main index. In addition, information was obtained on schooling (of parents and siblings), contact with urban centers and a socio-economic index was based on the area of cash-crops plantations owned by the father, additional income, number of factory-made objects in the household and a self-evaluation of the family's wealth (which may consist of a family-treasure inherited from the ancestors, or more prosaically of influencial relatives in the city).
There is no statistically significant relationship between these indices and nutritional status. In view of these findings, it can safely be assumed that socio-economic factors could not explain any difference in the nutritional status of the two samples, nor interfere with the interpretation of any differences found in the dependent variables.
Summary of sample characteristics
In summary, we have selected two samples of infants which are clearly different as far as their
anthropometric measurements are concerned. The latter reflect a difference in nutritional status which is however smaller than in most other studies of the influence of malnutrition on psychological development: the infants in sample 1 apparently suffer from subclinical moderate malnutrition, whereas the children in sample 2 have anthropometric measurements in the normal range. Hemoglobin values are generally low, while gammaglobulin concentrations are high. These findings suggest that repeated infections and parasite infestations (malaria, hookworm, etc.) may be the main causative factors. The other biochemical data do not indicate severe metabolic alterations, but some of the values suggest a precarious metabolic balance for the children of both samples.
There are some indications both in the biochemical analyses (urea-N) and in the food intake survey of low protein intake, but here again the values are low for both samples even though a significant difference appears for urea-N. Among the determinant factors, socio-economic ones can be excluded.
Method Sensori-motor intelligence
Several ordinal scales have recently been constructed for assessing sensori-motor development (Uzgiris & Hunt, 1975; Corman & Escalona 1969). We used an instrument devised and standardized in France by. Casati & Lezine (1968). Piaget's period of sensori-motor intelligence can be subdivided into six sub-stages (Piaget, 1936, 1937). The Casati-Lezine scale follows Piaget's observations and theory very closely: it concentrates on Piaget's sensori-motor stages 3 through 6. Each of these is further subdivided into sub-stages A and B, marking the beginning and the end state of each stage. The scale consists of seven series (or tasks, which are subdivided into hierarchically ordered items):
1. Object permanency: The infant has to find an object hidden under a screen (cloth), either when it is still partly visible (stage 3B), or when it is completely hidden but the child has already started a grasping movement (4A). At stage 4B, the child searches for the object under one screen (without having started a grasping movement), but if it is moved to a second screen, it continues to search under the first. The "visible displacement" to a second screen is achieved at stage 5A, whereas at stage 5B he is able to follow the object through an "invisible displacement" under one screen (the object is hidden in a box, the box is hidden under the screen, and the object is released; the object remaining hidden under the screen, the empty box is shown to the infant), and at stage 6A the infant follows the object through an invisible displacement to a second screen. At the end of the sixth stage (6B), the infant is able to follow systematically an
object through a series of invisible displacements in sequence, using three screens.*
2. String: An object is placed out of reach, with a string attached to it. The level of development (stages 4A to 5B) is determined by the complexity of the situation (length, disposition and number of strings) in which the subject is able to solve the problem by pulling the string.
3. Support: An object is placed out of reach on a cloth. The infant is able to get at the object by pulling the cloth. The complexity of the situation (e.g. cloth nearby or further removed) again determines the level of development (stages 4A to 5A). In a more difficult situation, the object is placed on a wooden board which can be rotated on a pin to move the object within reach. The child is placed at stage 6B if he solves the problem by "insight", at stage 6A if he solves it by trial and error, and at stage 5B if he can do it after a demonstration.
4. Use of an instrument: an object is placed out of reach. The infant is given a toy rake or a ruler with which he may reach for the object. The way he solves this problem indicates his stage of development (4B to 6B).
5. Exploration of objects': The infant is given a small mirror and a matchbox; his level of development is judged from the way he handles these objects (3 B to 6B). In our scoring, the opening and closing of the matchbox were assessed separately (task 5A and 5B respectively).
6. Combination of objects: tube and rake. A small object wrapped in a piece of paper is stuck in a tube in such a way that it cannot be reached with the fingers. The plastic toy rake is placed within reach. The stage of development (5B to 6B) is judged from the way the child uses the rake to push the paper out of the tube.
7. Combination of objects: tube and small chain. The same tube is placed in front of the child at the same time as a small chain made of paper clips. The way the child discovers how to make the chain pass through the tube (almost all children attempt to do this, but a regrouping of the clips is necessary to solve the problem) determines his developmental stage (5B to 6B).
The details of the techniques and the assessment of the observed behaviors are described fully in Casati & Lezine (1968), and the full results of our longitudinal study will be published later.
Experimental situation
The infants were tested when sitting on their mother's lap in front of a table; constant personal contact with the mother and the possibility of reaching for the breast seem to be most important to insure a
•Items 14 and 15 of the Uzgiris-Hunt (1975) scale were used for a more complete assessment of stage 6B.
satsifactory test situation. The examinations took place in specially built observation-huts. Care was taken to create as natural a testing situation as possible; the children and mothers were quite familiar with the experimenters, and local assistants were trained to present the objects to the child and to serve as interpreters.
The administration of the scale took between 15 and 45 minutes, and often several sessions were necessary to complete the testing. Care was taken to account for emotional reactions; some children show aversion or apathy towards strangers (particularly in the second year of life) and their behavior cannot be interpreted as a true indicator of their developmental level. Some examinations had to be discarded completely from the analysis for this reason. With other" subjects only partial results were obtained; these were retained in the data analysis.
Semiotic function
The method used in this study is adapted from a similar research carried out by Lezine with French children (Inhelder, el al, 1972). The child sat on a straw mat on the floor of the observation hut, together with his mother and a local assistant-interpreter, who
were instructed not to interfere with whatever the subject wished to do. The following objects were placed within easy reach of the child: a spoon, a knife, a plate, a cup, a bowl, a rubber enema bulb, a sponge made of vegetal fibers, a box of baby powder, a traditional comb, a piece of cloth, a small mirror, and three black dolls of various sizes. All of these objects, except the mirror and the dolls, were very familiar local objects. After a period of familiarization with the situation, the spontaneous behavior of the child was recorded for 15 consecutive minutes on video tape; one of the experimenters also wrote down his observations minute by minute. Complete written records were then obtained from the analysis of the video tapes. The details of the procedures and results of this study will be published elsewhere.
Results
Cognitive development: sensori-motor intelligence Our design enables us to study the influence of nutritional status on cognitive development through either a comparison of the 23 matched pairs or a comparison of the two samples treated as independent samples.
Table II
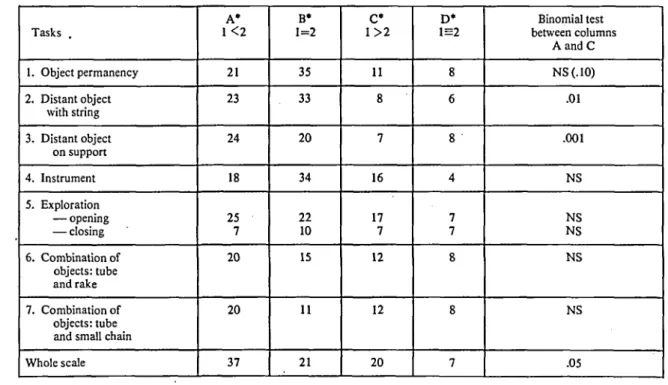
Influence of nutritional status on sensori-motor intelligence. Comparison of matched pairs. • Tasks . 1. Object permanency 2. Distant object with string 3. Distant object on support 4. Instrument 5. Exploration — opening — closing 6. Combination of objects: tube and rake 7. Combination of objects: tube and small chain Whole scale A* 1<2 21 23 24 18 25 7 20 20 37 B* 1=2 35 33 20 34 22 10 15 11 21 C* 1>2 11 8 7 16 17 7 12 12 20 D* 1S2 8 6 8 4 7 7 8 8 7 Binomial test between columns AandC NS(.IO) .01 .001 NS NS NS NS NS .05 * Column A: Stage reached by subject in sample 2 is superior to that reached by the matched subject of sample 1.
B: Same stage for both subjects.
C: Stage reached by subject in sample 1 is superior to that reached by the matched subject of sample 2. D: Both subjects have reached the highest stage on all tasks.
The optimal number of 115 comparisons (23 pairs x 5 examinations) is never reached because of the absence, complete or partial refusal, etc. of one or both subjects of a pair on some examinations. %
In the first alternative, we compare the stage reached by each member of a matched pair on each task over the five longitudinal examinations. The results are presented in Table II.
On all tasks the number of comparisons in which the stage reached by the member of sample 2 (normal nutritional status) is superior to that reached by the matched subject of sample 1 (moderate malnutrition) exceeds the number of comparisons in which the reverse is true. However, a binomial test indicates that this difference is statistically significant for two of the tasks only.
Table II also includes a comparison in which the Casati-Lezine scale is taken as a whole.* A binomial test on the frequencies of columns A and C of Table II reveals a statistically significant difference at the .05 level.
A tendency clearly appears in these results to indicate some effect in some cases, but no striking over-all effect occurs. A more detailed analysis is needed: in particular, the influence of nutritional status may change with age, and the analysis ought to take this possibility into account.
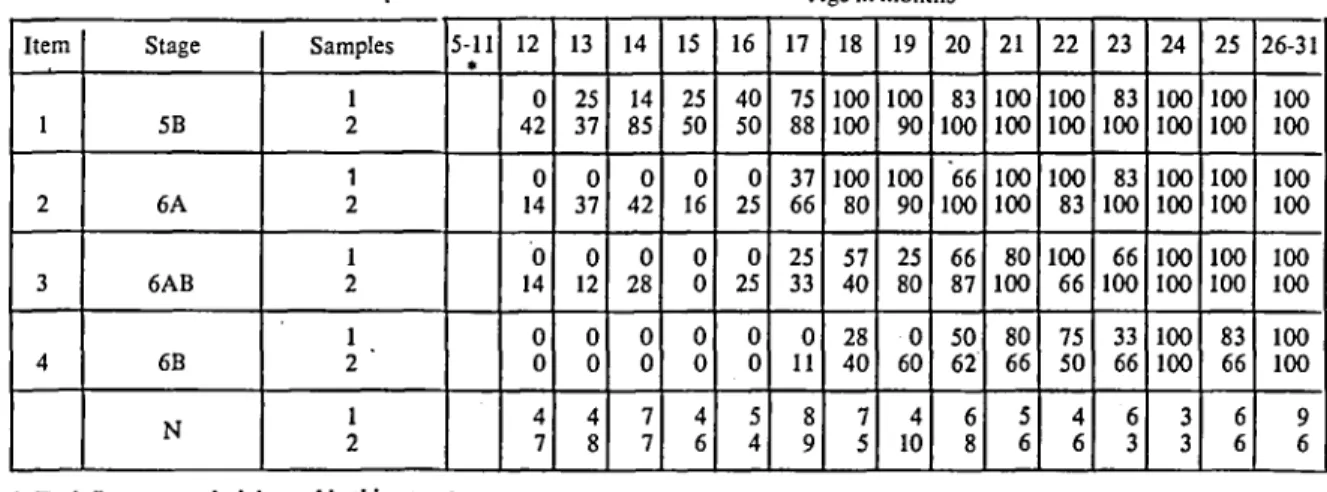
In each of the samples, and for each item of each task, the cumulative frequencies of the attainment of a particular stage over- age were calculated, and these are presented as cumulative percentages in Table III, choosing task 7 (Combination of objects: tube and chain) as an example.
•The results • of the members of a matched pair are considered to be equivalent if they have attained the same stage for all tasks on which a comparison was possible, or if the differences occurred in both directions. The results of one of the subjects are considered to be superior if he has reached a higher stage on each task, or the same stage on some tasks and a higher stage on at least one task, or if he has reached a higher stage on at least three tasks but a lower stage on one of the tasks.
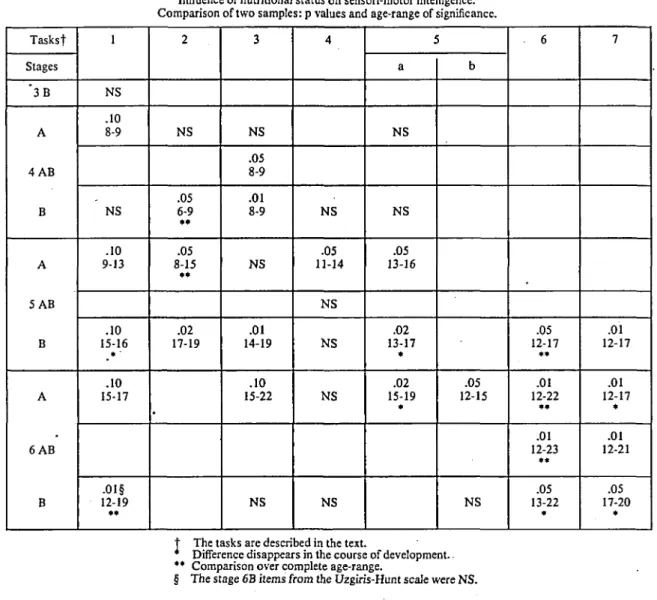
A comparison between the two samples was made using a statistical scheme recently proposed by Kamara & Easley (1977), which combines the probabilities of a difference between two proportions over a given number of age groups. The results are presented in Table IV.
If the comparisons are made over the whole age range in which percentages different from either 0 or 100 appear in at least one of the samples, only 6 differences (out of a total of 42 comparisons) are statistically significant at the .05 level. However, in many cases small fluctuations occur which are not meaningful or reflect a ceiling effect. In the example of task 7 presented in Table III, none of the comparisons shows a statistically significant difference if the age-range included is defined as above. An inspection of Table III indicates however that the percentages obtained by sample 2 exceed those obtained by sample 1 in several age-groups; the age-range over which such a difference seems to occur was determined by visual inspection, and its level of significance was determined. Thus Table IV includes for each item of each task the age-range which was tested as well as the p value attached to the difference between the two samples for that age-range (p values < .10 have been included because they indicate a trend towards a difference on the object permanency task).
In addition to the six items mentioned above, significant differences at the .05 level appear on 14 items over part of the age-range (and on 5 items at the .10 level). In most cases these differences occur over the full age-range in which an item is not affected by ceiling effects; in six cases (marked * in Table IV) a difference first occurs and then disappears in the course of development.
The occurrence of significant differences clearly changes with age and stage. At stage 4, differences occur at age 8-9 months on three of the ten items. At
Table III
Task 7: Combination of objects: tube and chain. Cumulative percentages of the attainment of each stage in both samples. Age in months Item 1 2 3 4 Stage 5B 6A 6AB 6B
N
Samples 1 2 1 2 1 2 1 2 " 1 2 5-11 * 12 0 42 0 14 0 14 0 0 4 7 13 25 37 0 37 0 12 0 0 4 8 14 14 85 0 42 0 28 0 0 7 7 15 25 50 0 16 0 0 0 0 4 6 16 40 50 0 25 0 25 0 0 5 4 17 75 88 37 66 25 33 0 11 8 9 18 100 100 100 80 57 40 28 40 7 5 19 100 90 100 90 25 80 0 60 4 10 20 83 100 66 100 66 87 50 62 V O 0 0 21 100 100 100 100 80 100 80 66 5 6 22 100 100 100 83 100 66 75 50 4 6 23 83 100 83 100 66 100 33 66 6 3 24 100 100 100 100 100 100 100 100 3 3 25 100 100 100 100 100 100 83 66 6 6 26-31 100 100 100 100 100 100 100 100 9 6* Task 7 was not administered in this age-range.
Table IV
Influence of nutritional status on sensori-motor intelligence. Comparison of two samples: p values and age-range of significance. Tasksf Stages '3B A 4AB B A 5AB B A 6AB B 1 NS .10 8-9 NS .10 9-13 .10 15-16 • ' .10 15-17 .01§ 12-19 »• 2 NS .05 6-9 »• .05 8-15 ** .02 17-19 3 NS .05 8-9 .01 8-9 NS .01 14-19 .10 15-22 NS 4 NS .05 11-14 NS NS NS NS 5 a NS NS .05 13-16 .02 13-17 * .02 15-19 * b .05 12-15 NS . 6 .05 12-17 ** .01 12-22 ** .01 12-23 • * .05 13-22 * 7 .01 12-17 .01 12-17 .01 12-21 .05 17-20 * t The tasks are described in the text.
• Difference disappears in the course of development. *' Comparison over complete age-range.
§ The stage 6B items from the Uzgiris-Hunt scale were NS. stage 5 and stage 6A, the differences are much more
systematic; they occur around age 13 months for stage '5A, and around 17 months for stages 5B and 6A. On the other hand at stage 6B the differences are again much less marked.
A tentative interpretation of these rather complex results could be that moderate malnutrition has relatively little effect on sensori-motor intelligence in the early stages of development; it becomes more marked in the second year of life when the infants pass through stage 5 and reach stage 6. This period of sensori-motor development, is characterized by the "tertiary circular reaction" (Piaget, 1936), the discovery of new means to reach a goal through active experimentation. The infant no longer applies known action schemes to new situations, as he does at stage 4, but actively searches for new schemes through trial
and error. It is this "active experimentation" which seems to be affected by an adverse nutritional status. However, it has to be remembered that the differences under discussion only represent some delay in development: some infants in sample 2 reach a particular stage before the infants in sample 1, but all children eventually reach that stage. This delay is of the order of one or two months, and may reach three to four months in extreme cases.None of the structural properties of stage development seems to be affected. Furthermore, the differences between the two samples are less systematic at the endstate of sensori-motor intelligence (stage 6B), when the child no longer needs to experiment in order to solve the problems presented to him, but he is able to use mental representation.
The question is left open whether the influence of moderate malnutrition will coqjinue on cognitive
development after the sensori-motor period. Although we have collected no data on children older than 33 months, we have investigated the passage from sensori-motor action to symbolic representation. Cognitive development: semiotic function
Observational data on the emergence of the semiotic functio'n was collected for 26 subjects, of which 23 belong to the samples defined by nutritional status; at the time of the observations, the ages of the subjects in sample 1 ranged from 19 to 33 months, with a mean of 25.6 months, and the ages in sample 2 ranged from 17 to 27 months, with a mean of 22 months. Thus age as an intervening variable should favor sample 1.
The distribution of the subject in the two samples along the levels "defined for the semiotic function appears in Table V.
Table V
Influence of nutritional status on semiotic function
1 Samples
2
Levels of semiotic function 1 4 -1 1-2 4 1 2 2 7 2-3 1 1 3 1 1 N 12 11
The higher levels of semiotic functioning are represented by two subjects in both samples, but most subjects at the lower levels are in sample 1. A chi square calculated by grouping levels 1 and 1-2 on the one hand, and levels 2 to 3 on the other, just fails to reach the .05 level of significance. This result is similar to what has been found for the development of sensori-motor intelligence: there is no striking over-all effect of nutritional status, but there definitely is a trend indicating a delay in development for some of the subjects in sample 1. The latter tend to handle the objects without any systematic exploration of their properties, and to apply the same action schemes on several objects repeatingly but without organizing these actions into meaningful sequences; the objects are seldom used in a conventional way. On the other hand most subjects of sample 2 are presenting behaviors typical of level 2: when they are handling objects they actively explore their properties and organize their activities into sequences; the conventional use of objects appears frequently, and is organized into themes (mothering, feeding, cleaning) although the activities do not follow a systematic order. The dolls are often used .as active participants in the game.
Thus the difference which appears between the two samples is again linked to "active experimentation". However here again some subjects of both samples have reached the final level of symbolic representation,
and there is no doubt that all subjects will have reached it in time. The difference is not a matter of kind but of timing: it is the rate of development which seems to be affected to some degree by the nutritional status. The question is open whether such delays have any implications for future development or whether they are of no consequence. On the descriptive level, we have found that the differences which appear between the two samples have to do with the active exploration and experimentation of the environment; most of the children of sample 1 are less active in their exploration of the environment, which does not niean that they are necessarily less active in their handling of objects: it is the level of organization of their behavior which seems to be different. Whether they are more passive or even apathetic in the experimental situation is a different question, to which we will turn our attention now, although the distinction is not always obvious.
Attitude towards the tasks: sensori-motor intelligence The possibility has been raised that children suffering from moderate malnutrition may have a different attitude towards the experimental situation: their style of behavior may be different independently of the cognitive development. In particular, malnourished children have been described as more passive, unresponsive or even apathetic, or antagonistic and aggressive.
A general indication of unresponsiveness and adverse emotional reactions is given by the number of tasks which could not be scored because the experimenters felt that the subject had not been in a position to display his real level of development; these were called "partial refusals" if they occurred on a few of the tasks only in any one examination, and "complete refusals" if only two or less tasks could be scored.
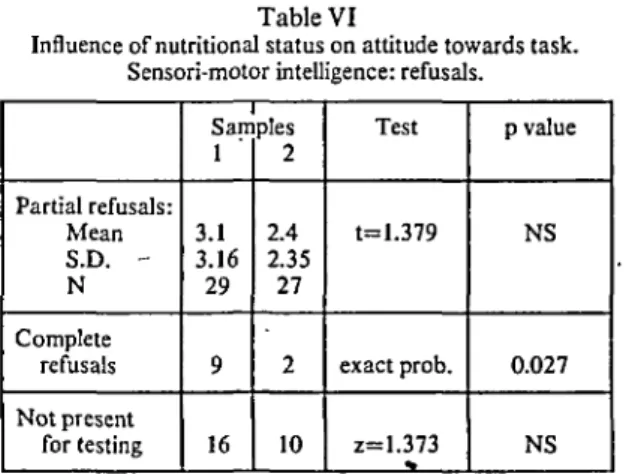
A comparison of the two samples on the number of refusals appears in Table VI. The mean number of partial refusals (summed over the five examinations for
Table VI
Influence of nutritional status on attitude towards task. Sensori-motor intelligence: refusals.
Partial refusals: Mean S.D. -N Complete refusals Not present for testing San 1 3.1 3.16 29 9 16 pies 2 2.4 2.35 27 2 10 Test t=1.379 exact prob. z=1.373 p value NS 0.027 NS
each subject) is slightly larger in sample 1 than in sample 2, but the difference is not statistically significant. The number of complete refusals is significantly larger in sample 1 than in sample 2, but compared to the total of 243 examinations successfully completed they represent only an exceptional reaction. The number of examinations which were missed because of illness, travel to other places or reluctance (on the part of the mother) to attend the testing is also slightly higher in sample 1 than in sample 2.
Another indication of uneasiness with the experimental situation is the number of testing sessions which were needed to complete the examination: a maximum of three attempts were made for each subject, after which missing information was labelled "partial refusal" and completely unsuccessful examinations discarded as "complete refusals". The number of subjects in each sample requiring 1, 2 or 3 sessions to complete the examination was computed separately for each of the five longitudinal examinations. Only on the second of these were there significantly (.05) more subjects in sample 1 than in sample 2 requiring 2 or 3 sessions.
A more immediate indication of the subjects' attitude towards the tasks is obtained through check-lists filled out "by the experimenters after each examination. On none of the five themes (1. Attitude of the mother; 2. Level of interest and activity; 3. Fear, averse behavior; 4. Aggressivity; 5. Quality of the experimental situation) was there any significant difference between the two samples.
Considering all these indications together, there is only a very slight trend for the subjects in sample 1 to display a more unresponsive style of behavior than those of sample 2. In any case the differences which we have found in cognitive development cannot be explained by a difference in the subject's attitude towards the tasks used to study sensori-motor intelligence.
Attitude towards the tasks: semiotic function
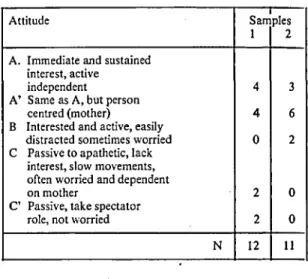
Five categories of reactions to the observational situation used to study the emergence of the semiotic •function are presented in Table VII together with the number of subjects of both samples classified into each. It should be remembered that these observations were made in one short-time sampling only, and the reactions could have been different at other times.
Chi squares computed on these frequencies with any type of grouping of the attitude categories are not statistically significant. Nevertheless, it is noteworthy that the only four subjects in categories C and C (passive to apathetic) are of sample 1, and that three of these are at the first level of symbolic functioning. In these three cases some relationship between malnutrition, a generally apathetic attitude and the low level cognitive functioning is not excluded. On the other hand, the remaining subjects of sample 1 are in
Table VII
Influence of nutritional status on attitude towards task. Semiotic function.
Attitude
A. Immediate and sustained interest, active
independent
A' Same as A, but person centred (mother)
B Interested and active, easily distracted sometimes worried C Passive to apathetic, lack
interest, slow movements, often worried and dependent on mother
C Passive, take spectator role, not worried
N Samples 1 4 4 0 2 2 12 2 3 6 2 0 0 11
categories A and A'; thus the relationship does not hold for most of the subjects.
Discussion
The overall interpretation of these results is not obvious. It is not possible to state with certainty that moderate malnutrition has an effect on the psychological variables studied, or that it has no effect. Most of the analyses show a trend; sometimes the differences are statistically significant, sometimes they are not, and there are several borderline cases.
In view of these ambiguous results, we have to reconsider the nature of the independent variable. It is common practice to use anthropometric measurements as indicators of nutritional status, but in view of the fact that we cannot demonstrate the causes of the observed differences and that there are few differences between the two samples on the biochemical parameters and on the measures derived from the nutritional survey, the question is left open of what exactly is at the basis of the difference in the independent variable.
In any case, we have purposefully chosen to study the possible effects of marginal or subclinical malnutrition. Since the difference in the independent variable is only slight, it is not surprising that the effects on the dependent variables are not striking. In fact it could be argued that it is surprising to find that there is any effect at all, and the trends which were . demonstrated are thus all the more meaningful.
This leads us to a second important question, that of the practical importance of the effects which were found. In fact it is not yet known what the relation is between the rate of development of sensori-motor intelligence and later cognitive development. A delay of a few months in the attainment of sensori-motor stage 5B or 6A seems to be of "little significance in
itself; in any case all the children will reach the final stage 6B by 22-26 months. Furthermore, a fairly general advance compared to French norms has been found in the rate of development of sensori-motor intelligence in these Baoule infants, and this is true for both samples.
On the other hand, the differences we have found seem fo be linked to the "active experimentation" on the environment, which is a recurrently necessary ingredient of cognitive development. We have found that a difference in nutritional status seems to be linked to this dimension both during the sensori-motor period and in the emergence of the semiotic function. Will the same relationship be true in subsequent stages of cognitive development? This question is left to be answered by future investigations.
Summary
A longitudinal study of sensori-motor intelligence (following Piaget's theory) was designed to assess the possible effects of moderate malnutrition on cognitive development.
The subjects are 56 Baoule infants (Ivory Coast), aged 5 to 33 months; they were selected to form two samples matched for age but differing in nutritional status. Anthropometric measurements were obtained every three months over a period of one year, and biochemical, nutritional and socio-economic data are also available for the same, children. The stages of psychological development were assessed every three months using the Casati-Lezine scale of sensori-motor intelligence. In addition, the emergence of the semiotic function was studied through video-tapes of behavior with a fixed set of objects. Statistically significant differences occur between the two samples on some but not all of the dependent variables. One aspect of both sensori-motor intelligence and the semiotic function which seems to be particularly affected by nutritional status is the exploration of the environment and active experimentation.
References
Arroyave, G. (1969): Proposed methodology for the • biochemical evaluation of protein malnutrition in children. In: Protein-Calorie Malnutrition (von Muralt, A. ed.), 48-56. Springer Verlag, Heidelberg.
Arroyave, G., Wilson, D., Viteri, F. (1966): Variations in urine and blood serum nitrogenous constituents with controlled protein intakes. Proc. 7th Int. Congr. Nutr., Hamburg, 4, 148.
Belcher, J. C. (1972): A cross-cultural household level-of living scale. Rural Sociology, 37,2: 208-220.
Brazier, M. A. B. (1975): Growth and Development of the Brain: Nutritional, Genetic, and Environmental Factors. IBRO Monograph Series vol. 1. Raven Press, New York.
Casati, I. and Lezine, I. (1968): Les etapes de Intelligence sensori-motrice. Manuel, Paris: Centre de Psychologie Appliquee.
Christiansen, N., Vuori, L., Mora, J. O., and Wagner, M. (1974): Social environment as it relates to malnutrition and mental development. In: Early Malnutrition and
Mental Development, 186-199. (Cravioto, J., Hambraeus, L. and Vahlquist, B. eds.), Almqvist & Wiksell, Stockholm.
Cobos, F. (1972): Malnutrition and mental retardation: conceptual issues. In: Lipids, Malnutrition and the Developing Brain, 227-246. A joint Ciba-Nestle Foundation Symposium. Elsevier, Excerpta Medica North-Holland, Amsterdam.
Committee Report (1970): Assessment of Protein Nutritional Status. A Committee Report. Am. J. Clin. Nutr., 23, 807-819.
Corman, H. H. and Escalona, S. K. (1969): Stages in sensori-motor development: a replication study. The Merril-Palmer Quarterly, 15,4: 351-361.
Cravioto, J. (1970): Complexity of factors involved in protein-calorie malnutrition. Nutr. Diet., 14, 7-22. Cravioto, J., Hambraeus, L. and Vahlquist, B. (1974): Early
Malnutrition and Mental Development. Symposia of the Swedish Nutrition Foundation XII, Almqvist & Wiksell, Stockholm.
DeLicardie, E. R. and Cravioto, J. (1974): Behavioral responsiveness of survivors of clinical severe malnutrition to cognitive demands. In: Early Malnutrition and Mental Development, 134-153. (Cravioto, J., Hambraeus, L. and Vahlquist, B. eds.), Almqvist & Wiksell, Stockholm. •
Gabbud, J. P., Gbedemah, K. A., Ravelli, G. P., Herzen, S., Meylan, CL, and von Muralt, A. (1975): Biochemical study on the nutritional status of children in the Ivory Coast. In: Proc. 9th Int. Congr. Nutr., Mexico, 1972,4, 128-132. S. Karger, Basel.
Guerry, V. (1970): La vie quotidienne dans un village Baoule. Inades, Abidjan.
Inhelder, B., Lezine, I., Sinclair, H., and Stambak.M. (1972): Les debuts de la fonction symbolique. Arch. Psycho!., 51, 163: 187-243.
Jelliffe, D. B. (1966): The Assessment of the Nutritional Status of the Community. WHO Monogr. Series 53. Jelliffe, D. B. (1969): Appreciation de l'etat nutritionel des
populations. OMS Monogr. Series 53.
Kallen, D. J. (1973): Nutrition Development and Social Behavior. (DHEW Publ. no. 73-242), N.I.H., Washington.
Kamara, A. and Easley, J-A. (1977): Is the rate of cognitive development uniform across cultures? A methodological critique with new evidence from Themne children. In: Cross-cultural Piagetian Psychology (Dasen P. R., Ed.) Gardner Press, New York (in press).
Kanawati, A. A. and McLaren, D. S. (1970): Assessment of marginal malnutrition. Nature, 228, 573-574.
Kaplan, B. J. (1972): Malnutrition and mental deficiency. Psych. Bull., 78, 5: 321-334.
Klein, R. E. Habicht, J. P. and Yarbrough, C. (1971): Effects of protein-calorie malnutrition on mental development. Adv. in Pediatrics, 18,75-91.
Klein, R. E., Yarbrough, C , Lasky, R. E., and Habicht, J. P. (1974). Correlations of mild to moderate protein-calorie malnutrition among rural Guatemalan infants and preschool children. In: Early Malnutrition and Mental Development, 168-181. (Cravioto, J., Hambre-aus, L. and Vahlquist, B. Eds.), Almqvist & Wiksell, Stockholm.
Latham, M. C. and Cobos, F. (1971): The effects of malnutrition on intellectual development and learning. Amer. J. Publ. Health, 61, 7: 1307-1324.
Lewis, M. and McGurk, H. (1972): Evaluation of infant intelligence. Infant intelligence scores — true or false? Science, 178,4066: 1174-1177.
McLaren, D. S. and Read, W. W. C. (1972): Classification of nutritional status in early childhood. Lancet II,
146-148.
Monckeberg, F. (1968): Mental retardation from malnu-trition: "irreversible". JAMA, 206, k 30-31.
Mora, J. O., et al. (1974): Nutrition, health and social factors related to intellectual performance. World Rev.
Nutr. Diet., 19,205-236.
von Muralt, A. (1969): Protein-Calorie Malnutrition. A Nestle Foundation Symposium. Springer Verlag, Heidelberg.
Nelson, E. W., Vaughan, V. C. and McKay, R. J. (1969): Textbook of Pediatrics, 9th edition. W. B. Saunders, • Philadelphia.
Piaget, J. (1936): La naissance de Vintelligence chez Venfant. Delachaux & Niestle, Neuchatel.
Piaget, J. (1937): La construction du reel chez Venfant. Delachaux & Niestle, Neuchatel.
Ravelli, G. P. (1972): Enquete nutritionelle en milieu rural africain. These. Universite de Berne.
Ricciuti, H. N. (1973): Malnutrition in infants. In: Nutrition,
Development and Social Behavior, 17-32. (Kallen, D.
J., Ed.), N.I.H., Washington, D.C.
Rutter, M. (1970): Psychological development — pre-dictions from infancy. J. Child Psycnol. Psychiatry,
11,49-62.
Scrimshaw, N. S., and Gordon, J. E. (1968), Malnutrition, Learning and Behavior. M.I.T. Press, Cambridge, Mass.
Segall, M. H. (1970): Cross-Cultural Research in Nutrition.
A synopsis and guide to research with emphasis on
Eastern Africa. Syracuse Univ.: Maxwell Graduate School of Citizenship and Public Affairs, Program of Eastern African Studies; Occasional Paper no. 56. Tuddenham, R. D. (1974): On analyzing longitudinal data
relating nutrition to cognitive development. In:
Methodology in studies of early malnutrition and
mental development, 72-82. WHO Workshop. Second part to Early Malnutrition and Mental Development (Cravioto, J., Hambraeus, L. and Vahlquist, B. Eds.), Almqvist & Wiksell, Stockholm.
Uzgiris, I. C. and Hunt, McV. J. (1975): Assessment in
infancy: ordinal scales of psychological development.
Univ. of Illinois Press, Urbana.
Warren, N. (1970): Research design for investigation of the lasting behavioral effects of malnutrition: the problem of controls. Soc. Sci. Med., 4,589-593.
Waterlow, J. C. (1972): Classification and definition of protein-calorie malnutrition. Brit. Med. J., 3, 5826: 566-569.
Waterlow, J. C. and Rutishauser, I. H. (1974): Malnutrition in Man. In: Early Malnutrition and Mental Development, 13-26. (Cravioto, J., Hambraeus, L. and Vahlquist, B., Eds.) Almqvist & Wiksell, Stockholm. Whitehead, R. G. (1965): Hydroxyproline-creatinine ratio as
an index of nutritional status and rate of growth.