Public stigmatization of different mental disorders:
a comprehensive attitude survey
Received 15 April 2012; Revised 24 May 2012; Accepted 27 May 2012; First published online 26 July 2012 Key words: Discrimination, mental health literacy, social distance, stigma, stereotypes.
Dear Editor,
Stigmatization of mental disorders is a key issue in the social sciences and one of the most important obstacles in the field of public mental health care. The lit-erature indicates that stigmatization of persons with mental disorders is quite prevalent in the general popu-lation (Link et al. 1999; Crisp et al. 2005). Nevertheless, significant variation exists depending on the different components of stigma that have been applied (e.g., stereotypes, prejudice or discrimination; Corrigan, 2004). Recognition is the key element in the concept of‘mental health literacy’ (Jorm, 2000) and a crucial strategy to reduce public stigma through education and the provision of pertinent information (Corrigan, 2004). However, recognition of mental disorders is rather low in the general public (Jorm, 2000) and sev-eral studies revealed that labelling a person as mentally ill is associated with increased stigma (Martin et al. 2000; Peluso & Blay, 2009). Furthermore, stigma is highly related to the disorder to which it is attributed. In this respect a growing body of evidence suggests that stigma is greater towards schizophrenia when compared with depression and that substance-use dis-orders are even more stigmatized than schizophrenia (Link et al. 1999; Crisp et al. 2005; Pescosolido et al. 2010). Thus, in this study we aimed at expanding the stigma literature by integrating the following three topics as discussed above: (1) different components and measures of stigma, (2) labelling of mental dis-orders and (3) different types of mental disdis-orders.
Methods
Sampling procedure
During April 2010, we collected data of 2001 subjects of the general adult population of Brazil. Our selection
design comprised three stages. First, cities (including rural settlements) within each region of Brazil were probabilistically chosen to constitute a sample through the probability-proportional-to-size method, based on the 2002 Brazilian census. In the second stage, within our designated cities, telephone numbers were ran-domly selected. The third stage was divided into two procedures. First, for half of the sample, each adult inhabitant of the household at a selected telephone num-ber was enrolled, and one was selected by means of a Kish-table. If that respondent was absent, two more attempts were made at different days and times. In case of failure, the household was substituted. Second, for the other half of the sample, quota sampling was used for the individual who answered the telephone, matching them according to the variables of sex, age, education and occupation. Results were then expanded to the whole population through a combination of these demographic variables and geographic region. The proportions used for this expansion were estab-lished based on the latest data from the Brazilian census. This survey was approved by the Ethics Committee of the University of Sao Paolo’s School of Medicine and was conducted in strict accordance with the World Medical Association’s declaration of Helsinki. Measures
Data were assessed with computer-assisted telephone interviews. The interview began with the presentation of a vignette describing the case of a fictitious person (‘XY’). Of our five possible vignettes, four comprised scenarios of mental disorders defined according to DSM-IV criteria for alcohol dependence (n = 229), cocaine dependence (n = 275), major depression (n = 267) and schizophrenia (n = 1015). The fifth vignette depicted a non-psychiatric case below the threshold level of diagnosis that described a distressed individ-ual (n = 215). Detailed vignette depictions are available on request. Vignettes were chosen for each selected participant in a four to one proportion, such that the
schizophrenia vignette was selected for four
* Address for correspondence: Dr Michael Hengartner, Department of General and Social Psychiatry, Psychiatric University Hospital Zurich, PO Box 1930, CH-8021 Zurich, Switzerland.
consecutive individuals and then one of the other vign-ettes was randomly selected for the fifth individual.
Immediately after each vignette was presented, the participants were asked if they believed that XY had a
mental disorder. Subjects who responded with ‘no’
were defined as ‘individuals without recognition of a mental disorder’. If the response was ‘yes’, those partici-pants were then asked if they could name the specific disorder described in that vignette. Those who, although they knew that this was a disorder of some type, had indicated that they could not identify it or who wrongly named the disorder were defined as‘individuals with recognition’. Finally, respondents who correctly labelled the vignette were defined as‘individuals with correct identification’. We coded the following expressions as correct identification:‘depression’ and ‘depressive order’; ‘schizophrenia’, ‘psychosis’ or ‘psychotic dis-order’; ‘alcohol abuse, dependence or addiction’ or ‘alcoholism’; and ‘cocaine abuse, dependence or addic-tion’. Because stress is not a mental disorder and an identification of the diagnosis would therefore have been irrelevant, we assessed only whether the respon-dents considered that condition to be a mental disorder. We adapted a questionnaire that has been applied in comprehensive stigma surveys in Switzerland (Lauber et al.2006). Along with gathering socio-demographic information and recommendations on treatment, this instrument includes questions about various measures of stigma. For the present study we used items about stereotypes (Loch et al. 2011), the Social Distance Scale (Link et al. 1987) and discriminating beliefs based on the Social Devaluation and Discrimination Scale (Link et al. 1991).
Stereotypes were assessed through participants’ responses on a 3-point Likert-scale, which measured the degree to which various characteristics were present in a person such as XY compared with someone from the general population (1 signified‘less present’, 2 ‘equally present’ and 3 ‘more present’). Stereotypes were divided into positive stereotypes (five items) and negative stereo-types (seven items). The former consisted of the adjec-tives ‘creative’, ‘healthy’, ‘self-controlled’, ‘gifted’ and ‘reasonable’, while the latter utilized ‘dangerous’, ‘unpre-dictable’, ‘stupid’, ‘bedraggled’, ‘abnormal’, ‘unreliable’ and ‘weird’. The Social Distance Scale evaluated a respondent’s willingness to interact with a person like XY and applied a 3-point Likert-scale with 1 standing for ‘certainly yes’, 2 for ‘maybe’ and 3 for ‘definitely not’. The items about discriminating beliefs assessed a participant’s perception of general social restrictions and misgivings towards persons with a mental disorder. Again, participants responded on a 3-point Likert-scale representing 1‘I totally disagree’, 2 ‘I partly agree’ and 3‘I totally agree’. For every stigma measure we com-puted a mean total score. All stigma measures ranged
from 1 to 3, with 1 representing minimum stigma and 3 representing maximum stigma.
Statistical analyses
We first conducted a missing values analysis (MVA) using the multiple imputation procedure to complete the data about stigma measures. Variables with >50% missing values were excluded from the imputation process. By implementing MVA, we obtained complete data for the four stigma measures from 1997 partici-pants. Four participants were excluded from the ana-lyses because they did not provide at least 50% of information about stigma. Altogether 275 participants (13.7%) had at least one missing value and totally 399 values (5.0%) were imputed.
Second, we fitted a series of robust generalized lin-ear models, with stigma measures as the dependent variable. The distributions for the positive stereotype and social distance scales were fixed as Gamma and the covariates were linked to the dependent variable with the log link-function. For the negative stereotype and discrimination scales, we fitted a Normal distri-bution with an identity link-function. Analyses of vignette were adjusted for recognition, whereas ana-lyses of recognition were adjusted for vignette. Pair-wise contrast analyses were computed to compare means for every pair of categories from the indepen-dent variables, using a sequential Bonferroni adjust-ment for multiple comparisons.
All statistical analyses were performed with SPSS version 20 for Macintosh.
Results
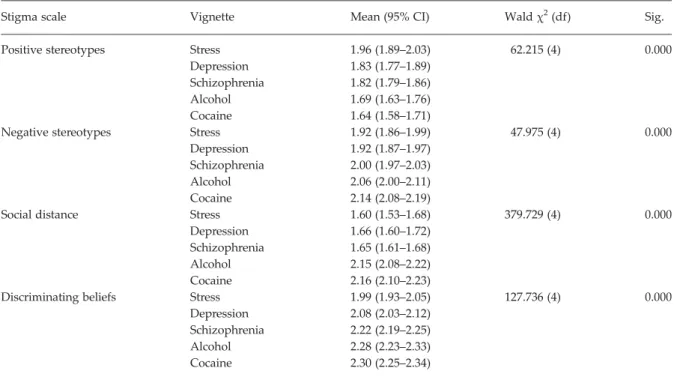
The associations between stigma measures and vign-ette, adjusted for labelling, are listed in Table 1. Positive stereotypes were most frequently found with the stress vignette (mean = 1.96). Significantly less posi-tive stereotypes were expressed towards depression (mean = 1.83) and schizophrenia (mean = 1.82). The least positive stereotypes were reported towards alco-hol (mean = 1.69) and cocaine dependence (mean = 1.64), both differing significantly from the first three vignettes but not between each other. As for negative stereotypes, stigma was highest towards cocaine (mean = 2.14) and alcohol dependence (mean = 2.06). Negative stereotypes towards schizophrenia (mean = 2.00) differed significantly from cocaine dependence, but not from alcohol dependence. Negative stereo-types towards persons with depression (mean = 1.92) and stress (mean = 1.93) were significantly lower than those for alcohol and cocaine dependence. Mean values of stress, depression and schizophrenia did
not differ significantly. Social distance was most com-monly expressed towards persons with cocaine (mean = 2.16) or alcohol dependence (mean = 2.15). Those two groups differed significantly from depression (mean = 1.66), schizophrenia (mean = 1.65) and stress (mean = 1.60). Mean differences between the latter three groups were not significant. Finally, discriminating beliefs were again most frequently reported towards persons with cocaine (mean = 2.30) or alcohol dependence (mean = 2.28). Schizophrenia (mean = 2.22) was signifi-cantly less stigmatized than cocaine dependence. Discrimination of persons with depression (mean = 2.08) or stress (mean = 1.99) was significantly lower
than for the other vignettes. Across all stigma measures, stress differed significantly only from depression with respect to positive stereotypes.
The associations between stigma measures and lab-elling, adjusted for vignette, are presented in Table 2. Positive stereotypes were more frequently held by sub-jects without recognition (mean = 1.88) when com-pared to subjects with recognition (mean = 1.76) or correct identification (mean = 1.74). With respect to negative stereotypes, this relationship was inverted; subjects without recognition (mean = 1.94) reported significantly less stigmatizing beliefs than subjects
with recognition (mean = 2.03) or identification
Table 1. Stigma measures in association with different vignettes, adjusted for degree of labelling
Stigma scale Vignette Mean (95% CI) Waldχ2(df) Sig.
Positive stereotypes Stress 1.96 (1.89–2.03) 62.215 (4) 0.000
Depression 1.83 (1.77–1.89)
Schizophrenia 1.82 (1.79–1.86)
Alcohol 1.69 (1.63–1.76)
Cocaine 1.64 (1.58–1.71)
Negative stereotypes Stress 1.92 (1.86–1.99) 47.975 (4) 0.000
Depression 1.92 (1.87–1.97)
Schizophrenia 2.00 (1.97–2.03)
Alcohol 2.06 (2.00–2.11)
Cocaine 2.14 (2.08–2.19)
Social distance Stress 1.60 (1.53–1.68) 379.729 (4) 0.000
Depression 1.66 (1.60–1.72)
Schizophrenia 1.65 (1.61–1.68)
Alcohol 2.15 (2.08–2.22)
Cocaine 2.16 (2.10–2.23)
Discriminating beliefs Stress 1.99 (1.93–2.05) 127.736 (4) 0.000
Depression 2.08 (2.03–2.12)
Schizophrenia 2.22 (2.19–2.25)
Alcohol 2.28 (2.23–2.33)
Cocaine 2.30 (2.25–2.34)
Table 2. Stigma measures in association with different degrees of labelling, adjusted for vignette
Stigma scale Recognition Mean (95% CI) Waldχ2(df) Sig.
Positive stereotypes No mental disorder 1.88 (1.83–1.92) 29.812 (2) 0.000
Mental disorder 1.76 (1.72–1.80)
Correct identification 1.74 (1.69–1.78)
Negative stereotypes No mental disorder 1.94 (1.90–1.98) 19.369 (2) 0.000
Mental disorder 2.03 (1.99–2.07)
Correct identification 2.05 (2.02–2.09)
Social distance No mental disorder 1.81 (1.76–1.86) 12.071 (2) 0.002
Mental disorder 1.88 (1.84–1.92)
Correct identification 1.79 (1.75–1.84)
Discriminating beliefs No mental disorder 2.11 (2.07–2.14) 27.059 (2) 0.000
Mental disorder 2.17 (2.14–2.20)
(mean = 2.05) of the disorder. Social distance was sig-nificantly more expressed by subjects with recognition (mean = 1.88) than by subjects with correct identifi-cation (mean = 1.79). Subjects without recognition (mean = 1.81) did not significantly differ from the other two groups. Discriminating beliefs were associ-ated with a clear linear increase in stigmatizing beliefs as a function of labelling. That is, subjects with correct identification (mean = 2.24) reported significantly more discriminating beliefs than subjects with recognition (mean = 2.17), and the latter significantly more than subjects without recognition (mean = 2.11).
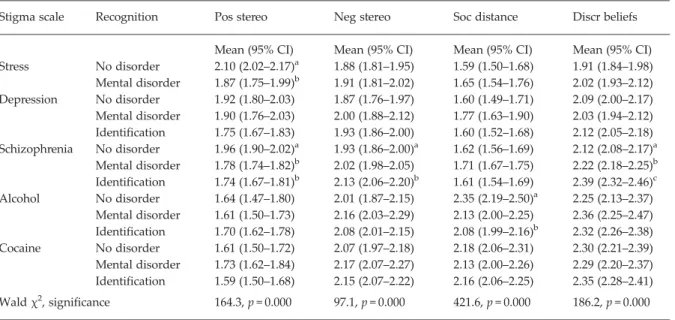
Across all measures the stress vignette was per-ceived consistently as most favourable (see Table 3).
Overall least favourably appraised were both
substance-use disorders. The most positive stereotypes were expressed towards the stress vignette without recognition as a mental disorder (mean = 2.10), whereas the least positive stereotypes were reported towards cocaine dependence when correctly identified (mean = 1.59). With regard to negative stereotypes, the most negative beliefs were expressed towards cocaine dependence when recognized as a mental disorder (mean = 2.17) while most favourably perceived was stress recognized as not being a disorder (mean = 1.88). Intriguingly, the greatest social distance was endorsed towards persons with alcohol dependence when not recognized as a disorder (mean = 2.35); again, most favourably perceived was stress when not considered a disorder (mean = 1.59). Concerning social distance, stigma towards alcohol dependence decreased continuously as a function of labelling, whereas for the other vignettes there was no consistent
trend. With respect to discriminating beliefs, the inverse relationship was found for schizophrenia. That is, discrimination of persons with that disorder continuously increased as a function of labelling. Discriminating beliefs were highest towards schizo-phrenia when the vignette was correctly identified (mean = 2.39) and lowest towards persons with stress when that vignette was not recognized as a disorder (mean = 1.91). All pair-wise comparisons referenced above were significant at the adjusted 0.001% level.
Discussion
Overall, negative attitudes were lowest towards the non-psychiatric case, which interestingly did not differ significantly from depression. The level of stigma
increased continuously along a gradient from
depression to schizophrenia to substance-use dis-orders. This implicit rank-order of disorders with respect to stigma has been found previously (Crisp et al. 2005; Pescosolido et al. 2010). The heightened stigma towards persons with substance-use disorders might be explained in several ways. For example, stigma may occur more frequently because addicted persons are considered to have a bad character or to be much more weak minded and self-responsible for their distress than persons with schizophrenia or depression (Martin et al. 2000; Pescosolido et al. 2010). Furthermore, subjects with substance-use dis-orders are often labelled as dangerous and unpredict-able (Pescosolido et al. 2010).
Table 3. Stigma measures in association with interaction effects between vignette and labelling
Stigma scale Recognition Pos stereo Neg stereo Soc distance Discr beliefs
Mean (95% CI) Mean (95% CI) Mean (95% CI) Mean (95% CI) Stress No disorder 2.10 (2.02–2.17)a 1.88 (1.81–1.95) 1.59 (1.50–1.68) 1.91 (1.84–1.98) Mental disorder 1.87 (1.75–1.99)b 1.91 (1.81–2.02) 1.65 (1.54–1.76) 2.02 (1.93–2.12) Depression No disorder 1.92 (1.80–2.03) 1.87 (1.76–1.97) 1.60 (1.49–1.71) 2.09 (2.00–2.17) Mental disorder 1.90 (1.76–2.03) 2.00 (1.88–2.12) 1.77 (1.63–1.90) 2.03 (1.94–2.12) Identification 1.75 (1.67–1.83) 1.93 (1.86–2.00) 1.60 (1.52–1.68) 2.12 (2.05–2.18) Schizophrenia No disorder 1.96 (1.90–2.02)a 1.93 (1.86–2.00)a 1.62 (1.56–1.69) 2.12 (2.08–2.17)a Mental disorder 1.78 (1.74–1.82)b 2.02 (1.98–2.05) 1.71 (1.67–1.75) 2.22 (2.18–2.25)b Identification 1.74 (1.67–1.81)b 2.13 (2.06–2.20)b 1.61 (1.54–1.69) 2.39 (2.32–2.46)c Alcohol No disorder 1.64 (1.47–1.80) 2.01 (1.87–2.15) 2.35 (2.19–2.50)a 2.25 (2.13–2.37) Mental disorder 1.61 (1.50–1.73) 2.16 (2.03–2.29) 2.13 (2.00–2.25) 2.36 (2.25–2.47) Identification 1.70 (1.62–1.78) 2.08 (2.01–2.15) 2.08 (1.99–2.16)b 2.32 (2.26–2.38) Cocaine No disorder 1.61 (1.50–1.72) 2.07 (1.97–2.18) 2.18 (2.06–2.31) 2.30 (2.21–2.39) Mental disorder 1.73 (1.62–1.84) 2.17 (2.07–2.27) 2.13 (2.00–2.26) 2.29 (2.20–2.37) Identification 1.59 (1.50–1.68) 2.15 (2.07–2.22) 2.16 (2.06–2.25) 2.35 (2.28–2.41) Waldχ2, significance 164.3, p = 0.000 97.1, p = 0.000 421.6, p = 0.000 186.2, p = 0.000 Estimates followed by different superscripts within a cell differ significantly.
Independent of the vignette, our data suggested that labelling of mental disorders might be related to greater stigma, which is in line with the literature (Martin et al. 2000; Peluso & Blay, 2009). We found this to be especially true for stereotypes and discriminating beliefs towards persons with schizophrenia, for which our data clearly indicated that identification of schizophrenia sig-nificantly increased stigmatizing attitudes. A preponder-ance of studies has shown that schizophrenia and substance-use disorders, but especially schizophrenia comorbid with substance use, are associated with higher rates of violent crimes and homicide (Swartz et al. 1998; Arseneault et al. 2000; Fazel & Grann, 2004). Thus, it appears that most stereotypes bear a kernel of truth. The independent impact of perceived dangerousness as a very important mediator of stigma has been stressed by various authors (Link et al. 1999; Martin et al. 2000). However, one must also note that such effects of label-ling are undoubtedly shaped and biased through the influence of the media (Dubugras et al. 2011) or by socio-cultural characteristics (Abdullah & Brown, 2011; Hengartner et al. 2012). Stigma is per definition deeply embedded and entrenched with different socio-cultural characteristics, beliefs and values. This is an important issue that has mostly been disregarded until present (Abdullah & Brown, 2011).
Presumably, no one would have a greater
knowl-edge about schizophrenia than mental health
professionals. Nevertheless, earlier studies have pro-vided some evidence that they may report even more stigmatizing attitudes than the general public (Jorm et al. 1999; Lauber et al. 2006). If that is true, then increased recognition of the disorder and personal con-tact with schizophrenic patients may even increase stigma in the general population, as indicated by results from the USA (Torrey, 1997). This finding poses serious doubts about whether recognition as a key element of mental health literacy may be an appro-priate intervention to ease the stigma towards persons with schizophrenia. Concretely, greater recognition may explain why those extensive efforts put into numerous anti-stigma programmes have not consider-ably reduced public stigma over the last decade in England (Crisp et al. 2005). Moreover, some evidence indicates that stigma has in fact grown within the general population in both Germany (Angermeyer
& Matschinger, 2005) and the United States
(Pescosolido et al. 2010).
Therefore, the objective of future research should be to examine specific effects of labelling. Those studies should also address the question why the positive association between recognition and stigma is predo-minantly found with schizophrenia but not with other disorders. Intriguingly, with respect to alcohol dependence, we found here that recognition and
identification were associated with less desire for social distance. Why that might be true is quite surprising if one considers that in our study and many others this disorder was perceived overall as very unfavourable. Although labelling the disorder did diminish social distance, the mean value was still considerably greater when compared to that for depression or schizo-phrenia. This is another striking finding that needs further investigation.
Finally, our study was subject to some limitations. First, participants expressed only attitudes about stigma, which may be biased through effects of social desirability. However, that is a general incertitude with attitude surveys. Second, this is a population-based sample and not a sample completely representa-tive of the general population because in telephone surveys there are typically persons that are not or hardly accessible. Third, vignettes are sensitive to the case description and usually depict prototypes that one may not frequently encounter in daily life.
Conflict of Interests None.
M. P. Hengartner1,*, A. A. Loch2, F. L. Lawson2, F. B. Guarniero2, Y.-P. Wang2, W. Rössler1,3and W. F. Gattaz2 1Department of General and Social Psychiatry, Psychiatric University Hospital Zurich, Zurich, Switzerland 2Department and Institute of Psychiatry, School of Medicine, University of São Paulo, Brazil 3Collegium Helveticum, A Joint Research Institute between the University of Zurich and the Swiss Federal Institute of Technology, Zurich, Switzerland
References
Abdullah T, Brown TL (2011). Mental illness stigma and ethnocultural beliefs, values, and norms: an integrative review. Clinical Psychology Review 31, 934–948.
Angermeyer MC, Matschinger H (2005). Causal beliefs and attitudes to people with schizophrenia. Trend analysis based on data from two population surveys in Germany. British Journal of Psychiatry 186, 331–334.
Arseneault L, Moffitt TE, Caspi A, Taylor PJ, Silva PA (2000). Mental disorders and violence in a total birth cohort: results from the Dunedin Study. Archives of General Psychiatry 57, 979–986.
Corrigan PW (2004). How stigma interferes with mental health care. American Psychologist 59, 614–625. Crisp AH, Gelder M, Goddard E, Meltzer H (2005).
Stigmatization of people with mental illnesses: a follow-up study within the changing minds campaign of the Royal College of Psychiatrists. World Psychiatry 4, 106–113.
Dubugras MT, Evans-Lacko S, Mari Jde J (2011). A two-year cross-sectional study on the information about
schizophrenia divulged by a prestigious daily newspaper. Journal of Nervous and Mental Disease 199, 659–665. Fazel S, Grann M (2004). Psychiatric morbidity among
homicide offenders: a Swedish population study. American Journal of Psychiatry 161, 2129–2131.
Hengartner MP, Loch AA, Lawson FL, Guarniero FB, Wang Y-P, Rossler W, Gattaz WF (2012). Attitudes of mental health professionals towards persons with schizophrenia: a transcultural comparison between Switzerland and Brazil. Revista de Psiquiatria Clinica 39, 120–125.
Jorm AF (2000). Mental health literacy. Public knowledge and beliefs about mental disorders. British Journal of Psychiatry 177, 396–401.
Jorm AF, Korten AE, Jacomb PA, Christensen H, Henderson S (1999). Attitudes towards people with a mental disorder: a survey of the Australian public and health professionals. Australian and New Zealand Journal of Psychiatry 33, 77–83.
Lauber C, Nordt C, Braunschweig C, Rossler W (2006). Do mental health professionals stigmatize their patients? Acta Psychiatrica Scandinavica 429, 51–59.
Link BG, Cullen FT, Frank J, Wozniak JF (1987). The social rejection of former mental patients: understanding why labels matter. American Journal of Sociology 92, 1461–1500.
Link BG, Mirotznik J, Cullen FT (1991). The effectiveness of stigma coping orientations: can negative consequences of
mental illness labeling be avoided? Journal of Health and Social Behavior 32, 302–320.
Link BG, Phelan JC, Bresnahan M, Stueve A, Pescosolido BA (1999). Public conceptions of mental illness: labels, causes, dangerousness, and social distance. American Journal of Public Health 89, 1328–1333.
Loch AA, Hengartner MP, Guarniero FB, Lawson FL, Wang Y-P, Gattaz WF, Rossler W (2011). Psychiatrists’ stigma towards individuals with schizophrenia. Revista de Psiquiatria Clinica 38, 173–177.
Martin JK, Pescosolido BA, Tuch SA (2000). Of fear and loathing: the role of‘disturbing behavior’, labels, and causal attributions in shaping public attitudes toward people with mental illness. Journal of Health and Social Behavior 41, 208–223.
Peluso ETP, Blay SL (2009). Public stigma in relation to individuals with depression. Journal of Affective Disorders 115, 201–206.
Pescosolido BA, Martin JK, Long JS, Medina TR, Phelan JC, Link BG (2010).‘A disease like any other’? A decade of change in public reactions to schizophrenia, depression, and alcohol dependence. American Journal of Psychiatry 167, 1321–1330.
Swartz MS, Swanson JW, Hiday VA, Borum R, Wagner HR, Burns BJ (1998). Violence and severe mental illness: the effects of substance abuse and nonadherence to medication. American Journal of Psychiatry 155, 226–231.
Torrey EF (1997). Out of the Shadows: Confronting America’s Mental Illness Crisis. John Wiley & Sons: New York.