Individual Differences in Inhibitory Control
—Relationship Between Baseline Activation
in Lateral PFC and an Electrophysiological Index of Response Inhibition
Bastian Schiller, Lorena R.R. Gianotti, Kyle Nash and Daria Knoch
Social and Affective Neuroscience, Department of Psychology, University of Basel, Basel, Switzerland
Bastian Schiller and Lorena R.R. Gianotti contributed equally to this work.
Address correspondence to Bastian Schiller, Social and Affective Neuroscience, Department of Psychology, University of Basel, Birmannsgasse 8, CH-4055 Basel, Switzerland. Email: [email protected]
The capacity to inhibit inappropriate responses is crucial for
goal-directed behavior. Inhibiting such responses seems to come more
easily to some of us than others, however. From where do these
individual differences originate? Here, we measured 263
partici-pants
’ neural baseline activation using resting
electroencephalo-gram. Then, we used this stable neural marker to predict a reliable
electrophysiological index of response inhibition capacity in the cued
Continuous Performance Test, the NoGo-Anteriorization (NGA). Using
a source-localization technique, we found that resting delta, theta,
and alpha1 activity in the left middle frontal gyrus and resting
alpha1 activity in the right inferior frontal gyrus were negatively
correlated with the NGA. As a larger NGA is thought to represent
better response inhibition capacity, our
findings demonstrate that
lower levels of resting slow-wave oscillations in the lateral
prefron-tal cortex, bilaterally, are associated with a better response
inhi-bition capacity.
Keywords: continuous performance test, NoGo-anteriorization, prefrontal
cortex, response inhibition, resting EEG
Introduction
Stopping an action is required in many everyday tasks, such
as stopping a vehicle at traf
fic lights or preventing impulsive
verbal behavior. This capacity to inhibit inappropriate
responses, that is, response inhibition, is typically identi
fied
as a major component of executive functions (e.g.
Aron 2008
;
Hofmann et al. 2012
). Without response inhibition, we would
struggle to adapt to dynamically changing environments that
call for prioritizing our actions in accordance with our internal
goals and external demands. Such capacity, however, seems
to come more easily to some of us than others: Individuals
differ greatly in their response inhibition capacity with low
capacity being a key feature of a variety of neurological and
psychiatric diseases, such as attention-de
ficit hyperactivity
dis-order (ADHD) and substance abuse (e.g.
Aron and Poldrack
2005
;
Nigg et al. 2006
; for a review see
Robbins et al. 2012
).
The goal of this study was to shed light on the largely unknown
sources of individual differences in inhibitory capacity. For that
purpose, we measured a reliable electrophysiological index of
response inhibition, the NoGo-Anteriorization (NGA;
Fallgatter
and Strik 1999
). We then used participants
’ task-independent
neural baseline activation in order to explain individual variance
in the NGA.
When trying to measure response inhibition capacity in the
laboratory, one faces the challenge that successfully executed
response inhibition leads to no observable outcome. One way
to meet this challenge is to indirectly infer response inhibition
capacity from behavioral performance in Go
–NoGo
para-digms. These paradigms require a speeded motor response to
one stimulus (
“Go-stimulus”) and withholding a prepotent
response to another stimulus (
“NoGo-stimulus”). Performance
indices include the reaction times in successfully executed
responses after Go-stimuli and the number of errors, such as
pressing a button when no response is required (
“commission
error
”) and missing a button press when a response is required
(
“omission error”). These behavioral performance indices,
however, do not provide a direct measure of the processes
exe-cuted during response inhibition and often fail to discriminate
between patients characterized by a disinhibited pathology and
healthy controls (e.g.
Kemner et al. 1996
;
Karayanidis et al.
2000
). Alternatively, brain activity can be quanti
fied during the
execution of response inhibition, enabling a more direct index
of inhibitory capacity. A task which is ideally suited for that
purpose is the cued Continuous Performance Test (CPT;
Rosvold et al. 1956
;
Fallgatter et al. 1997
). In this task,
“prime”
cues prompt the subject to anticipate a motor reaction, which
must be executed if followed by a target stimulus (
“Go-condition
”) and suppressed if followed by a nontarget stimulus
(
“NoGo-condition”). As NoGo- and Go-stimuli are equally
prob-able, the comparison of brain responses between NoGo- and
Go-stimuli is not confounded by oddball effects, that is,
fre-quency of stimuli effects (
Liddle et al. 2001
;
Lavric et al. 2004
).
Through comparing brain activation in the NoGo-condition with
that in the Go-condition by means of electroencephalography
(EEG), one can identify the neural mechanisms of inhibiting
versus executing a motor response, capitalizing on the excellent
temporal resolution of EEG on a milliseconds level.
In particular, the comparison of EEG scalp maps between
the NoGo- and Go-condition around 300 ms after stimulus
onset consistently shows an anteriorization of the positive
centroid (i.e., the center of gravity of the positive brain
electri-cal
field) in the Nocondition when compared with the
Go-condition. This is referred to as NGA. The NGA has been
pro-posed to be a reproducible and temporally stable (
Fallgatter
et al. 2001
;
Fallgatter, Aranda et al. 2002
) electrophysiological
index of inhibitory brain function, with a larger NGA
repre-senting a better response inhibition capacity (
Fallgatter and
Strik 1999
). Evidence for the validity of this index has been
supplied by studies that report a smaller NGA in patients
with ADHD (e.g.
Fallgatter et al. 2005
) and schizophrenia
(e.g.
Fallgatter and Mueller 2001
). Further, a smaller NGA has
also been observed in individuals possessing risk alleles of
genes putatively associated with these same disorders, which
are well known for involving a disturbed response inhibition
capacity (e.g.
Ehlis et al. 2007
;
Baehne et al. 2009
).
Subjects strongly differ in their response inhibition capacity
as measured by the NGA (e.g.
Fallgatter et al. 2001
). But
© The Author 2013. Published by Oxford University Press. All rights reserved.Cerebral Cortex September 2014;24:2430–2435 doi:10.1093/cercor/bht095
where do these individual differences come from? Only weak
associations have been found between demographic or
per-sonality variables and the NGA (
Fallgatter et al. 1999
;
Fallgat-ter and Herrmann 2001
). A number of candidate gene studies
have identi
fied certain genetic sources of variability in the
NGA (for a recent example, see
Heinzel et al. 2012
).
However, no study has yet examined whether dispositional
neural markers predict individual differences in the NGA.
Such neural markers can be captured by measuring an
indi-vidual
’s neural baseline activation with EEG, while he or she
is at rest and not engaged in any speci
fic task (resting EEG). A
number of studies have demonstrated that individual resting
EEG is stable over a period of years (e.g.
Smit et al. 2005
;
Nap
flin et al. 2007
). Therefore, resting EEG allows the
measurement of stable individual differences in neural
func-tioning at rest and can be used to explain individual
differ-ences seen either in behavioral responses (e.g.
Pizzagalli et al.
2006
;
Gianotti et al. 2012
) or in event-related potentials
(ERPs; e.g.
Polich 1997
;
Lee et al. 2011
;
Nash et al. 2012
).
In this study, we investigated whether neural baseline
acti-vation might explain individual differences in inhibitory brain
function as measured by the NGA. For that purpose, we
first
measured participants
’ EEG at rest. Secondly, we quantified
participants
’ inhibitory capacity in the cued CPT by means of
the NGA. As it has been consistently shown that
frontocingu-late regions encompassing the frontocingu-lateral prefrontal cortex (PFC)
and anterior cingulate cortex (ACC) are more active during
the NoGo- compared with the Go-condition (e.g.
Fallgatter,
Bartsch et al. 2002
;
Garavan et al. 2002
;
Swick et al. 2011
), we
hypothesized that baseline activation in these areas would be
related to the NGA.
Materials and Methods
ParticipantsParticipants were recruited at the University of Basel. Inclusion cri-teria were: age between 18 and 40 years, right-handedness, normal, or corrected-to-normal vision. Participants were excluded if they re-ported current or past neurological or psychiatric illness. Two hundred and ninety-seven participants were enrolled. Twenty-seven participants were excluded from analyses because of excessive arti-facts in the EEG recording. Seven participants were excluded from analyses because of missing behavioral data due to technical pro-blems, extreme reaction times, and/or error rates in the CPT. Mean age of the remaining 263 participants (172 females) was 23.4 years (SD = 3.8). The study was approved by the local ethics committee. Participants were remunerated with 30 Swiss francs (1 Swiss franc = $1 US) for participating.
Procedure
Upon arriving at the laboratory, participants signed an informed consent form. Participants were seated comfortably in a dimly lit, quiet room, with intercom connection to the experimenters. In afirst step, EEG was recorded during rest with open or closed eyes. The protocol consisted of 20-s eyes open followed by 40-s eyes closed, re-peated 5 times. We analyzed data only from the 200-s eyes-closed con-dition. In a second step, we recorded EEG while participants performed the cued version of the CPT (Rosvold et al. 1956;Fallgatter et al. 1997).
Continuous Performance Test
This task requires the preparation and execution of responses to pre-defined target stimuli and the inhibition of the anticipated response to nontarget stimuli. Participants were instructed to press a response
button whenever the letter O ( primer) is directly followed by the letter X (target; “Go-condition”). If the letter O is followed by any other letter than X (nontarget), participants were instructed not to respond (“NoGo-condition”). Participants were told to give their answers as quickly and accurately as possible. The stimulus set con-sisted of 400 letters (12 different letters: A, B, C, D, E, F, G, H, J, L, O, and X). Of those, 80 were primer stimuli, followed by 40 target stimuli and 40 nontarget stimuli. The remaining stimuli were 240 dis-tractor letters (other letters, or X without a preceding O). Letters were presented on a computer screen in a pseudorandomized order one at a time for 200 ms with an interstimulus interval of 1650 ms. The task lasted for about 13 min.
Electrophysiological Equipment
A continuous EEG was recorded at a sampling rate of 512 Hz (24 bit precision; bandwidth: 0.1–100 Hz) from 64 Ag–AgCl active electrodes positioned according to the 10/10 system montage (Nuwer et al. 1998). During the recordings, the signals were referenced to a common-mode sense, while driven right leg served as ground. Hori-zontal and vertical electro-oculographic signals were recorded with electrodes at the left and right outer canthi and left infraorbital. Eye-movement artifacts were corrected by independent component analysis. EEG signals from channels with corrupted signals were interpolated.
Resting EEG Data Processing
A computerized artifact rejection was applied to the EEG collected at rest (maximal allowed voltage step: 15 µV/ms; minimal allowed activity in intervals of 100-ms length: 0.5 µV; maximal allowed ampli-tude: ±100 µV). Data were additionally examined visually to eliminate residual artifacts (e.g. large movement-related artifacts). All available artifact-free 2048-ms EEG epochs were extracted and recomputed against the average reference. On average, there were 84.5 epochs (SD = 16.1) available per subject. A fast Fourier Transformation (using a square window) was applied to each epoch and channel to compute the power spectra with 0.5-Hz resolution. The spectra for each channel were averaged over all epochs for each participant. Absolute power spectra were integrated for the following 7 independent fre-quency bands (Kubicki et al. 1979): Delta (1.5–6 Hz), theta (6.5–8 Hz), alpha1 (8.5–10 Hz), alpha2 (10.5–12 Hz), beta1 (12.5–18 Hz), beta2 (18.5–21 Hz), and beta3 (21.5–30 Hz).
ERP Data Processing
EEG data collected during the CPT werefiltered offline with a band-pass from 0.1 to 30 Hz. After a computerized artifact rejection (only amplitudes <70 µV in all EEG channels within 200 ms before and 1000 ms after stimulus presentation were allowed), data were additionally examined visually to eliminate residual artifacts. All avail-able artifact-free EEG epochs after correct responses were re-referenced to an average reference and averaged to Go and NoGo ERPs. All participants had at least 20 artifact-free and correct-response Go and NoGo epochs. On average, 34.3 Go epochs (SD = 4.4) and 33.7 NoGo epochs (SD = 5.1) were available for averaging. Two-dimensional positive area centroids (Koenig and Gianotti 2009) of P300 field maps were calculated for the Go- and NoGo-conditions using individual P300 peaks. P300 peaks were defined as the most positive deflection within the P300 microstate (240–484 ms for the Go-condition and 304–444 ms for the NoGo-condition) at electrodes Pz (Go) and Cz (NoGo), respectively. Briefly, the term “microstates” refers to short time periods of relatively stable electricalfield configur-ations that are assumed to correspond to different steps of in-formation processing (for further explanation of the methodology see, e.g.,Michel et al. 2009).
The location of each individual centroid was quantified on an anterior–posterior axis of a coordinate system, resulting from the planar projection of the electrode array onto a rectangular grid. Cen-troids could obtain values between 1 ( position of the electrode Fpz) and 9 ( position of Oz) as illustrated in Supplementary Fig. 1. Smaller values of centroid locations indicate a more anterior localization. Finally, the NGA was calculated individually as the difference
between Go and NoGo centroids on this anterior–posterior axis such that more positive numbers indicate a larger NGA.
Source Localization
Standardized low-resolution brain electromagnetic tomography (sLORETA;Pascual-Marqui 2002) was used to estimate the intracereb-ral electrical sources that generated the scalp-recorded activity. sLORETA computes electrical neuronal activity as current density (A/m2) without assuming a predefined number of active sources. The
sLORETA solution space consists of 6239 voxels (voxel size: 5 × 5 × 5 mm) and is restricted to cortical gray matter and hippocampi, as defined by the digitized Montreal Neurological Institute probability atlas. Using the option automatic regularization method in the sLORETA software, we chose the transformation matrix with the signal-to-noise ratio set to 10. To reduce confounds that have no regional specificity, for each subject, sLORETA images were normalized to a total power of one and then log-transformed before statistical analyses.
Statistical Analysis
The main goal of this study was to assess links between neural base-line activation and the NGA. Accordingly, sLORETA was applied to estimate the intracerebral electrical sources generating the scalp-recorded activity, and a voxel-wise correlation approach was used to identify brain regions whose baseline activations correlate with the NGA, separately for each EEG frequency band. We restricted our voxel-by-voxel correlation analyses to all voxels encompassing prefrontal regions [Brodmann areas (BAs) 8, 9, 10, 11, 44, 45, 46, and 47; 1331 voxels] and anterior cingulate regions (BAs 24, 32, and 33; 313 voxels). Correction for multiple testing (for all voxels of the fron-tocingulate regions) was implemented by means of a nonparametric randomization approach (Nichols and Holmes 2002). The nonpara-metric randomization approach was used to estimate empirical prob-ability distributions and the corresponding corrected (for multiple comparisons) critical probability thresholds.
sLORETA was also used in order to identify brain activation during the CPT that significantly contributed to the NGA. Current density images were computed at individual P300 peaks for Go- and NoGo-conditions, respectively. Descriptive t-statistic whole-brain images of the differences between the Go- and NoGo-conditions at individual P300 peaks were computed.
Results
Behavioral Data
On average, participants made 0.4 (SD = 0.8) errors of omission
(misses) in the 40 Go-trials and 0.2 (SD = 0.5) errors of
com-mission (false alarms) in the 40 NoGo-trials. Mean reaction
times for correct responses were 387.4 ms (SD = 77.4).
Electrophysiological Data
ERP Data
The latencies of the individual P300 peaks within the P300
microstate in the NoGo-condition (365.4 ± 30.9 ms) were
sig-ni
ficantly prolonged, compared with the P300 peaks in the
Go-condition (328.9 ± 40.6 ms; t
262= 13.0, P < 0.0001). The
topographical analysis at the individual P300 peaks revealed a
more anterior location of the positive centroid in the
NoGo-condition
(5.0 ± 0.7),
compared
with
the
Go-condition
(6.7 ± 0.5; t
262= 37.3, P < 0.0001). This well-established
ante-riorization of the positive centroid in the NoGo- compared
with the Go-condition (NGA) was consistently found in 99%
of our participants (260 of 263). The NGA correlated
nega-tively
with
the
reaction
time
for
correct
responses
(r
261=
−0.14, P = 0.02), suggesting that a better response
inhi-bition capacity is correlated with faster reactions in Go trials.
Whole-brain analyses with sLORETA were applied to identify
brain regions contributing to the NGA. The source localization
for the contrast NoGo- versus Go-condition indicated stronger
activity in the lateral PFC, bilaterally, and in the ACC [ peak
voxel: MNI (x, y, z) 0, 15, 35 in the cingulate gyrus, see
Sup-plementary Fig. 2).
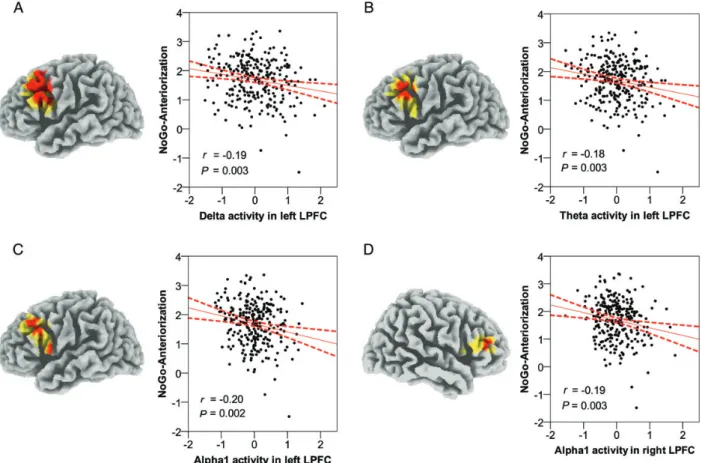
Relationship Between EEG Baseline Activation and NGA
Using sLORETA to estimate intracerebral sources underlying
scalp-recorded resting EEG, we found that, in the delta
(1.5
–6 Hz), theta (6.5–8 Hz), and alpha1 (8.5–10 Hz)
fre-quency bands, there were voxels showing negative signi
ficant
correlations between current density and NGA (P < 0.05,
cor-rected for multiple testing). In the delta band, all 53 signi
fi-cant voxels fell into one cluster in the BAs 8, 9, 44, 45, and 46
in the left hemisphere [ peak voxel: MNI (x, y, z) −50, 15, 40
in the middle frontal gyrus, BA 9, Fig.
1
A]. In the theta band,
all the 13 signi
ficant voxels fell into one cluster in the BA 9 in
the left hemisphere [ peak voxel: MNI (x, y, z) −55, 15, 35
in the middle frontal gyrus, BA 9, Fig.
1
B]. In the alpha1
band, the 14 signi
ficant voxels fell into 2 clusters: one in BAs
9 and 44 in the left hemisphere [ peak voxel: MNI (x, y, z)
−50, 25, 35 in the middle frontal gyrus, BA 9, Fig.
1
C] and
another in BA 46 in the right hemisphere [ peak voxel: MNI
(x, y, z) 50, 40, 20 in the inferior frontal gyrus, BA 46,
Fig.
1
D]. The significant negative correlations between current
density within the clusters (i.e., averaged current density
across voxels within each cluster) in the left lateral PFC and
NGA were: delta: r
261=
−0.19, P = 0.003; theta: r
261=
−0.18,
P = 0.003; and alpha1: r
261=
−0.20, P = 0.002. In the right
lateral PFC, the signi
ficant negative correlation between
current density within the cluster in alpha1 and NGA was
r
261=
−0.19, P = 0.003. Our results thus demonstrate that
lower levels of resting slow-wave oscillations in the lateral
PFC were associated with a larger NGA, that is, a better
response inhibition capacity.
Discussion
Using resting EEG in 263 participants to explain individual
differences in the NGA, we found that slow-wave oscillations
originating from lateral prefrontal regions were related to this
electrophysiological index of response inhibition. More
spec-i
fically, lower delta, theta, and alpha1 current density in the
left middle frontal gyrus and lower alpha1 current density in
the right inferior frontal gyrus were associated with a more
pronounced NGA.
Previous studies have demonstrated that overall power in
slower frequency bands of resting EEG is a valid source of
individual variability in amplitude and latency of various ERP
components (e.g.
Polich 1997
;
Ramos-Loyo et al. 2004
;
Lee
et al. 2011
). Our study went a step further, as we estimated
the intracerebral sources of baseline activation in the distinct
frequency bands by means of sLORETA (
Pascual-Marqui
2002
). Thus, we were able to identify brain regions with
acti-vation levels at rest that were signi
ficantly correlated with the
NGA. Because resting slow-wave oscillations are primarily
considered to be inversely related to cortical activation (e.g.
Shagass 1972
;
Oakes et al. 2004
), our results indicate that
higher baseline activation in the lateral PFC, bilaterally, was
associated with a larger NGA, that is, a better response
inhi-bition capacity (a word of caution is appropriate here as
recent literature suggests a complex interpretation of the
func-tional role of EEG slow-waves at rest, see e.g.
O
’Gorman et al.
2012
). This
finding is consistent with converging evidence
that lateral prefrontal regions are important in inhibiting
responses. These regions are activated when subjects execute
response inhibition (e.g.
Garavan et al. 2002
;
Aron et al. 2004
;
Swick et al. 2011
). Both patients with lesions in the lateral
PFC (e.g.
Aron et al. 2003
), and healthy subjects in which
these regions were temporarily disrupted by means of
repeti-tive transcranial magnetic stimulation (e.g.
Chambers et al.
2006
), show de
ficits in response inhibition. Moreover, an
indi-vidual
’s degree of inhibitory control across a wide range of
regulatory processes is related to baseline activation level in
the lateral PFC measured by resting EEG (
Gianotti et al. 2009
;
Knoch et al. 2010
;
Gianotti et al. 2012
).
We additionally wondered whether baseline activation in
the ACC would also explain individual variance in response
inhibition capacity, as measured by the NGA. Although the
ACC is more strongly activated during the NoGo- compared
with the Go-condition in the range of the P300 (i.e. the
period in which the NGA is calculated; see Supplementary
Fig. 2), we did not
find a significant relationship between this
region
’s baseline activation and the NGA. We want to stress
the fact that the direct comparison between the 2 conditions
in the range of the P300 might have not only revealed brain
activity related to the process of response inhibition, as
several other processes are likely taking place in parallel,
in-cluding performance monitoring and con
flict detection.
Indeed, the ACC has been more consistently related to these
latter processes than to response inhibition (e.g.
Braver et al.
2001
;
Botvinick et al. 2004
;
Berkman et al. 2012
).
The moderate relationship between baseline activation in
the PFC and the NGA, while a relevant observation, suggests
that PFC baseline activation may not unerringly index
var-iance in response inhibition capacity. We encourage direct
manipulations of PFC activation in subsequent research to
bolster the
findings presented here. Moreover, future studies
could try to identify variables (e.g. personality traits, genes, or
patterns of baseline activation in those subcortical regions,
which are not detectable with EEG) that potentially moderate
the link between PFC baseline activation and the NGA.
Future research could also combine the measurement of
both independent neural baseline activation and
task-dependent NGA in patient populations. It has been repeatedly
shown that patients with a disturbed response inhibition
capacity (e.g. ADHD and schizophrenia) have a smaller NGA
(e.g.
Fallgatter and Mueller 2001
;
Fallgatter et al. 2005
;
Dresler et al. 2010
). Other studies showed abnormal
resting-state activity in both ADHD and schizophrenic patients,
namely increased power in the slow frequency bands (e.g.
Figure 1. Relationship between the NGA and EEG baseline activation (A/m2). In eachfigure, on the left side, locations of the voxels that showed significant correlations are indicated in red (P < 0.05) or in yellow (0.05<P < 0.10) and, on the right side, scatter plots are shown demonstrating the relationship between the NGA and EEG baseline activation in the respective frequency band and region, including regression lines and confidence intervals (95%). We found significant negative correlations between the NGA and current density in the left middle frontal gyrus in the delta (A; BAs 8/9/44/45/46), theta (B; BA 9), and alpha1 (C; BAs 9/44) frequency bands and in the right inferior frontal gyrus in the alpha1 (D; BA 46) frequency band. Note that resting delta, theta, and alpha activity are inverse indicators of cortical activation, meaning that higher baseline activation in the lateral PFC predicts a larger NGA, that is, a better response inhibition capacity.
Koehler et al. 2009
;
Hong et al. 2012
). Based on the present
results, it would be worth examining whether a patient
’s
inhibitory de
ficits (reflected in a smaller NGA) are linked to
lower baseline activation in the lateral PFC (re
flected in
in-creased power in the slow frequency bands). If this appears
to be true, our
findings could even serve to promote
neuro-feedback training to increase baseline activation in lateral
frontal regions to enhance the NGA, that is, response
inhi-bition capacity. Indeed, neurofeedback treatments are already
applied with some success to treat ADHD (e.g.
Kropotov et al.
2005
;
Arns et al. 2009
;
Lofthouse et al. 2012
). The results of
our study could help to inform these efforts and to increase
treatment precision by using tomographic neurofeedback (e.
g.
Congedo et al. 2004
;
Liechti et al. 2012
) in order to speci
fi-cally target certain slow-wave oscillations originating from
particular lateral prefrontal regions.
Supplementary Material
Supplementary material can be found at: http://www.cercor. oxfordjournals.org/.
Funding
This work was supported by the OPO Foundation, the Swiss
National Science Foundation (PP00P1-123381), the
“For-schungsfonds
” of the University of Basel, and the Mens Sana
Foundation.
Notes
We thank U. Bircher, D. Chrobot, M. Filser, N. Gross, B. Henzi, L. Hoffmann, A.-C. Körner, E. Meissner, C. Michels, N. Scheurer, and K. Stadler for their help in collecting and preprocessing the data. Conflict of Interest: None declared.
References
Arns M, de Ridder S, Strehl U, Breteler M, Coenen A. 2009. Efficacy of neurofeedback treatment in ADHD: the effects on inattention, im-pulsivity and hyperactivity: a meta-analysis. Clin EEG Neurosci. 40:180–189.
Aron AR. 2008. Progress in executive-function research: from tasks to functions to regions to networks. Curr Dir Psychol Sci. 17:124–129. Aron AR, Fletcher PC, Bullmore ET, Sahakian BJ, Robbins TW. 2003.
Stop-signal inhibition disrupted by damage to right inferior frontal gyrus in humans. Nat Neurosci. 6:115–116.
Aron AR, Poldrack RA. 2005. The cognitive neuroscience of response inhibition: relevance for genetic research in attention-de ficit/hy-peractivity disorder. Biol Psychiatry. 57:1285–1292.
Aron AR, Robbins TW, Poldrack RA. 2004. Inhibition and the right inferior frontal cortex. Trends Cogn Sci. 8:170–177.
Baehne CG, Ehlis AC, Plichta MM, Conzelmann A, Pauli P, Jacob C, Gutknecht L, Lesch KP, Fallgatter AJ. 2009. Tph2 gene variants modulate response control processes in adult ADHD patients and healthy individuals. Mol Psychiatry. 14:1032–1039.
Berkman ET, Falk EB, Lieberman MD. 2012. Interactive effects of three core goal pursuit processes on brain control systems: goal maintenance, performance monitoring, and response inhibition. Plos One. 7:e40334.
Botvinick MM, Cohen JD, Carter CS. 2004. Conflict monitoring and anterior cingulate cortex: an update. Trends Cogn Sci. 8:539–546. Braver TS, Barch DM, Gray JR, Molfese DL, Snyder A. 2001. Anterior
cingulate cortex and response conflict: effects of frequency, inhi-bition and errors. Cereb Cortex. 11:825–836.
Chambers CD, Bellgrove MA, Stokes MG, Henderson TR, Garavan H, Robertson IH, Morris AP, Mattingley JB. 2006. Executive“brake
failure” following deactivation of human frontal lobe. J Cogn Neurosci. 18:444–455.
Congedo M, Lubar JF, Joffe D. 2004. Low-resolution electromagnetic tom-ography neurofeedback. IEEE Trans Neural Syst Rehabil. 12:387–397. Dresler T, Ehlis AC, Heinzel S, Renner TJ, Reif A, Baehne CG, Heine
M, Boreatti-Hummer A, Jacob CP, Lesch KP et al. 2010. Dopamine transporter (SLC6A3) genotype impacts neurophysiological corre-lates of cognitive response control in an adult sample of patients with ADHD. Neuropsychopharmacology 35:2193–2202.
Ehlis AC, Reif A, Herrmann MJ, Lesch KP, Fallgatter AJ. 2007. Impact of catechol-O-methyltransferase on prefrontal brain functioning in schizophrenia spectrum disorders. Neuropsychopharmacology 32: 162–170.
Fallgatter AJ, Aranda DR, Bartsch AJ, Herrmann MJ. 2002. Long-term reliability of electrophysiologic response control parameters. J Clin Neurol. 19:61–66.
Fallgatter AJ, Bartsch AJ, Herrmann MJ. 2002. Electrophysiological measurements of anterior cingulate function. J Neural Transm. 109:977–988.
Fallgatter AJ, Bartsch AJ, Strik WK, Mueller TJ, Eisenack SS, Neuhau-ser B, Aranda D, Herrmann MJ. 2001. Test-retest reliability of elec-trophysiological parameters related to cognitive motor control. Clin Neurophysiol. 112:198–204.
Fallgatter AJ, Brandeis D, Strik WK. 1997. A robust assessment of the NoGo-anteriorisation of P300 microstates in a cued continuous per-formance test. Brain Topogr. 9:295–302.
Fallgatter AJ, Ehlis AC, Rosler M, Strik WK, Blocher D, Herrmann MJ. 2005. Diminished prefrontal brain function in adults with psycho-pathology in childhood related to attention deficit hyperactivity disorder. Psychiatry Res. 138:157–169.
Fallgatter AJ, Herrmann MJ. 2001. Electrophysiological assessment of impulsive behavior in healthy subjects. Neuropsychologia. 39:328–333.
Fallgatter AJ, Mueller TJ. 2001. Electrophysiological signs of reduced prefrontal response control in schizophrenic patients. Psychiatry Res. 107:19–28.
Fallgatter AJ, Mueller TJ, Strik WK. 1999. Age-related changes in the brain electrical correlates of response control. Clin Neurophysiol. 110:833–838.
Fallgatter AJ, Strik WK. 1999. The NoGo-anteriorization as a neuro-physiological standard-index for cognitive response control. Int J Psychophysiol. 32:233–238.
Garavan H, Ross TJ, Murphy K, Roche RAP, Stein EA. 2002. Dissoci-able executive functions in the dynamic control of behavior: inhi-bition, error detection, and correction. Neuroimage. 17:1820–1829. Gianotti LR, Figner B, Ebstein RP, Knoch D. 2012. Why some people
discount more than others: baseline activation in the dorsal PFC mediates the link between COMT genotype and impatient choice. Front Neurosci. 6:54.
Gianotti LR, Knoch D, Faber PL, Lehmann D, Pascual-Marqui RD, Diezi C, Schoch C, Eisenegger C, Fehr E. 2009. Tonic activity level in the right prefrontal cortex predicts individuals’ risk taking. Psychol Sci. 20:33–38.
Heinzel S, Dresler T, Baehne CG, Heine M, Boreatti-Hummer A, Jacob CP, Renner TJ, Reif A, Lesch KP, Fallgatter AJ et al. 2012. COMT × DRD4 epistasis impacts prefrontal cortex function underlying response control. Cereb Cortex. doi:10.1093/cercor/bhs132. Hofmann W, Schmeichel BJ, Baddeley AD. 2012. Executive functions
and self-regulation. Trends Cogn Sci. 16:174–180.
Hong LE, Summerfelt A, Mitchell BD, O’Donnell P, Thaker GK. 2012. A shared low-frequency oscillatory rhythm abnormality in resting and sensory gating in schizophrenia. Clin Neurophysiol. 123: 285–292.
Karayanidis F, Robaey P, Bourassa M, De Koning D, Geoffroy G, Pel-letier G. 2000. ERP differences in visual attention processing between attention-deficit hyperactivity disorder and control boys in the absence of performance differences. Psychophysiology. 37:319–333.
Kemner C, Verbaten MN, Koelega HS, Buitelaar JK, van der Gaag RJ, Camfferman G, van Engeland H. 1996. Event-related brain poten-tials in children with attention-deficit and hyperactivity disorder:
effects of stimulus deviancy and task relevance in the visual and auditory modality. Biol Psychiatry. 40:522–534.
Knoch D, Gianotti LR, Baumgartner T, Fehr E. 2010. A neural marker of costly punishment behavior. Psychol Sci. 21:337–342.
Koehler S, Lauer P, Schreppel T, Jacob C, Heine M, Boreatti-Hummer A, Fallgatter AJ, Herrmann MJ. 2009. Increased EEG power density in alpha and theta bands in adult ADHD patients. J Neural Transm. 116:97–104.
Koenig T, Gianotti LRR. 2009. Scalpfield maps and their characteriz-ation. In: Michel CM, Koenig T, Brandeis D, Gianotti LRR, Wack-ermann J, editors. Electrical neuroimaging. Cambridge (GB): Cambridge University Press. p. 25–47.
Kropotov JD, Grin-Yatsenko VA, Ponomarev VA, Chutko LS, Yakoven-ko EA, Nikishena IS. 2005. ERPs correlates of EEG relative beta training in ADHD children. Int J Psychophysiol. 55:23–34. Kubicki S, Herrmann WM, Fichte K, Freund G. 1979. Reflections on
the topics: EEG frequency bands and regulation of vigilance. Phar-makopsychiatr Neuropsychopharmakol. 12:237–245.
Lavric A, Pizzagalli DA, Forstmeier S. 2004. When“go” and “nogo” are equally frequent: ERP components and cortical tomography. Eur J Neurosci. 20:2483–2488.
Lee TW, Yu YW, Wu HC, Chen TJ. 2011. Do resting brain dynamics predict oddball evoked-potential? BMC Neurosci. 12:121.
Liddle PF, Kiehl KA, Smith AM. 2001. Event-related fMRI study of response inhibition. Hum Brain Mapp. 12:100–109.
Liechti MD, Maurizio S, Heinrich H, Jancke L, Meier L, Steinhausen HC, Walitza S, Drechsler R, Brandeis D. 2012. First clinical trial of tomographic neurofeedback in attention-deficit/hyperactivity dis-order: evaluation of voluntary cortical control. Clin Neurophysiol. 123:1989–2005.
Lofthouse N, Arnold LE, Hersch S, Hurt E, DeBeus R. 2012. A review of neurofeedback treatment for pediatric ADHD. J Atten Disord. 16:351–372.
Michel CM, Koenig T, Brandeis D. 2009. Electrical neuroimaging in the time domain. In: Michel CM, Koenig T, Brandeis D, Gianotti LRR, Wackermann J, editors. Electrical neuroimaging. Cambridge (GB): Cambridge University Press. p. 111–143.
Napflin M, Wildi M, Sarnthein J. 2007. Test-retest reliability of resting EEG spectra validates a statistical signature of persons. Clin Neuro-physiol. 118:2519–2524.
Nash K, Inzlicht M, McGregor I. 2012. Approach-related left prefrontal EEG asymmetry predicts muted error-related negativity. Biol Psychol. 91:96–102.
Nichols TE, Holmes AP. 2002. Nonparametric permutation tests for functional neuroimaging: a primer with examples. Hum Brain Mapp. 15:1–25.
Nigg JT, Wong MM, Martel MM, Jester JM, Puttler LI, Glass JM, Adams KM, Fitzgerald HE, Zucker RA. 2006. Poor response inhibition as a predictor of problem drinking and illicit drug use in adolescents at risk for alcoholism and other substance use disorders. J Am Acad Child Adolesc Psychiatry. 45:468–475.
Nuwer MR, Comi G, Emerson R, Fuglsang-Frederiksen A, Guerit JM, Hinrichs H, Ikeda A, Luccas FJ, Rappelsburger P. 1998. IFCN standards for digital recording of clinical EEG. International Federa-tion of Clinical Neurophysiology. Electroencephalogr Clin Physiol. 106:259–261.
Oakes TR, Pizzagalli DA, Hendrick AM, Horras KA, Larson CL, Aber-crombie HC, Schaefer SM, Koger JV, Davidson RJ. 2004. Func-tional coupling of simultaneous electrical and metabolic activity in the human brain. Hum Brain Mapp. 21:257–270.
O’Gorman RL, Poil SS, Brandeis D, Klaver P, Bollmann S, Ghisleni C, Luchinger R, Martin E, Shankaranarayanan A, Alsop DC et al. 2012. Coupling between resting cerebral perfusion and EEG. Brain Topogr. doi:10.1007/s10548-012-0265-7.
Pascual-Marqui RD. 2002. Standardized low-resolution brain electro-magnetic tomography (sLORETA): technical details. Methods Find Exp Clin Pharmacol. 24(Suppl D):5–12.
Pizzagalli DA, Peccoralo LA, Davidson RJ, Cohen JD. 2006. Resting anterior cingulate activity and abnormal responses to errors in subjects with elevated depressive symptoms: a 128-channel EEG study. Hum Brain Mapp. 27:185–201.
Polich J. 1997. On the relationship between EEG and P300: individual differences, aging, and ultradian rhythms. Int J Psychophysiol. 26:299–317.
Ramos-Loyo J, Gonzalez-Garrido AA, Amezcua C, Guevara MA. 2004. Relationship between resting alpha activity and the ERPs obtained during a highly demanding selective attention task. Int J Psycho-physiol. 54:251–262.
Robbins TW, Gillan CM, Smith DG, de Wit S, Ersche KD. 2012. Neuro-cognitive endophenotypes of impulsivity and compulsivity: towards dimensional psychiatry. Trends Cogn Sci. 16:81–91. Rosvold HE, Mirsky AF, Sarason I, Bransome ED, Beck LH. 1956. A
continuous performance-test of brain-damage. J Consult Psychol. 20:343–350.
Shagass C. 1972. Electrophysiological studies of psychiatric problems. Rev Can Biol. 31(Suppl):77–95.
Smit DJ, Posthuma D, Boomsma DI, Geus EJ. 2005. Heritability of background EEG across the power spectrum. Psychophysiology. 42:691–697.
Swick D, Ashley V, Turken U. 2011. Are the neural correlates of stop-ping and not going identical? Quantitative meta-analysis of two response inhibition tasks. Neuroimage. 56:1655–1665.