CARDIOVASCULAR
Performance of a new pulse contour method for continuous
cardiac output monitoring: validation in critically ill patients
K. Bendjelid
1*, G. Marx
2, N. Kiefer
3, T. P. Simon
2, M. Geisen
4, A. Hoeft
3, N. Siegenthaler
1and C. K. Hofer
4 1Intensive Care Service, Geneva University Hospitals, Geneva, Switzerland2Department of Anaesthesiology, University Hospital Aachen, RWTH Aachen, Aachen, Germany 3
Department of Anesthesiology and Intensive Care Medicine, University of Bonn, Bonn, Germany 4Institute of Anesthesiology and Intensive Care Medicine, Triemli City Hospital Zurich, Zurich, Switzerland
* Corresponding author: Me´decin Adjoint Agre´ge´, Intensive Care Service, Geneva University Hospitals, CH-1211 Geneva 14, Switzerland. E-mail: [email protected]
Editor’s key points
† Previously, continuous cardiac output (CO) measurement techniques required the insertion of a pulmonary artery catheter.
† The PiCCO and
VolumeView systems use arterial pulse contour analysis for continuous CO measurement. † Both require calibration
with transpulmonary thermodilution (TPTD) measurements using a central venous catheter. † The current study
compared the
performance of PiCCO, VolumeView, and TPTD measurements.
Background. A new calibrated pulse wave analysis method (VolumeViewTM/EV1000TM,
Edwards Lifesciences, Irvine, CA, USA) has been developed to continuously monitor cardiac output (CO). The aim of this study was to compare the performance of the VolumeView method, and of the PiCCO2TM pulse contour method (Pulsion Medical Systems, Munich,
Germany), with reference transpulmonary thermodilution (TPTD) CO measurements.
Methods.This was a prospective, multicentre observational study performed in the surgical and interdisciplinary intensive care units of four tertiary hospitals. Seventy-two critically ill patients were monitored with a central venous catheter, and a thermistor-tipped femoral arterial VolumeViewTMcatheter connected to the EV1000TMmonitor. After initial calibration by TPTD
CO was continuously assessed using the VolumeView-CCO software (CCOVolumeView) during a
72 h period. TPTD was performed in order to obtain reference CO values (COREF). TPTD and
arterial wave signals were transmitted to a PiCCO2TM monitor in order to obtain CCOPiCCO
values. CCOVolumeViewand CCOPiCCOwere recorded over a 5 min interval before assessment of
COTPTD. Bland–Altman analysis, %errors, and concordance (trend analysis) were calculated.
Results. A total of 338 matched sets of data were available for comparison. Bias for CCOVolumeView2COREF was 20.07 litre min21 and for CCOPiCCO–COREF +0.03 litre min21.
Corresponding limits of agreement were 2.00 and 2.48 litre min21(P,0.01), %errors29 and 37%, respectively. Trending capabilities were comparable for both techniques.
Conclusions.The performance of the new VolumeViewTM-CCO method is as reliable as the
PiCCO2TM-CCO pulse wave analysis in critically ill patients. However, an improved precision
was observed with the VolumeViewTMtechnique.
Clinicaltrials.gov identifier.NCT01405040.
Keywords:continuous cardiac output; pulse wave analysis; transpulmonary thermodilution Accepted for publication: 13 February 2013
Cardiac output (CO) assessment is a corner stone1 in advanced haemodynamic management, especially in critic-ally ill patients. Pulmonary artery thermodilution (PATD) has been used as a standard method for this purpose for .20 years2–4and is progressively being replaced in many patients by less invasive monitoring techniques.5 6One of these tech-niques is continuous analysis of the arterial pressure wave-form. Today, different companies provide a variety of devices based on this method using different algorithms for the estimation of CO. In general, pulse wave analysis devices can be divided into un-calibrated and calibrated monitoring systems; both can be adequately used in
dedicated settings and patient groups according to their lim-itations and technical properties.7 Based on the fact that there is no ‘perfect’ monitoring device, ongoing development is required that may lead to improved measurements and hence improved patient management.
Recently, a new pulse wave analysis system has been developed and introduced into clinical practice that consists of a specific thermistor-tipped arterial catheter (the VolumeViewTMcatheter) and the EV1000TMmonitoring
plat-form (Edwards Lifesciences, Irvine, CA, USA). The system uses a novel proprietary algorithm to continuously assess CO based on the femoral arterial pressure curve signal and
it uses TPTD for calibration.8 The modified TPTD algorithm has been successfully evaluated recently in an animal model9 and in critically ill patients.10 However, this system has not yet been validated for continuous CO determination against a reference method.
The aim of the present multi-centre clinical study was to compare the new EV1000TM-VolumeViewTM and the
PiCCO2TM pulse contour methods (Pulsion Medical Systems,
Munich, Germany)11–13 with the reference TPTD technique in a mixed population of critically ill patients.
Materials and methods
Patients
This prospective observational study was conducted in four hospital centres in Germany and Switzerland (Aachen, Bonn, Geneva and Zurich). The trial was registered at a public registry (clinicaltrials.gov identifier: NCT01405040). Approval from local institutional review boards at all partici-pating institutions was obtained: (EthikKommission an der Medizinischen Fakulta¨t der Rheinisch-Westfa¨lischen Tech-nischen Hochschule Aachen, Aachen, Germany; Ethikkom-mission an der Medizinischen Fakulta¨t der Rheinischen Friedrich-Wilhelms-Universita¨t Bonn, Bonn, Germany; Com-mission Centrale d’Ethique de la recherche sur l’eˆtre humain, Hoˆpitaux Universitaires de Gene`ve, Gene`ve, Switzer-land; Ethikkommission der beiden Stadtspita¨ler Triemli und Waid, Kantonale Ethikkommission des Kantons Zu¨rich, Zu¨rich, Switzerland).
All patients or their legal representatives gave written informed consent. Patients who had been admitted to an in-tensive care unit (ICU) and who the treating clinician thought required advanced haemodynamic monitoring, were en-rolled. Patients ,18 years or patients with a body weight ,40 kg were not eligible for the study. Other exclusion cri-teria comprised significant aortic regurgitation, use of intra-aortic balloon pump and participation in an investiga-tional drug or device study interfering with endpoints of this study and a known or potential pregnancy. All patients were treated at the discretion of the ICU staff in charge; there was no specific protocol for any intervention.
Devices and measurements
CO assessment was performed during a 72 h observation period in all patients. A VolumeViewTM catheter (diameter:
5 Fr, length 20 cm; Edwards Lifesciences) was introduced into the left or right femoral artery and connected to the EV1000TM system which includes a panel interface and
data box (Edwards Lifesciences, software version 1.0). No complications related to the femoral line during the study period were observed.
Continuous CO was determined by pulse wave analysis using the new VolumeView-CCO software (CCOVolumeView).
TPTD measurements were performed as sets of at least three consecutive injections of 20 ml cold saline via a central venous line, randomly distributed over the respiratory cycle. A bolus was rejected and deleted by the observer,
usually the attending physician, when visual inspection of the TPTD curve revealed artifacts, or a measurement error oc-curred. Boluses were repeated until three valid thermodilu-tion curves were obtained with a reproducibility ≤15%. There was no regular time interval between two successive measurements. All measurements were randomly spread according to the attending physicians. Measurements were performed during the regular ICU treatment of the patients under different ventilator modalities (i.e. completely mechanic-ally ventilated patients, spontaneously breathing patients with and without ventilator support).
The mean CO value of the TPTD measurements was used as the reference method (COREF). These data were
electronic-ally recorded at 500 Hz on the EV1000TM system and
down-loaded for analysis via a universal serial bus connection. Later, arterial pressure data were delivered electronically as real-time procedure into a PiCCO2TM monitor (Pulsion
Medical Systems, Munich, Germany) in order to obtain con-tinuous PiCCO2TM pulse wave analysis CO values (CCOPiCCO)
and these data were also electronically recorded. This pro-cedure is now used on a regular basis for the comparison of different measurement techniques.14 15 Both pulse contour methods were re-calibrated each time TPTD mea-surements were done. CCOVolumeView and CCOPiCCO data for
statistical analysis were recorded during a 5 min interval before assessment of COREF(i.e. just before the re-calibration
of CCOVolumeView and CCOPiCCO). These data, and
measure-ments recorded during a 5 min interval post assessment of COREF, were also used to assess the corresponding changes
of CCOVolumeView, CCOPiCCO, and COREF; initial calibration data
at baseline were excluded from the analysis.
Pulse wave analysis algorithms
The pulse wave analysis algorithm for CCOVolumeView(i.e. the
EV1000TMmonitoring platform), uses a proprietary
‘combin-ation’ CCO algorithm: CCOVolumeView= CO (TPTD)
× f (D conventional pulse-wave parameters, Dadvanced wave shape parameters) ‘Conventional’ pulse-wave parameters are determined con-sidering the fundamental work of Wesseling16 assuming that the area under the systolic part of the pressure wave-form is related to stroke volume by aortic impedance. Further development based on a three-element ‘Windkessel’ model17involved the assessment of the aortic impedance as quotient of an un-calibrated pulse wave stroke volume and a stroke volume derived by TPTD.18 Because only the systolic portion of the pressure wave form is analysed, a detection of the ‘notch’, the transition point after the systolic peak as a result of the aortic valve closure is required. ‘Advanced’ ar-terial pressure wave shape parameters, on the other hand, are derived from analysis of the pressure waveform of the entire heart cycle. An in-depth description of this method can be found in a recent publication.19 In summary, the advanced analysis relies primarily on the assessment of
aortic compliance according to Langewouters and collea-gues20and dedicated waveform assessment, including skew-ness calculations, where symmetry characteristics on arterial pressure indicates a change in vascular tone and resistance, and kurtosis calculations, where the measurement of the di-vergence from a normally distributed wave is associated with large vessel compliance.
The pulse wave analysis algorithm for CCOPiCCO, on the
other hand, is an algorithm based only on the ‘conventional’ pulse-wave parameters described above. Details have been previously described.12 13 The principles of TPTD calibration measurements have also been described in detail else-where.8 9
Statistics
Statistical calculation was performed using the R software (Version 2.11.1, a free software environment for statistical computing; http://www.r-project.org). Linear regression, Bland –Altman analysis21 including % error calculation22 were done in order to compare absolute CCOVolumeViewand
CCOPiCCOwith COREFvalues. Concordance analysis23was
per-formed as trend analysis for changes of CCOVolumeView and
CCOPiCCOwhen compared with changes of COREF; an exclusion
zone of 15% was applied as recommended recently.23 Statis-tical significance was set at a P-value of ,0.05. Results are expressed as mean [standard deviation (SD)].
Results
The study was mainly performed in patients who had under-gone cardiac surgery. Biometric and socio-demographic data of the 72 patients enrolled in this study are presented in Table1. Sixty-one patients were undergoing mechanical ven-tilation. For these patients a total of 338 matched sets of data during a time window of 72 h were collected and ana-lysed. The study period was 34.5 (20.9) h [mean (SD)], range
5.4–72 h. Regarding the number of boluses, 3.6 (1.1) [mean (SD)], range 1–6, were used per CO measurement,
with only 3.7% of the thermodilution sets rejected because of a reproducibility .15%.
CO data are summarized in Table2. A broad range of CO values for all measurement techniques (i.e. CCOVolumeView,
CCOPiCCO, and COREF) was observed with a comparable
mean CO for all measurement techniques. Mean changes of CO and the corresponding range were 5.2 (3.8) litre min21 (0 –14.3) for CCOVolumeView, 5.3 (3.8) litre min21 (0 –
14.9) for CCOPiCCO, and 6.4 (4) litre min21(0–15) for COREF.
Mean arterial pressure during the study period was 10.1 (0.13) kPa (range: 43 –114) and a mean systemic vascular re-sistance was 839 (286) dyn s cm25ranging from 273 to 1940 dyn s cm25.
Comparing CCOVolumeView, and CCOPiCCO with COREF
revealed a low mean bias in the Bland –Altman analysis (Table 2, Fig. 1) that was comparable for both continuous measurement techniques. The precision, defined as SD of
the mean bias, was better when comparing CCOVolumeView
with COREF than when comparing CCOPiCCO with COREF
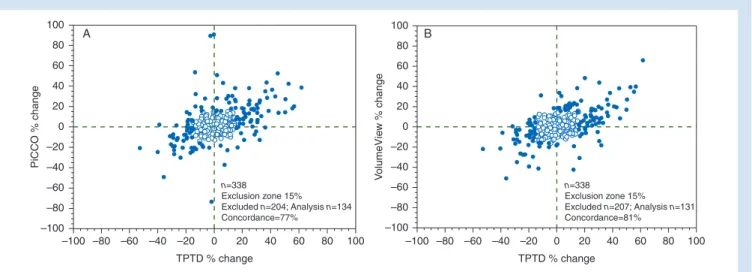
(P,0.01). A high coefficient of correlation (Table2) for both techniques was found when compared with the reference technique, no statistical difference could be detected between correlation coefficients. Trend analysis for both techniques was comparable considering concordance ana-lysis (Table2, Fig.2).
Discussion
This prospective, multi-centric clinical study demonstrates that the assessment of continuous CO in a critically ill patient population using a new pulse wave analysis algo-rithm implemented in the VolumeViewTM-EV1000TM
monitor-ing platform can be characterized as bemonitor-ing as accurate as the established calibrated pulse wave analysis device, the PiCCO2TM method. Moreover, based on the presented data,
the new technique showed an improved precision when compared with the established method.
The CCO-VolumeViewTMalgorithm can be characterized as
‘improvement’ of the classic algorithm established and modi-fied by Wesseling16 18that is also being used of the PiCCO2TM
system. The ‘improvement’ process consisted of the addition-al consideration of an advanced pressure waveform ana-lysis.19 This creates potential advantages for the new combination algorithm. The classic Wesseling algorithm requires ‘only’ the systolic interval of the pressure curve for CO assessment assuming constant aortic properties. This al-gorithm proved to be susceptible for changes in the vascular system with a limited accuracy of CO assessment.24Taking a dynamic interaction between cardiac function and aortic compliance (i.e. aortic impedance) into account resulted in an improved performance.11–13However, for accurate mea-surements a reliable detection of the end of the systole— the ‘notch’—is required, which is not always given in daily practice and in these situations an assumption has to be made when the systole ends. It can be argued that the advanced waveform analysis implemented in the new ‘hybrid’ algorithm may overcome this problem in part as
Table 1 Patient characteristics and indications for ICU admission. ARDS, acute respiratory distress syndrome; BMI, body mass index; F/M, female/male; ICU, intensive care unit; ‘Other’ includes respiratory failure and intracranial bleeding
Sociodemographic
Age Years (range) 66 (25 – 81)
F/M ratio n/n 21/51 Weight kg (SD) 82 (20) Height cm (SD) 172 (8) BMI kg m22( SD) 28 (1.3) ICU admissions Cardiac surgery n (%) 40 (55.6) Non-cardiac surgery n (%) 4 (5.6) Sepsis n (%) 7 (9.7) ARDS n (%) 3 (4.2) Other n (%) 18 (25)
both the systolic and the diastolic waveform portion are assessed. This may better reflect the actual conditions of the cardiovascular system that includes diastolic issues of the aortic Windkessel function,17 diastolic wave reflection and the aortic-femoral pulse coupling.25In this regard, it is important to note that all pulse contour methods should be affected by this physiological phenomenon. Considering the results of the actual study (i.e. the improved precision) it can be argued that the combination of two methods resulted in a more robust algorithm able to capture acute changes in vascular tone. However, previous studies have already demonstrated that CO measurements using advanced waveform computation are less precise and less accurate in patients presenting vasoplegic states.26 And even if, in the present study, patients SVR ranged from 273 to 1940 dyn s cm25, further study should be performed to
evaluate the present CCO-VolumeViewTM algorithm in
vaso-plegic patients.
In contrast to the PiCCO2TM algorithm the CCO—
VolumeViewTMalgorithm met the so-called Critchley criteria
of an acceptable %errorof ,30%,22 but it should be empha-sized that this widely used %errorthreshold has been ques-tioned recently by Peyton and colleagues.26 In their large meta-analysis they demonstrated that no group of the min-imally invasive haemodynamic monitoring systems (i.e. pulse wave analysis, Doppler, Bioimpedance, and applied Fick prin-ciple) met the set %errorthreshold and therefore it has been
argued that for clinical purposes a higher %error should be accepted based on the technical limitations of all CO meas-urement techniques. On the other hand, it is often assumed that the ability to reliably track CO changes is more import-ant than the assessment of absolute CO values23 and in the present study both algorithms showed comparable trending capabilities but failed to meet the goals of an ac-ceptable concordance as proposed by Critchley and collea-gues.23 The concordance analysis for CO trend assessment is clearly an improvement in the evaluation of CO monitoring devices, but a major problem is the lack of ability of the ad-justment for repeated measurements and the potential bias that may limit the informative value of this test. Pulse wave
Table 2 CO measurements and comparative analyses. CCOVolumeView, continuous cardiac output assessed by the new VolumeViewTM/EV1000TM monitoring platform; COREF, cardiac output determined by TPTD; CCOPiCCO, continuous cardiac output assessed by the PiCCO2TMsystem. NA, not available;SD, standard deviation; LoA, limits of agreement (¼2SD)
Mean (SD) (litre min21) Mean bias (LoA) (litre min21) Error (%) Correlation, r′′ Concordance (%) CCOVolumeView 6.7 (2.3) (2.5 –15.3) CCOVolumeView2COREF 20.1 (2.0) 29 0.83 81
CCOPiCCO 6.8 (2.5) (2.5 –16.2) CCOPiCCO2COREF +0.1 (2.5) 37 0.76 77
CCOREF 6.8 (2.4) (2.7 –18.6) CCOVolumeView2CCOPiCCO 20.1 (2.1) 31 0.82 NA
2 4 15 A B 10 5 0 –5 –10 –15 15 10 5 0 –5 –10 –15 6 8 10 12 n=338
Bias=0.03 litre min–1 Precision=1.24 litre min–1
n=338
Bias=0.07 litre min–1 Precision=1.00 litre min–1
(PiCCO+TPTD)/2 PiCCO–TPTD (VolumeView+TPTD)/2 V o lumeVie w–TPTD 14 16 18 Mean-1.96SD Mean Mean+196SD Mean-1.96SD Mean Mean+196SD 2 0 4 6 8 10 12 14 16 18
Fig 1Bland –Altman analysis for CCOVolumeView vs COREF(B) and CCOPiCCOvs COREF (A). VolumeView, continuous CO assessed by the new VolumeViewTM/EV1000TMmonitoring platform; TPTD¼CO
REF, cardiac output determined by transpulmonary thermodilution; PiCCO, continuous cardiac output assessed by the PiCCO2TMsystem. Dashed lines represent mean bias, upper and lower limits of agreement.
analysis devices in general have gained greater interest for continuous CO measurement recently6and are increasingly being applied in different patient settings today (e.g. un-calibrated systems based on radial arterial signal primar-ily for the management of perioperative goal-directed therapy)27 and systems based on a femoral signal that are calibrated by TPTD for the haemodynamic management of ICU patients. This can be attributed to the fact, that most of these devices can be easily handled, adequately used without major operator interference and that they provide ‘real time’ continuous CO28 and functional haemodynamic parameters such as stroke volume variation.29 However, despite the importance of further improvements of the algo-rithms optimal signal quality is a major prerequisite for reli-able CO assessment and major limitations need to be taken into account that include use of intra-aortic balloon pump and major arrhythmias. Clearly, modern algorithms may detect single ventricular extrasystoles and may exclude them for CO assessment. However, the performance of pulse wave analysis during absolute arrhythmia may limit their use.6 In recent years research and development has focused on non-calibrated pulse wave analysis devices and subsequent validation identified appropriate areas of appli-cation, but it also revealed the limits of the devices. A major issue is definitely the fact that limited accuracy may occur in situations of major changes and extremes of individ-ual vascular tone. It has to be emphasized that these vascu-lar tone effects may influence the performance of all pulse wave devices, if they have to be calibrated or not, to a various degree as this was observed in different studies.30–33 These effects may largely depend on the robustness of the algorithms and for the un-calibrated devices on their under-lying electronic databases that comprise nomograms and in-formation of the different vascular conditions.6In contrast, calibrated pulse wave analysis techniques such as the
VolumeViewTM/EV1000TM and the PiCCO
2TM system permit
an individual initial assessment of the cardiovascular condi-tion by the calibracondi-tion via TPTD, and when major haemo-dynamic instability (i.e. considerable changes in vascular tone) occurs, re-calibration allows for a situational adjust-ment, a ‘re-setting’ of continuous CO assessment.34 More-over, when general limitations for the use of pulse wave analysis devices are present, intermittent TPTD can still be used for reliable CO determination and thirdly, TPTD provides additional haemodynamic parameters such as global end-diastolic volume (GEDV) and extravascular lung water (EVLW). GEDV has shown in recent years to be a superior indicator of cardiac preload than standard pressure parameters35 36and EVLW can be useful in the treatment of a pulmonary oedema or acute respiratory distress syndrome37 38 and as a prognostic marker in critically ill patients.39
The following limitations need to be considered when interpreting the data of the actual study: TPTD was used as a reference technique and not as an independent CO meas-urement technique such as an aorta Doppler probe or PATD. However, given the fact that there is no gold standard for CO measurements it seems to be reasonable to use TPTD, which has been shown to provide CO measurements as accurate as the PATD.40Moreover, CCO was not simultaneously assessed by two different devices connected to two different femoral arterial lines but directly to only one device, the VolumeViewTM/EV1000TM and the data were then
transmit-ted to the PiCCO2TM monitor. However, this approach can
be considered acceptable for technical and ethical reasons and is frequently used.14 15Furthermore, this study was not designed to specifically assess the CCO performance during massive haemodynamic instability and major changes of vascular tone in a mixed ICU patient population with a pre-dominant set of patients after cardiac surgery. Thus, our results must be interpreted within the context of the
100 A B 80 60 40 20 0 –20 –40 –60 –80 –100 100 80 60 40 20 0 –20 –40 –60 –80 –100 –100 –80 –60 –40 –20 TPTD % change TPTD % change PiCCO % change V o lumeVie w % change 0 20 40 60 80 100 –100 –80 –60 –40 –20 0 20 40 60 80 100 n=338 Exclusion zone 15% Excluded n=204; Analysis n=134 Concordance=77% n=338 Exclusion zone 15% Excluded n=207; Analysis n=131 Concordance=81%
Fig 2 Concordance plot for % changes of CCOVolumeViewvs COREF(B) and CCOPiCCOvs COREF(A). VolumeView, continuous CO assessed by the new VolumeViewTM/EV1000TMmonitoring platform; TPTD¼CO
REF, cardiac output determined by transpulmonary thermodilution; PiCCO, continuous cardiac output assessed by the PiCCO2TM system. Data points within the 15% exclusion zone (white points) are excluded from analysis.
chosen setting as it is very difficult to make clear the expected results in patients with highly variable vascular tone, sudden changes in CO and needing vasoactive drugs.
Conclusions
In conclusion, in a mixed ICU population and a wide range of clinical situations the new VolumeViewTM-CCO method
per-formed as accurately as the PiCCO2TM-CCO pulse wave
ana-lysis. Furthermore, an improved precision was observed for the VolumeViewTM technique.
Authors’ contributions
A.H., C.K.H., G.M., and K.B. conceived the study. N.K., C.K.H., M.G., T.P.S., and N.S. collected the data. K.B. and C.K.H. carried out the statistical analysis and drafted the manu-script. All authors read and approved the final manumanu-script.
Acknowledgements
The study was supported by Kate Willybiro and Gene Liu (Edwards Lifesciences, Irvine, CA, USA) for data collection and by Frederic Michard (Edwards Lifesciences, Nyon, Switz-erland) for design and review.
Declaration of interest
K.B. has received consultant fees from Edwards Lifesciences and Novartis. G.M. has received speakers’ honoraria, consult-ant fees and a research grconsult-ant from Edwards Lifesciences. N.K. has received speakers’ honoraria from Edwards Lifesciences and support for congress fees. C.K.H. has received speakers’ honoraria and research grants from Edwards Lifesciences, Pulsion Medical Systems, and CSL Behring, Berne, Switzer-land. A.H. has received speakers’ honoraria from Edwards Lifesciences. M.G., T.P.S., and N.S. have no potential conflicts of interest to declare.
References
1 Pinsky MR, Payen D. Functional haemodynamic monitoring. Crit Care 2005; 9: 566 –72
2 Harvey S, Harrison DA, Singer M, et al. Assessment of the clinical effectiveness of pulmonary artery catheters in management of patients in intensive care (PAC-Man): a randomised controlled trial. Lancet 2005; 366: 472– 7
3 Schwann NM, Hillel Z, Hoeft A, et al. Lack of effectiveness of the pulmonary artery catheter in cardiac surgery. Anesth Analg 2011; 113: 994– 1002
4 Vincent JL. So we use less pulmonary artery catheters– but why? Crit Care Med 2011; 39: 1820–2
5 Koo KK, Sun JC, Zhou Q, et al. Pulmonary artery catheters: evolv-ing rates and reasons for use. Crit Care Med 2011; 39: 1613– 8 6 Alhashemi JA, Cecconi M, Hofer CK. Cardiac output monitoring: an
integrative perspective. Crit Care 2011; 15: 214
7 Hofer CK, Cecconi M, Marx G, della Rocca G. Minimally invasive haemodynamic monitoring. Eur J Anaesthesiol 2009; 26: 996–1002 8 Reuter DA, Huang C, Edrich T, Shernan SK, Eltzschig HK. Cardiac output monitoring using indicator-dilution techniques: basics, limits, and perspectives. Anesth Analg 2010; 110: 799– 811
9 Bendjelid K, Giraud R, Siegenthaler N, Michard F. Validation of a new transpulmonary thermodilution system to assess global end-diastolic volume and extravascular lung water. Crit Care 2010; 14: R209
10 Kiefer N, Hofer CK, Marx G, et al. Clinical validation of a new ther-modilution system for the assessment of cardiac output and volumetric parameters. Crit Care 2012; 16: R98
11 Della Rocca G, Costa MG, Coccia C, et al. Cardiac output monitor-ing: aortic transpulmonary thermodilution and pulse contour analysis agree with standard thermodilution methods in patients undergoing lung transplantation. Can J Anaesth 2003; 50: 707– 11
12 Godje O, Hoke K, Goetz AE, et al. Reliability of a new algorithm for continuous cardiac output determination by pulse-contour ana-lysis during hemodynamic instability. Crit Care Med 2002; 30: 52–8
13 Felbinger TW, Reuter DA, Eltzschig HK, Moerstedt K, Goedje O, Goetz AE. Comparison of pulmonary arterial thermodilution and arterial pulse contour analysis: evaluation of a new algorithm. J Clin Anesth 2002; 14: 296 –301
14 de Wilde RB, Schreuder JJ, van den Berg PC, Jansen JR. An evalu-ation of cardiac output by five arterial pulse contour techniques during cardiac surgery. Anaesthesia 2007; 62: 760–8
15 Hadian M, Kim HK, Severyn DA, Pinsky MR. Cross-comparison of cardiac output trending accuracy of LiDCO, PiCCO, FloTrac and pulmonary artery catheters. Crit Care 2010; 14: R212
16 Wesseling KH. Pulse contour cardiac output as a clinically valu-able tool for intensive patient monitoring. A critique of a recent paper. Basic Res Cardiol 1977; 72: 82 –8
17 Westerhof N, Lankhaar JW, Westerhof BE. The arterial Windkes-sel. Med Biol Eng Comput 2009; 47: 131– 41
18 Wesseling KH, Jansen JR, Settels JJ, Schreuder JJ. Computation of aortic flow from pressure in humans using a nonlinear, three-element model. J Appl Physiol 1993; 74: 2566–73 19 Pratt B, Roteliuk L, Hatib F, Frazier J, Wallen RD. Calculating
arterial pressure-based cardiac output using a novel measure-ment and analysis method. Biomed Instrum Technol 2007; 41: 403– 11
20 Langewouters GJ, Wesseling KH, Goedhard WJ. The static elastic properties of 45 human thoracic and 20 abdominal aortas in vitro and the parameters of a new model. J Biomech 1984; 17: 425– 35 21 Bland JM, Altman DG. Statistical methods for assessing agree-ment between two methods of clinical measureagree-ment. Lancet 1986; 1: 307– 10
22 Critchley LA, Critchley JA. A meta-analysis of studies using bias and precision statistics to compare cardiac output measurement techniques. J Clin Monit Comput 1999; 15: 85 –91
23 Critchley LA, Lee A, Ho AM. A critical review of the ability of con-tinuous cardiac output monitors to measure trends in cardiac output. Anesth Analg 2010; 111: 1180–92
24 Rodig G, Prasser C, Keyl C, Liebold A, Hobbhahn J. Continuous cardiac output measurement: pulse contour analysis vs thermo-dilution technique in cardiac surgical patients. Br J Anaesth 1999; 82: 525 –30
25 Parker KH. A brief history of arterial wave mechanics. Med Biol Eng Comput 2009; 47: 111– 8
26 Peyton PJ, Chong SW. Minimally invasive measurement of cardiac output during surgery and critical care: a meta-analysis of accur-acy and precision. Anesthesiology 2010; 113: 1220– 35
27 Pearse R, Dawson D, Fawcett J, Rhodes A, Grounds RM, Bennett ED. Early goal-directed therapy after major surgery reduces complications and duration of hospital stay. A
randomised, controlled trial [ISRCTN38797445]. Crit Care 2005; 9: R687–93
28 Hofer CK, Ganter MT, Zollinger A. What technique should I use to measure cardiac output? Curr Opin Crit Care 2007; 13: 308 –17 29 Marik PE, Cavallazzi R, Vasu T, Hirani A. Dynamic changes in
arter-ial waveform derived variables and fluid responsiveness in mech-anically ventilated patients: a systematic review of the literature. Crit Care Med 2009; 37: 2642–7
30 Bein B, Meybohm P, Cavus E, et al. The reliability of pulse contour-derived cardiac output during haemorrhage and after vasopres-sor administration. Anesth Analg 2007; 105: 107 –13
31 Biais M, Nouette-Gaulain K, Cottenceau V, et al. Cardiac output measurement in patients undergoing liver transplantation: pul-monary artery catheter versus uncalibrated arterial pressure wave-form analysis. Anesth Analg 2008; 106: 1480–6, table of contents 32 Yamashita K, Nishiyama T, Yokoyama T, Abe H, Manabe M. Effects of vasodilation on cardiac output measured by PulseCO. J Clin Monit Comput 2007; 21: 335 –9
33 Yamashita K, Nishiyama T, Yokoyama T, Abe H, Manabe M. The effects of vasodilation on cardiac output measured by PiCCO. J Cardiothorac Vasc Anesth 2008; 22: 688 –92
34 Hamzaoui O, Monnet X, Richard C, Osman D, Chemla D, Teboul JL. Effects of changes in vascular tone on the agreement between
pulse contour and transpulmonary thermodilution cardiac output measurements within an up to 6-hour calibration-free period. Crit Care Med 2008; 36: 434 –40
35 Hofer CK, Furrer L, Matter-Ensner S, et al. Volumetric preload measurement by thermodilution: a comparison with transoeso-phageal echocardiography. Br J Anaesth 2005; 94: 748 –55 36 Michard F, Alaya S, Zarka V, Bahloul M, Richard C, Teboul JL. Global
end-diastolic volume as an indicator of cardiac preload in patients with septic shock. Chest 2003; 124: 1900–8
37 Mitchell JP, Schuller D, Calandrino FS, Schuster DP. Improved outcome based on fluid management in critically ill patients re-quiring pulmonary artery catheterization. Am Rev Respir Dis 1992; 145: 990– 8
38 Monnet X, Anguel N, Osman D, Hamzaoui O, Richard C, Teboul JL. Assessing pulmonary permeability by transpulmonary thermodi-lution allows differentiation of hydrostatic pulmonary edema from ALI/ARDS. Intensive Care Med 2007; 33: 448 –53
39 Sakka SG, Klein M, Reinhart K, Meier-Hellmann A. Prognostic value of extravascular lung water in critically ill patients. Chest 2002; 122: 2080– 6
40 Sakka SG, Reinhart K, Meier-Hellmann A. Comparison of pulmon-ary artery and arterial thermodilution cardiac output in critically ill patients. Intensive Care Med 1999; 25: 843 –6